Copyright
©The Author(s) 2001.
World J Gastroenterol. Aug 15, 2001; 7(4): 537-541
Published online Aug 15, 2001. doi: 10.3748/wjg.v7.i4.537
Published online Aug 15, 2001. doi: 10.3748/wjg.v7.i4.537
Figure 1 Proliferation of dendritic cell population in in vitro culture.
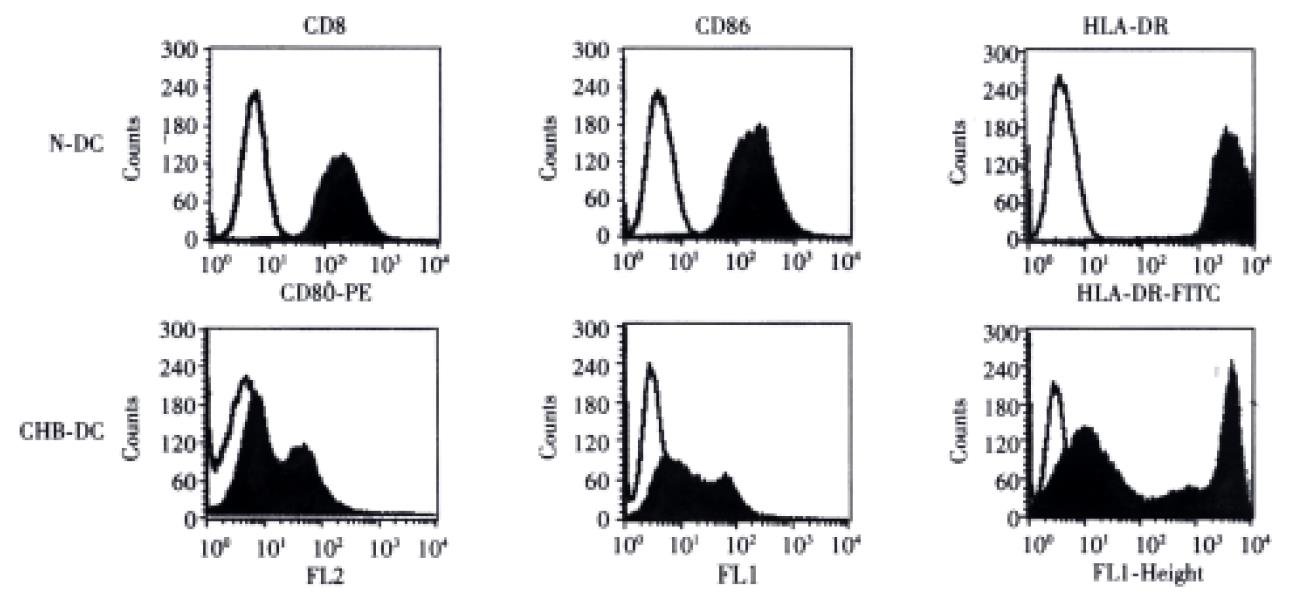
Figure 2 Comparison of fluorescent intensities of flow cytometric analyses on surface of dendritic cells (DCs) from a representative of HBV-infected patients (HB-DC) and a representative of uninfected healthy donors (N-DC).
The green line is for signals from controls (DCs stained with mouse IgG2 instead of specific antibody against surface marker of DCs). The green line with purple color represents the signals obtained from surface of DCs stained with corresponding specific antibody. Note the shift to the left in the peak with increasing expression of surface markers on DCs. Two other independent experiments gave similar results.
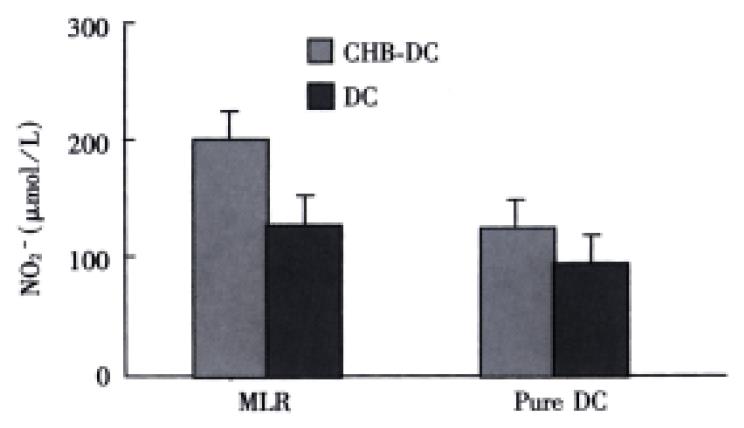
Figure 3 Increased NO production by DCs from HBV-infected patients.
All the T cells (2 × 10⁵/well) were donated from a healthy volunteer in AMLR DC (1 × 10⁴ well-1) from patients with chronic hepatitis type B (CHB) and healthy donors were cultured for 5d. Pure population of DCs (1 × 10⁹·L-1) isolated by the cytokine enrich-ment method were cultured with SAC I strain 75 mg·L-1 for 48 h.
- Citation: Wang FS, Xing LH, Liu MX, Zhu CL, Liu HG, Wang HF, Lei ZY. Dysfunction of peripheral blood dendritic cells from patients with chronic hepatitis B virus infection. World J Gastroenterol 2001; 7(4): 537-541
- URL: https://www.wjgnet.com/1007-9327/full/v7/i4/537.htm
- DOI: https://dx.doi.org/10.3748/wjg.v7.i4.537


