Copyright
©The Author(s) 2001.
World J Gastroenterol. Aug 15, 2001; 7(4): 515-521
Published online Aug 15, 2001. doi: 10.3748/wjg.v7.i4.515
Published online Aug 15, 2001. doi: 10.3748/wjg.v7.i4.515
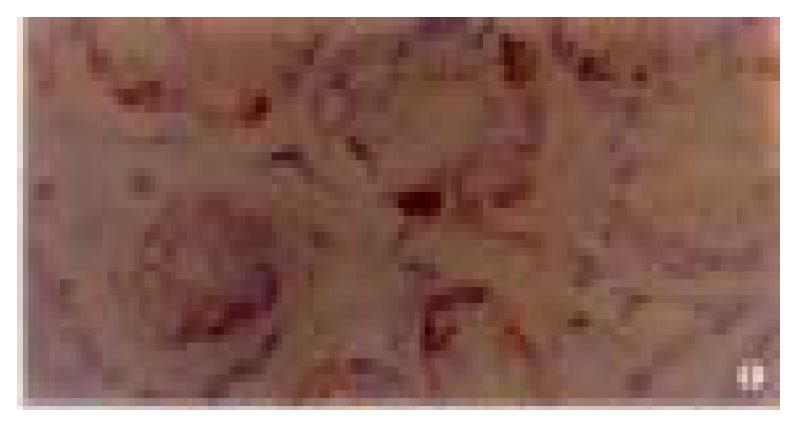
Figure 1 p16 protein expression in normal gastric mucosa.
× 400
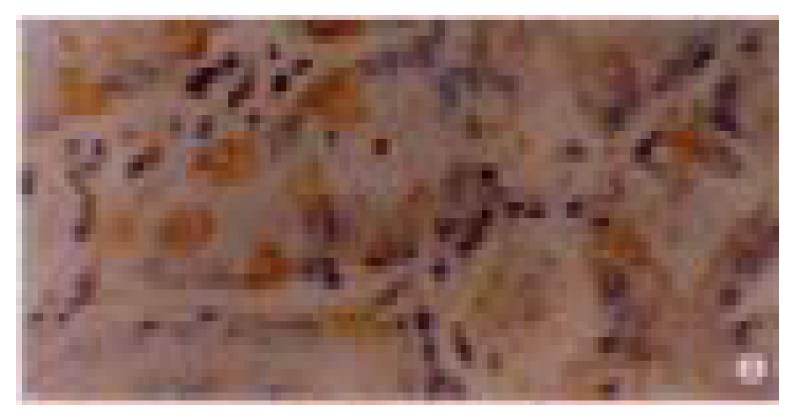
Figure 2 p16 protein expression in dysplastic gastric mucosa.
× 400
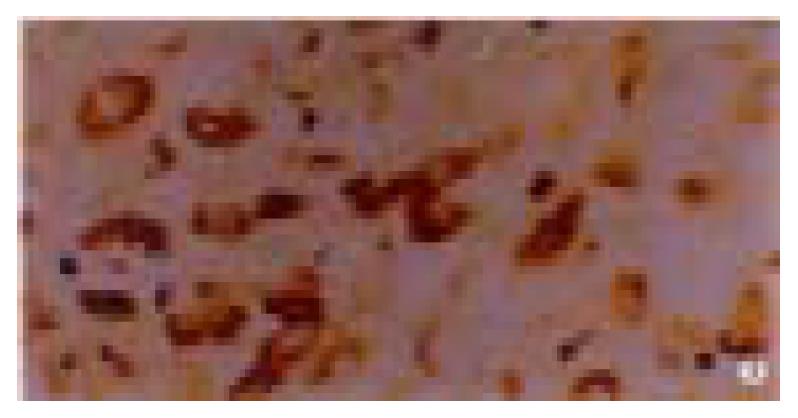
Figure 3 p16 protein expression in gastric carcinoma.
Immunohistochemic stain. Arrow shows the undifferentiated carcinoma positive cell. × 400
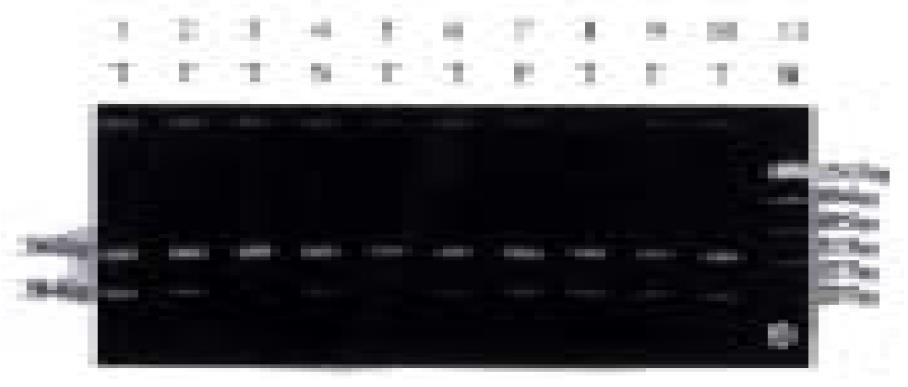
Figure 4 PCR amplification product in exon 2 of p16 gene.
Lines 1-4, 5-6, 8-10 (T: gastric cancer); Line 7 (P: tumor adjacent tissue); Line 4 (N: normal gastric mucosa); Line 11 (M: marker) Little PCR product in line 3 and no PCR product in line 5.
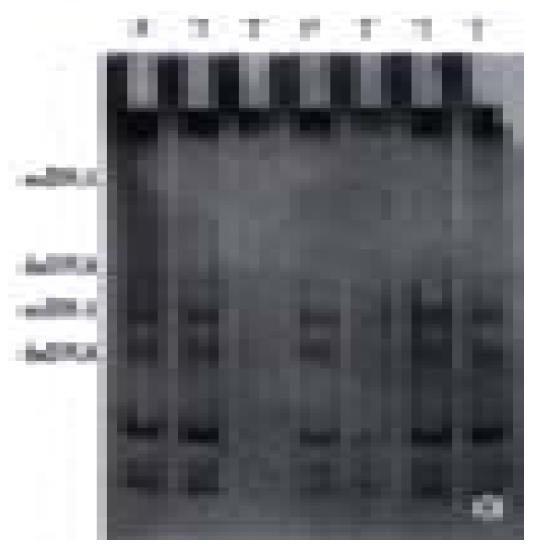
Figure 5 The exon 2 of p16 gene analyzed by SSCP.
segment a 135 bp, segment b 249 bp. Lines 2, 3, 5, 6, 7 (T: gastric cancer); Line 4 (P: tumor adjacent tissue); Line 1 (N: normal gastric mucosa). No electrophoresis band on line 3, weak electrophoresis band on line 5, and no abnormal electrophoresis band in all lines.
Figure 6 The length of PCR amplification of p16 gene exon 2 and the Sam I (CCCGGG) restriction site.
-
Citation: He XS, Su Q, Chen ZC, He XT, Long ZF, Ling H, Zhang LR. Expression, deleton and mutation of
p16 gene in human gastric cancer. World J Gastroenterol 2001; 7(4): 515-521 - URL: https://www.wjgnet.com/1007-9327/full/v7/i4/515.htm
- DOI: https://dx.doi.org/10.3748/wjg.v7.i4.515


