Copyright
©The Author(s) 2001.
World J Gastroenterol. Jun 15, 2001; 7(3): 370-375
Published online Jun 15, 2001. doi: 10.3748/wjg.v7.i3.370
Published online Jun 15, 2001. doi: 10.3748/wjg.v7.i3.370
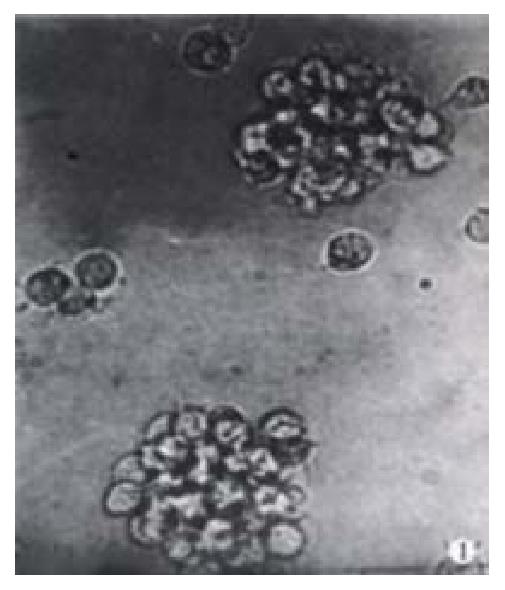
Figure 1 There was increasing development of cell aggregates of proliferative lymphoblast cells.
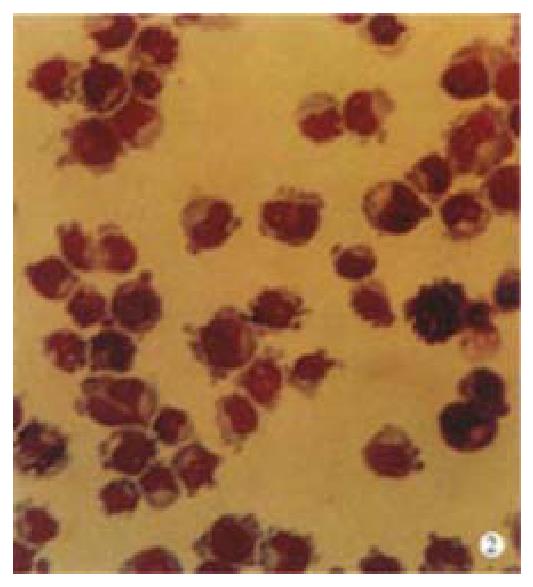
Figure 2 The immortal cell line of human peripheral blood mononuclear cells transformed by Epstein-Barr virus.
The cell bodies are larger and sphereical. There are the false foot-like hairs or thorns on their surface. The cell nuclei are large and varied. The cells multiply and grow as cell regiments or clusters.
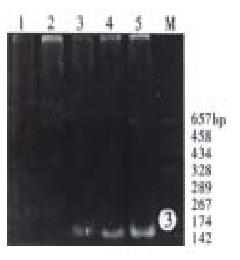
Figure 3 Identification of HCV RNA with RT-PCR in serum and PBMC with the chronic hepatitis C patient.
Lane 1: negative control; Lane 2: the last wash; Lane 3: HCV RNA positive serum; Lane 4: PBMC from hepatitis C patient; Lane 5: positive control. Lane M: pGEM-72f(+)/Hae III markers
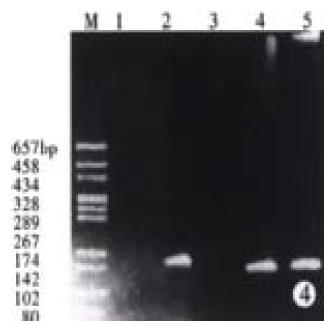
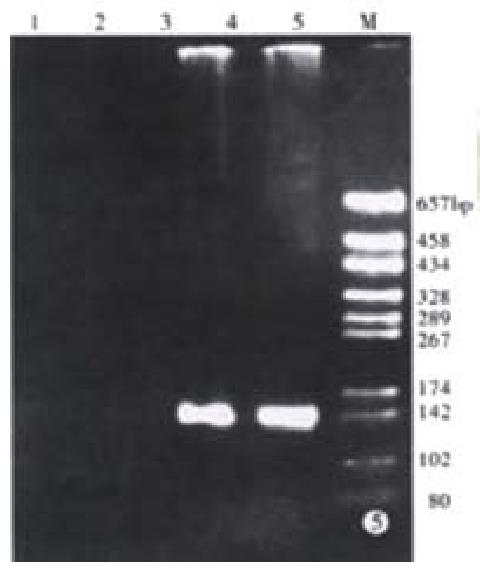
Figure 4 Identification of HCV RNA plus-strand with RT-PCR in the EBV transformed PBMC and the growth medium.
Lane 1: Negative control; Lane 2: LCL cells; Lane 3: the last wash of LCL; Lane 4: growth medium; Lane 5: positive control; Lane M: pGEM-72f(+)/Hae III markers
Figure 5 HCV RNA minus strand with RT-PCR in the EBV transformed PBMC and the growth medium.
Lane 1: Negative control; Lane 2: growth medium; Lane 3: In cells; Lane 4: Positive control; Lane M: pGEM-72f(+)/Hae III markers
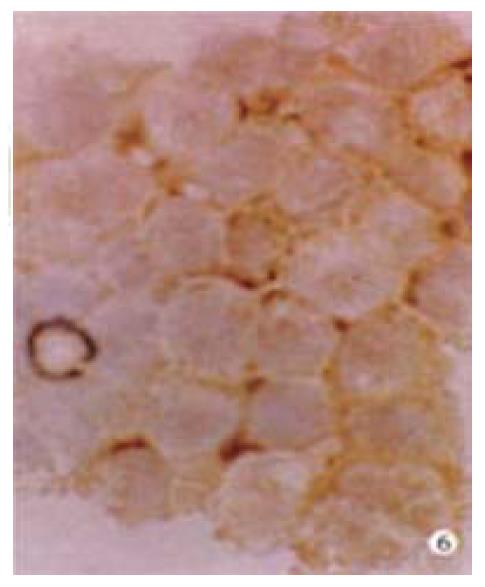
Figure 6 Immunohistochemical SP method, DAB staining and hematoxylin counter staining of cell nuclei.
NS3 antibody positive granules seen as a brown lump in the cytoplasm of LCL. × 400
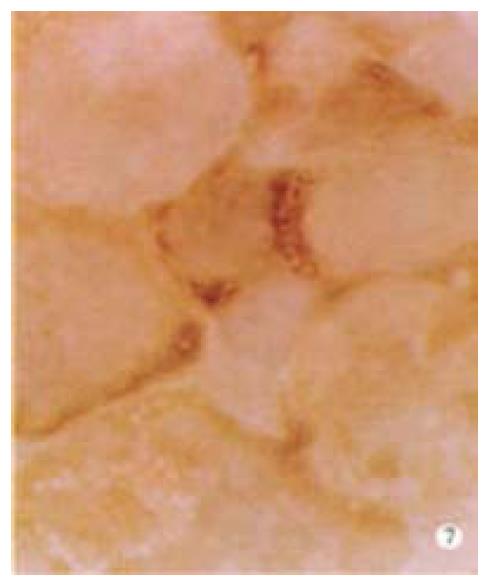
Figure 7 Immunohistochemical SP method, DAB staining and hematoxylin counter-staining cell nuclei.
Core antibody positive granules are seen as a brown lump with in the cytoplasm of LCL. × 400
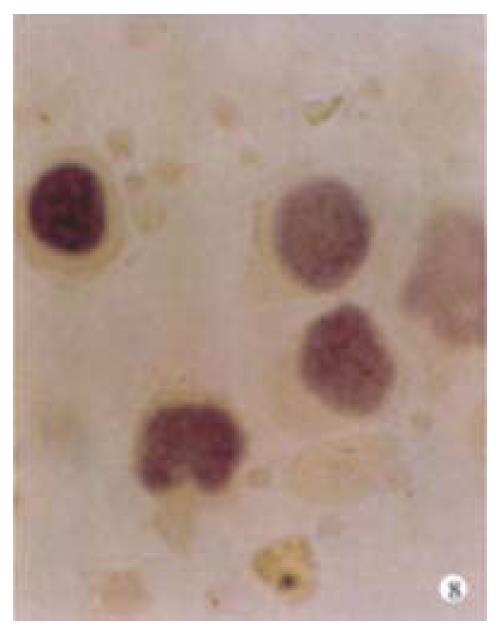
Figure 8 Immunohistochemical negative control (anti-HBs replaced anti-HCV), a positive brown granule is not seen in the cytoplasm.
× 400
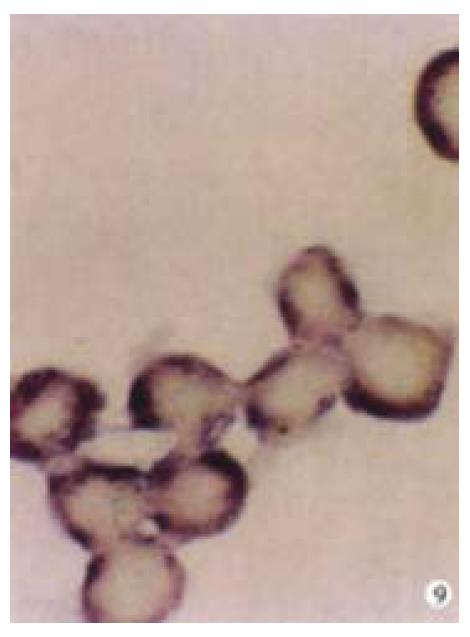
Figure 9 The blue-black positive signals of HCV RNA are exhibited in the LCL cell plasma but not in the nucleolus.
× 400
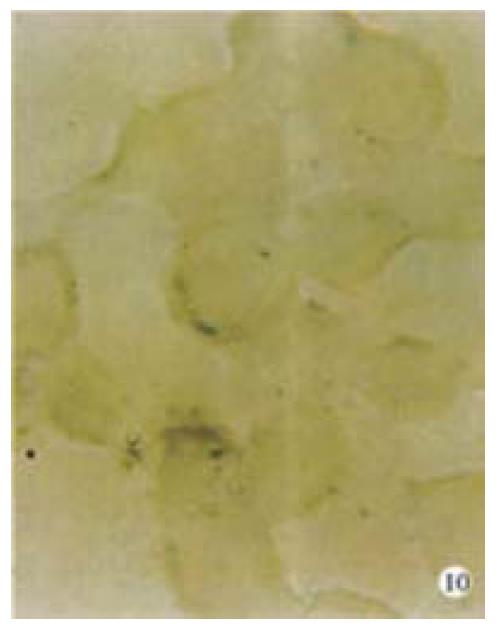
Figure 10 The blue-black signals are not exhibited in negative control cells in situ RT-PCR.
× 400
- Citation: Cheng JL, Liu BL, Zhang Y, Tong WB, Yan Z, Feng BF. Hepatitis C virus in human B lymphocytes transformed by Epstein-Barr virus in vitro by in situ reverse transcriptase-polymerase chain reaction. World J Gastroenterol 2001; 7(3): 370-375
- URL: https://www.wjgnet.com/1007-9327/full/v7/i3/370.htm
- DOI: https://dx.doi.org/10.3748/wjg.v7.i3.370


