Copyright
©The Author(s) 2001.
World J Gastroenterol. Feb 15, 2001; 7(1): 111-114
Published online Feb 15, 2001. doi: 10.3748/wjg.v7.i1.111
Published online Feb 15, 2001. doi: 10.3748/wjg.v7.i1.111
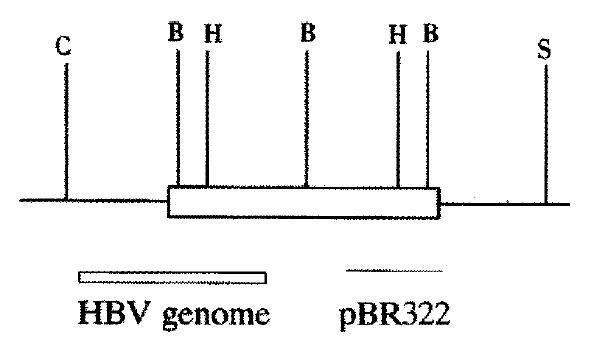
Figure 1 Restriction map and microinfection fragment of padr-1-dimer.
C: Cla I; B: Bam HI; H: Hind III; S: Sal I
Figure 2 Southern-blot analysis of the HBV transgenic mice.
Lane 1: positive control; Lane 2: negative control; Lane3-6: transgenic mouse
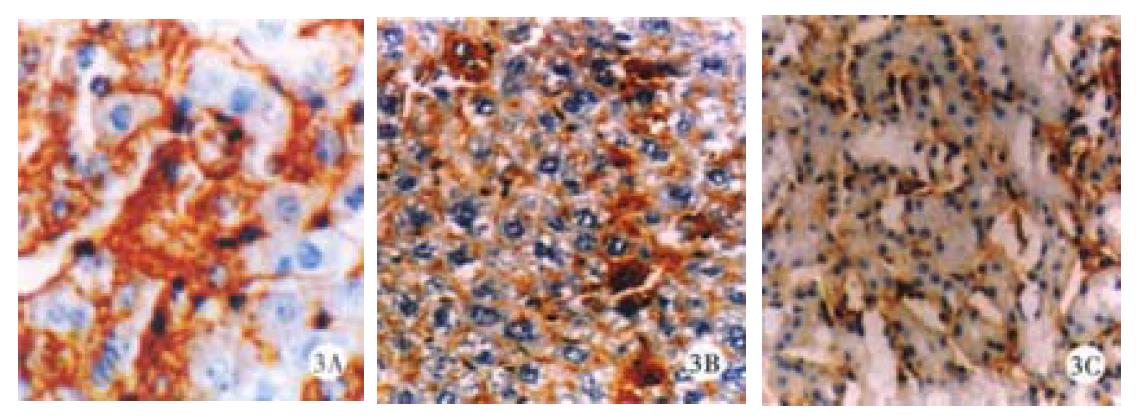
Figure 3 Immunohistochemical analysis of HBV antigens in transgenic mouse tissues.
A. HBsAg in the liver; B. HBcAg in the liver; C. HBsAg in the kidney
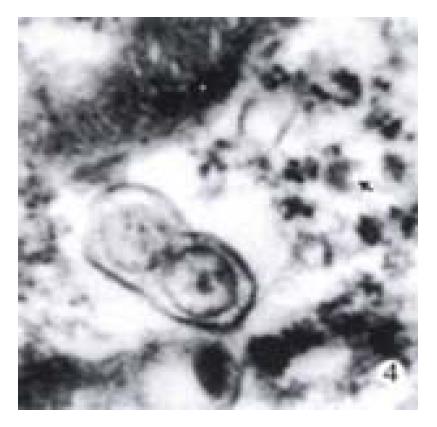
Figure 4 Dane’s particles under electron microscope.
- Citation: Hu YP, Hu WJ, Zheng WC, Li JX, Dai DS, Wang XM, Zhang SZ, Yu HY, Sun W, Hao GR. Establishment of transgenic mouse harboring hepatitis B virus (adr subtype) genomes. World J Gastroenterol 2001; 7(1): 111-114
- URL: https://www.wjgnet.com/1007-9327/full/v7/i1/111.htm
- DOI: https://dx.doi.org/10.3748/wjg.v7.i1.111


