Copyright
©The Author(s) 2000.
World J Gastroenterol. Jun 15, 2000; 6(3): 361-364
Published online Jun 15, 2000. doi: 10.3748/wjg.v6.i3.361
Published online Jun 15, 2000. doi: 10.3748/wjg.v6.i3.361
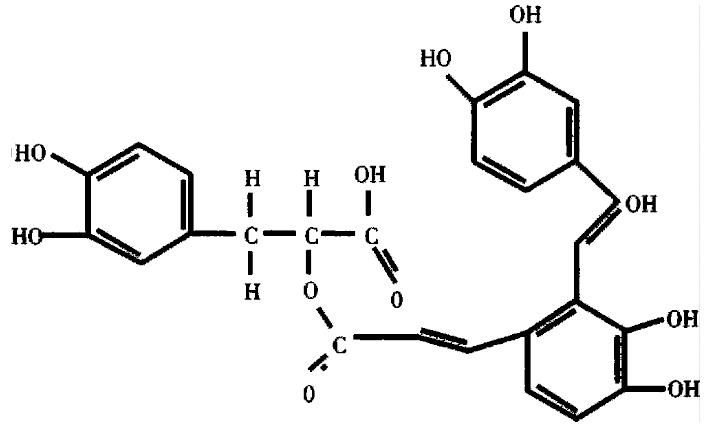
Figure 1 SA-A molecular structure.
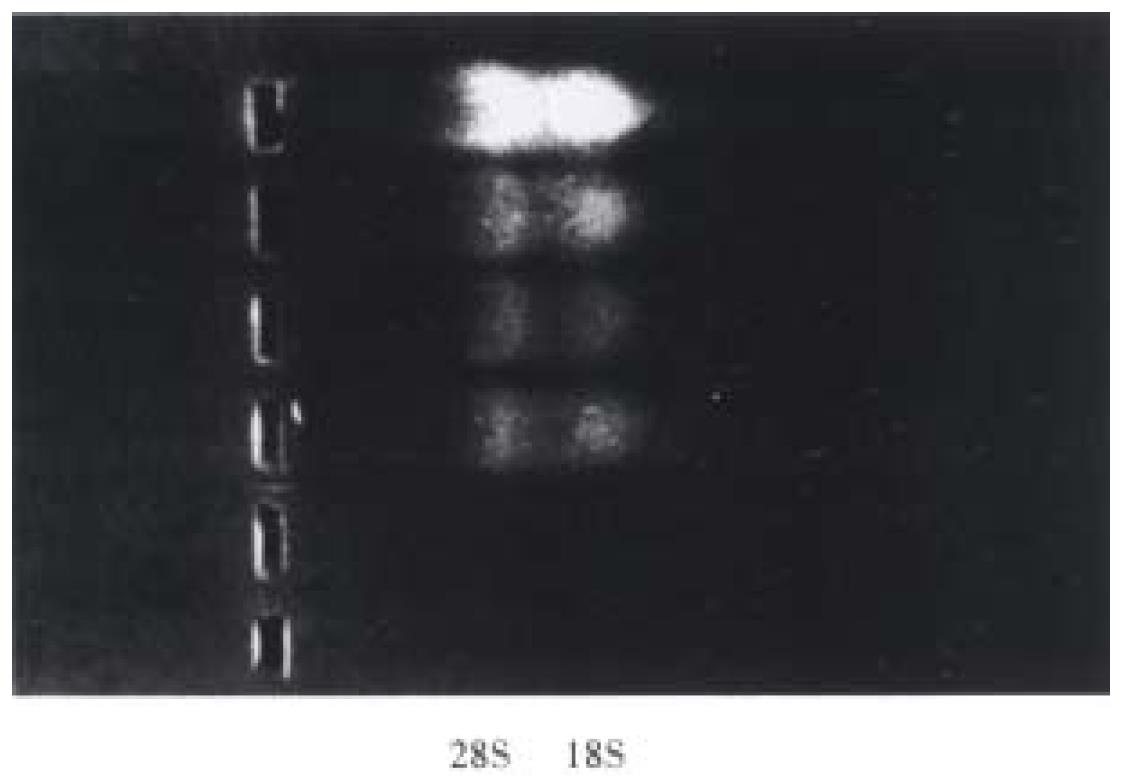
Figure 2 Total RNA gel electrophoresis photograph.
28S and 18S of total RNA run on 9 g/L agarose gel stained with EB.
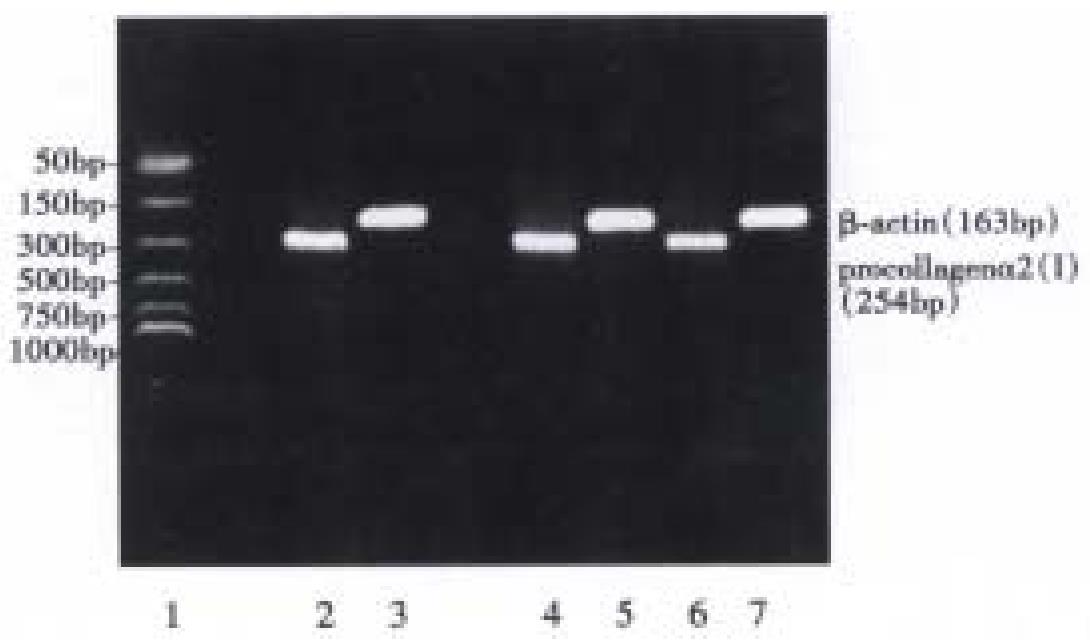
Figure 3 RT-PCR product gel electrophoresis photograph.
Five μL RT-PCR products of procollagen α2(I) and β-actin run on 1.5% agarose gel stained with EB. Lane 1 as PCR marker, lane 2 and 3 as the control for procollagen α2(I) and β-actin respectively, lane 4 and 5 SA-A 10-6 mol/L for procollagen α2(I) and β-actin respectively, lane 6 and 7 as SA-A 10-5 mol/L for procollagen α2(I) and β-actin respectively.
- Citation: Liu CH, Hu YY, Wang XL, Xu LM, Liu P. Effects of salvianolic acid-A on NIH/3T3 fibroblast proliferation, collagen synthesis and gene expression. World J Gastroenterol 2000; 6(3): 361-364
- URL: https://www.wjgnet.com/1007-9327/full/v6/i3/361.htm
- DOI: https://dx.doi.org/10.3748/wjg.v6.i3.361


