Copyright
©The Author(s) 2000.
World J Gastroenterol. Feb 15, 2000; 6(1): 74-78
Published online Feb 15, 2000. doi: 10.3748/wjg.v6.i1.74
Published online Feb 15, 2000. doi: 10.3748/wjg.v6.i1.74
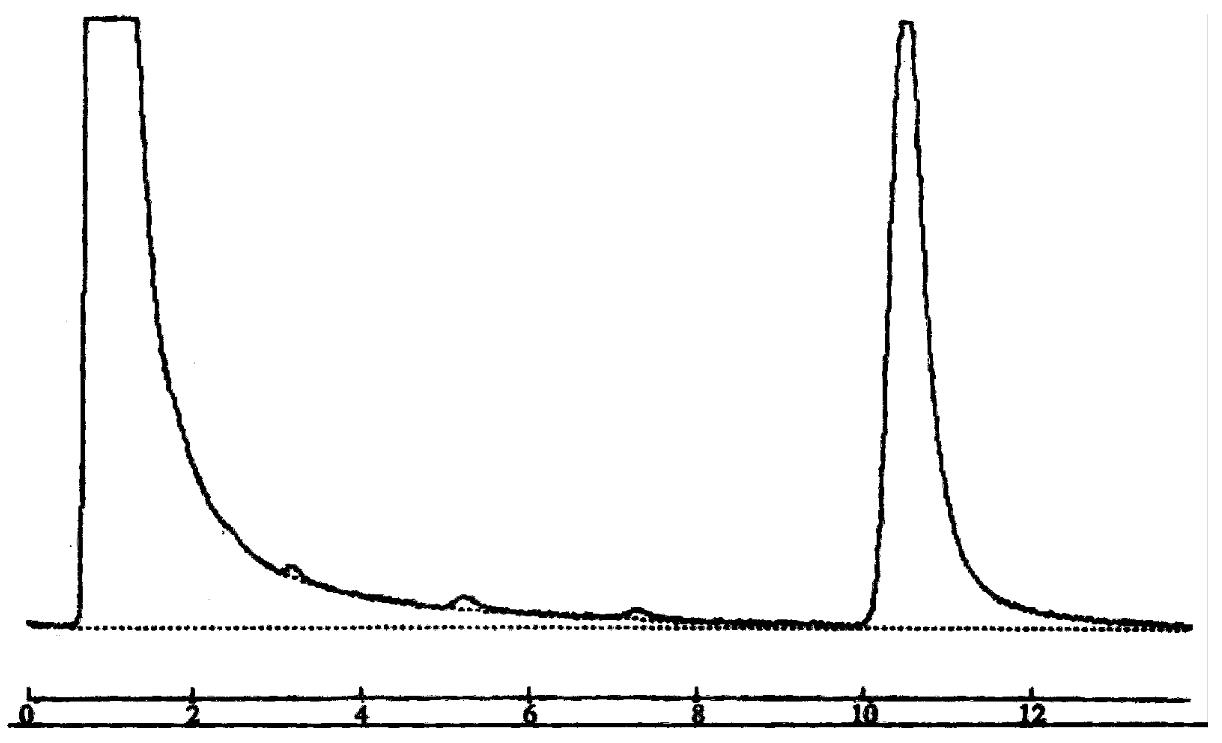
Figure 1 Chromatograms of propranolol after incubati on with rat hepatic microsome.
A Shim-pack CLC-ODS column (15 cm × 0.6 cm i.d.) was used. The mobile phase was constituted with ammonium acetate buffer (pH 4.0)-methanol (50:50) with flow rate at 1.0 mL/min. Propranolol was monitored at 290nm. Propranolol: tR = 10.1 min.
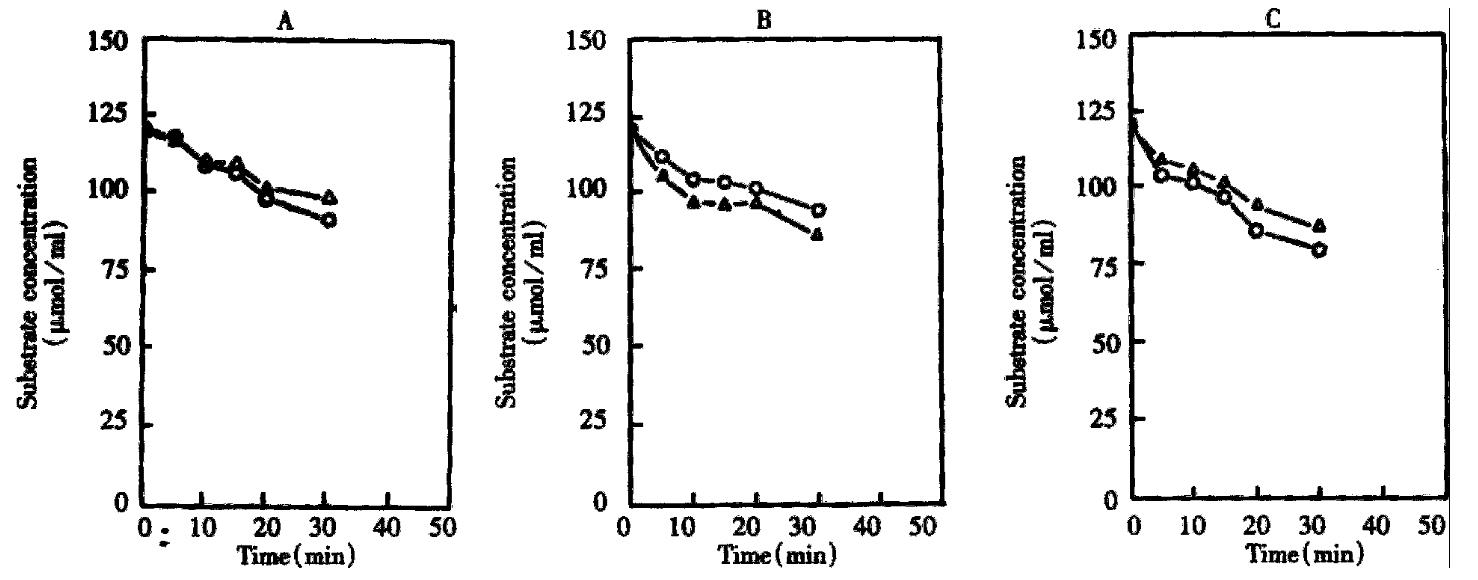
Figure 2 Concentration time curves for R (+) and S (-)-propranolol metabolism in rat hepatic microsomes.
A. Microsome of control. B. Microsome induced by BNF. C. Microsome induced by PB. △—△: R( + )-propranolol. ○—○: S (-)-propranolol.
- Citation: Li X, Zeng S. Stereoselective propranolol metabolism in two drug induced rat hepatic microsomes. World J Gastroenterol 2000; 6(1): 74-78
- URL: https://www.wjgnet.com/1007-9327/full/v6/i1/74.htm
- DOI: https://dx.doi.org/10.3748/wjg.v6.i1.74


