Copyright
©The Author(s) 1999.
World J Gastroenterol. Aug 15, 1999; 5(4): 289-295
Published online Aug 15, 1999. doi: 10.3748/wjg.v5.i4.289
Published online Aug 15, 1999. doi: 10.3748/wjg.v5.i4.289
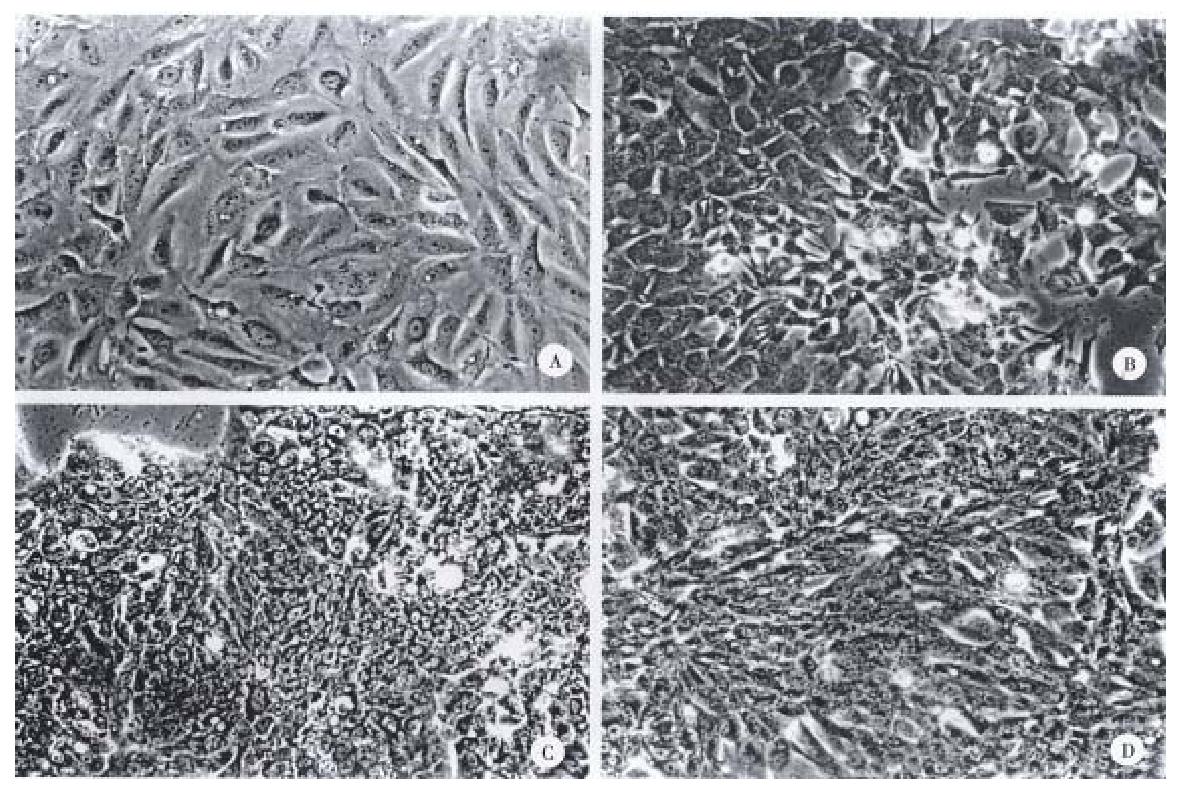
Figure 1 Microscopic features of cell lines and their original tumors where the cell lines were derived.
A, B, C, D, show cell line morphology of SNU-739, SNU-761, SNU-878 and SNU-886 respectively.
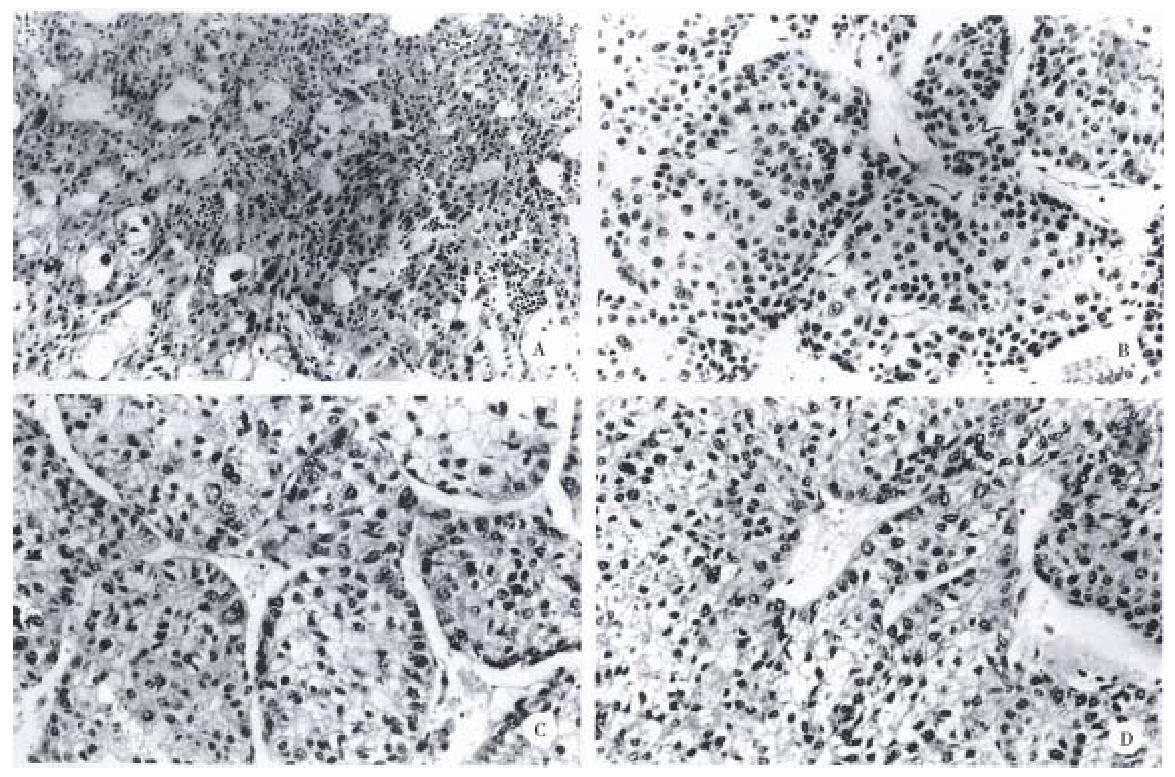
Figure 2 A, B, C, and D, show original tumor morphology of each cell line.
Scale bars, 50 μm.
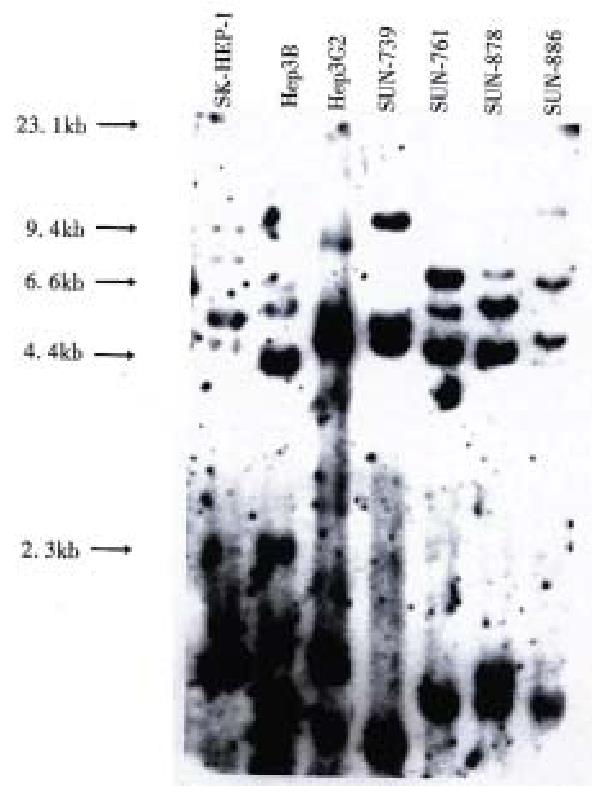
Figure 3 DNA profile of 4 HCC cell lines.
The DNA profiles of Southern blotting. Genomic DNAs from 4 HCC cell lines were digested with Hinf I and hybridized with ChdTC-15, ChdTC-114 and pYNH24. It is evident that the 4 HCC cell lines are unique and unrelated.
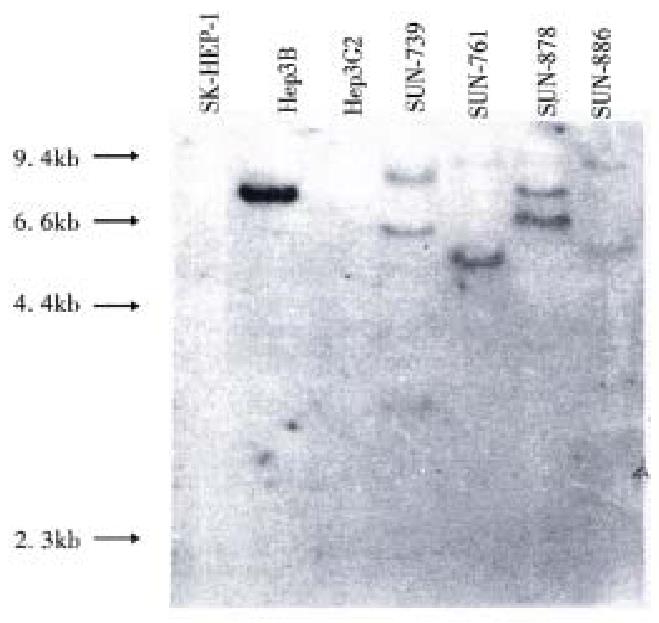
Figure 4 Integration of HBV DNA in genomic DNA of 4 HCC cell lines.
Different size and pattern of bands indicate random integration of HBV DNA in genome of the cell lines. A band is also seen in Hep3B, which is a HBV integrated cell line.
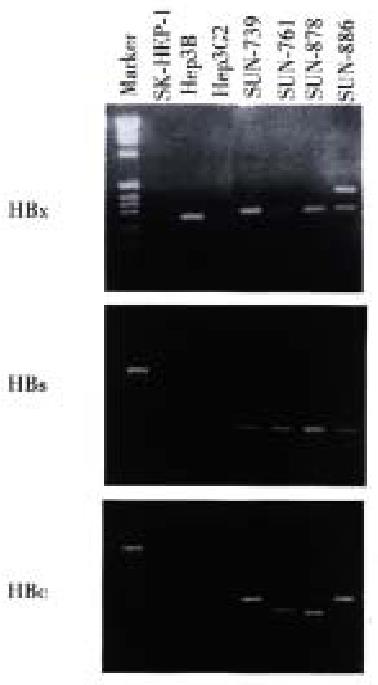
Figure 5 HBx, HBs and HBc RNA transcripts in 4 HCC cell lines.
In RT-PCR analysis, HBx, HBs, and HBc gene transcripts were detected in all presenting cell lines. Among the cell lines used as control (SK-HEP -1, Hep3B and HepG2), HBX gene transcript was detected in Hep3B line. HBs and HBc gene transcripts were not detected in any of the three control lines.
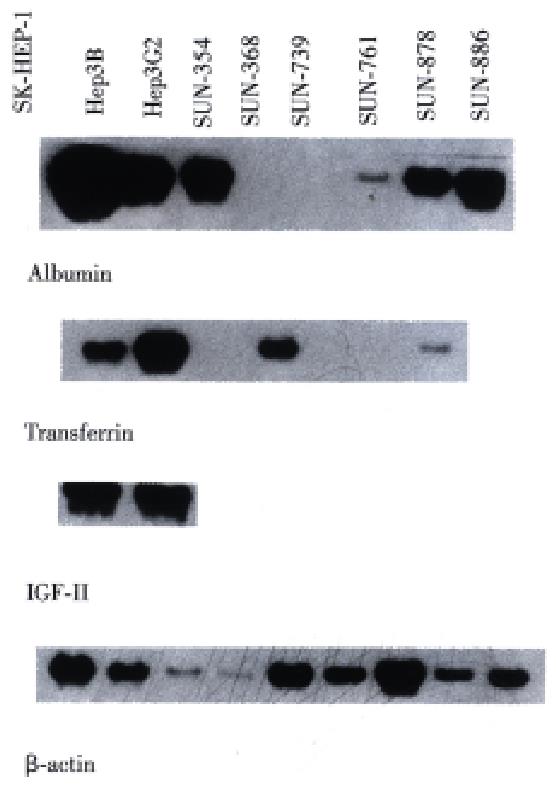
Figure 6 RNA expression of albumin, transferrin and IGF-II in 4 HCC cell lines.
RNA for albumin was detected in the SNU-761, SNU-878, SNU-886, Hep 3B, HepG2 and SNU-354 (previously reported HBV integrated cell line). RNA for transferrin was detected in the SNU-878 and SNU-886 cells lines, however the band in SNU -886 line was very faint to be hardly visible. The same sized band was also detected in Hep3B, HepG2 and SNU-368 (another previously reported HBV integrated cell). RNA for IGF- II was expressed in none of the presenting four cell lines, but it was expressed in Hep3B and HepG2 lines.
- Citation: Lee JH, Ku JL, Park YJ, Lee KU, Kim WH, Park JG. Establishment and characterization of four human hepatocellular carcinoma cell lines containing hepatitis B virus DNA. World J Gastroenterol 1999; 5(4): 289-295
- URL: https://www.wjgnet.com/1007-9327/full/v5/i4/289.htm
- DOI: https://dx.doi.org/10.3748/wjg.v5.i4.289


