Copyright
©The Author(s) 1999.
World J Gastroenterol. Aug 15, 1999; 5(4): 289-295
Published online Aug 15, 1999. doi: 10.3748/wjg.v5.i4.289
Published online Aug 15, 1999. doi: 10.3748/wjg.v5.i4.289
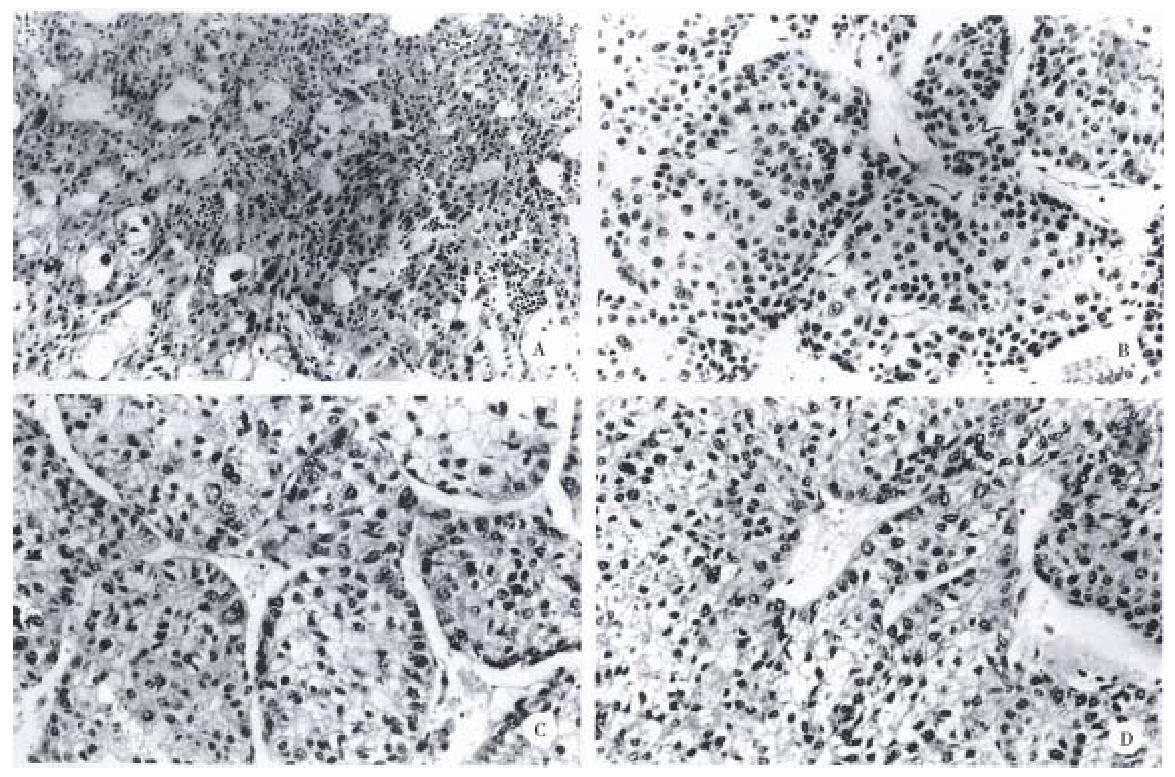
Figure 2 A, B, C, and D, show original tumor morphology of each cell line.
Scale bars, 50 μm.
- Citation: Lee JH, Ku JL, Park YJ, Lee KU, Kim WH, Park JG. Establishment and characterization of four human hepatocellular carcinoma cell lines containing hepatitis B virus DNA. World J Gastroenterol 1999; 5(4): 289-295
- URL: https://www.wjgnet.com/1007-9327/full/v5/i4/289.htm
- DOI: https://dx.doi.org/10.3748/wjg.v5.i4.289


