Copyright
©The Author(s) 1999.
World J Gastroenterol. Jun 15, 1999; 5(3): 245-248
Published online Jun 15, 1999. doi: 10.3748/wjg.v5.i3.245
Published online Jun 15, 1999. doi: 10.3748/wjg.v5.i3.245
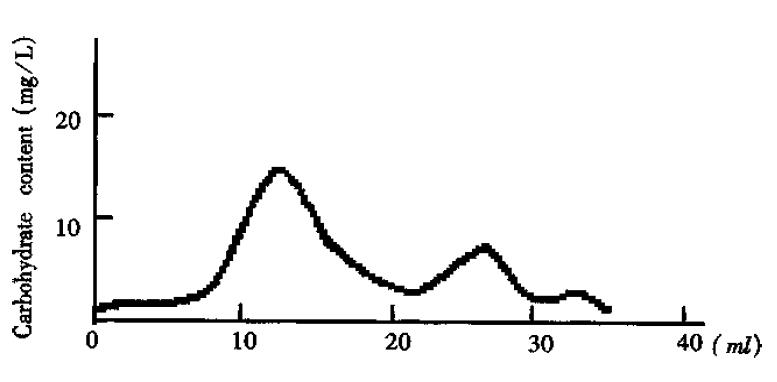
Figure 1 The curve of carbohydrate content quantified.
The crude O-PS was separated by Sephadex G50 with elution of ddH2O.
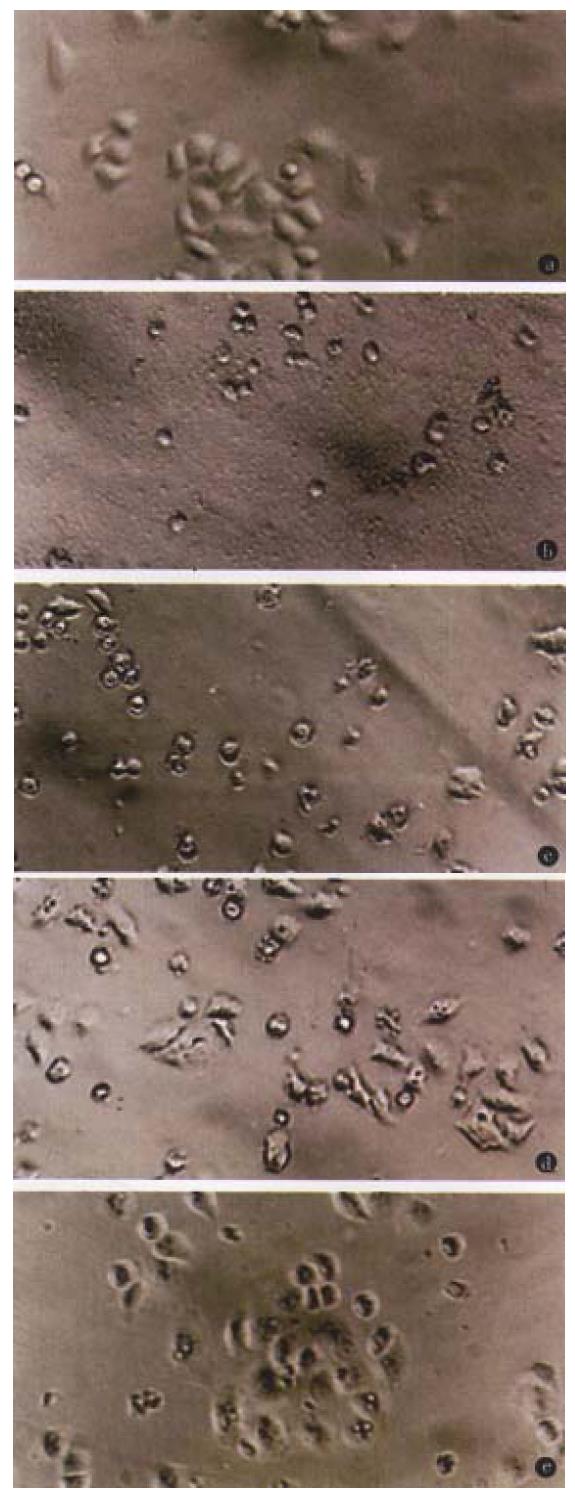
Figure 2 Effect of various doses of O-PS on HeLa cell.
Normal HeLa cells (A), and HeLa cells in the medium containing 1000 (B), 500 (C), 200 (D), 100 (E) μg/mL O-PS respectively. × 200
- Citation: Zhong QP. Pathogenic effects of Opolysaccharide from Shigella flexneri strain. World J Gastroenterol 1999; 5(3): 245-248
- URL: https://www.wjgnet.com/1007-9327/full/v5/i3/245.htm
- DOI: https://dx.doi.org/10.3748/wjg.v5.i3.245


