Copyright
©The Author(s) 1999.
World J Gastroenterol. Apr 15, 1999; 5(2): 125-127
Published online Apr 15, 1999. doi: 10.3748/wjg.v5.i2.125
Published online Apr 15, 1999. doi: 10.3748/wjg.v5.i2.125
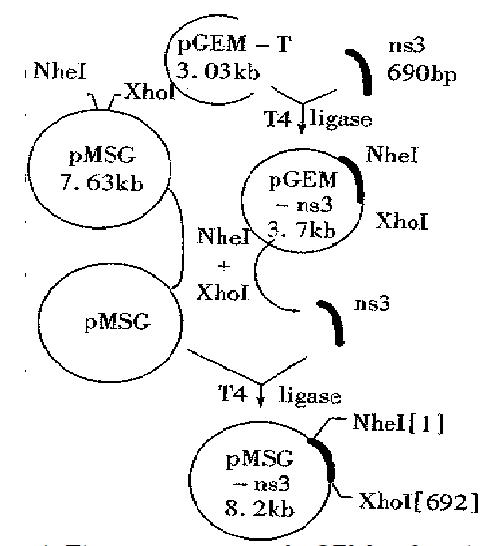
Figure 1 The construction of pGEM-ns3 and pMSG-ns3.
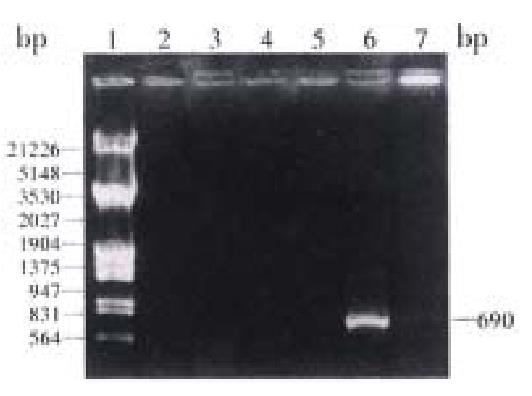
Figure 2 The PCR results of pBns3.
Lane 1: λ/EcoR I + Hind III marker; Lane 2, 3: negative controls; Lane 4, 5: PCR results from other primers; Lane 6: PCR products of ns3 gene annealing at 58 °C; Lane 7: PCR result from another annealing temperature.
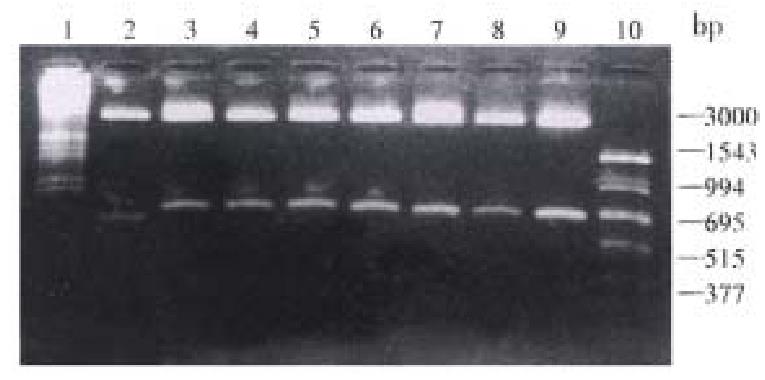
Figure 3 pGEM-ns3 digested with Nhe I and Xho I.
Lane 1: λ/EcoR I + Hind III marker; Lane 2-9: colone 8-1; Lane 10: PCR marker
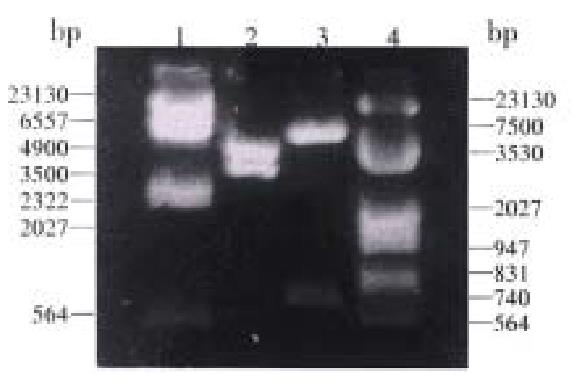
Figure 4 pMSG-ns3 (clone 1) digested with Sac I and Hind III.
Lane 1: λ/Hind I marker; Lane 2: Clone 1 digested with-Hind III; Lane 3: Clone 1 digested with Sac I; Lane 4: λ/EcoR I + Hind III marker.
Figure 5 The Western-blot of the NS3 protein transf ected cells induced by DM.
Lane 1: negative control (untransfected); Lane 2, 3: groups induced after by DM 24 h and 32 h (3 × 10⁻⁷ mol/L); Lane 4-6: groups induced by DM after 8 h, 24 h and 32 h (3 × 10⁻⁸ mol/L); Lane 7: uninduced group.
- Citation: Zhang SZ, Liang JJ, Qi ZT, Hu YP. Cloning of the non-structural gene 3 of hepatitis C virus and its inducible expression in cultured cells. World J Gastroenterol 1999; 5(2): 125-127
- URL: https://www.wjgnet.com/1007-9327/full/v5/i2/125.htm
- DOI: https://dx.doi.org/10.3748/wjg.v5.i2.125


