Copyright
©The Author(s) 1998.
World J Gastroenterol. Dec 15, 1998; 4(6): 536-539
Published online Dec 15, 1998. doi: 10.3748/wjg.v4.i6.536
Published online Dec 15, 1998. doi: 10.3748/wjg.v4.i6.536
Figure 1 Structure of recombinant plasmid PSHDX42 X: HBx gene; ↓: BamHI
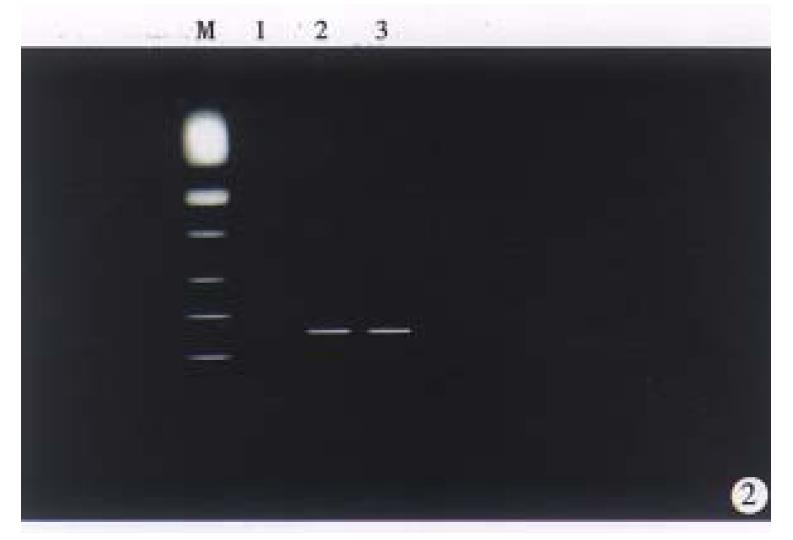
Figure 2 Electrophoresis analysis of Nested PCR products amplified from DNA obtained from tail tissue.
lane 1, normal mouse (negative control; lane 2 and 3 (transgenic mice) showed positive bands (280 bp). M, PCR marker (SABC).
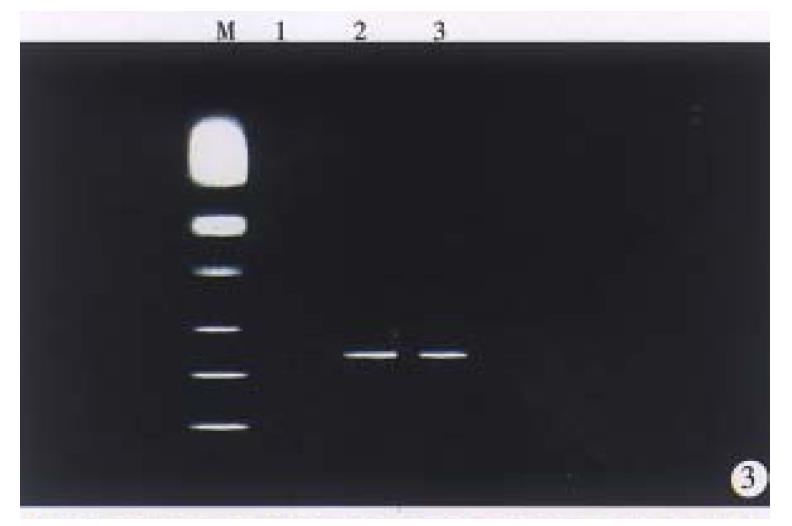
Figure 3 Electrophoresis analysis of RT-PCR products.
Lane 1, normal mouse liver tissue (negative control); lane 2 and 3 transgenic mice liver tissue showed positive bands (439 bp). M, PCR standard marker (SABC).
Figure 4 Two-month old transgenic mouse liver showed glycogen positive foci.
PAS × 200
- Citation: Zhu HZ, Cheng GX, Chen JQ, Kuang SY, Cheng Y, Zhang XL, Li HD, Xu SF, Shi JQ, Qian GS, Gu JR. Preliminary study on the production of transgenic mice harboring hepatitis B virus X gene. World J Gastroenterol 1998; 4(6): 536-539
- URL: https://www.wjgnet.com/1007-9327/full/v4/i6/536.htm
- DOI: https://dx.doi.org/10.3748/wjg.v4.i6.536


