Copyright
©The Author(s) 1998.
World J Gastroenterol. Aug 15, 1998; 4(4): 343-347
Published online Aug 15, 1998. doi: 10.3748/wjg.v4.i4.343
Published online Aug 15, 1998. doi: 10.3748/wjg.v4.i4.343
Figure 1 SHHE confirmed by surgery.
A. Arterial phase CT scan demonstrated the peripheral nodular enhancement of the lesion in the left lobe (arrow). B. Portal venous phase CT scan demonstrated the lesion was opacified fully, its dense was higher than normal liver parenchyma (arrow).
Figure 2 SHCC confirmed by surgery.
A.Arterial phase CT scan demonstrates the lesion enhanced homogenously and became hyperdense (arrow). B. Portal venous phase scan demonstrated the lesion was hypodense homogenously (arrow).
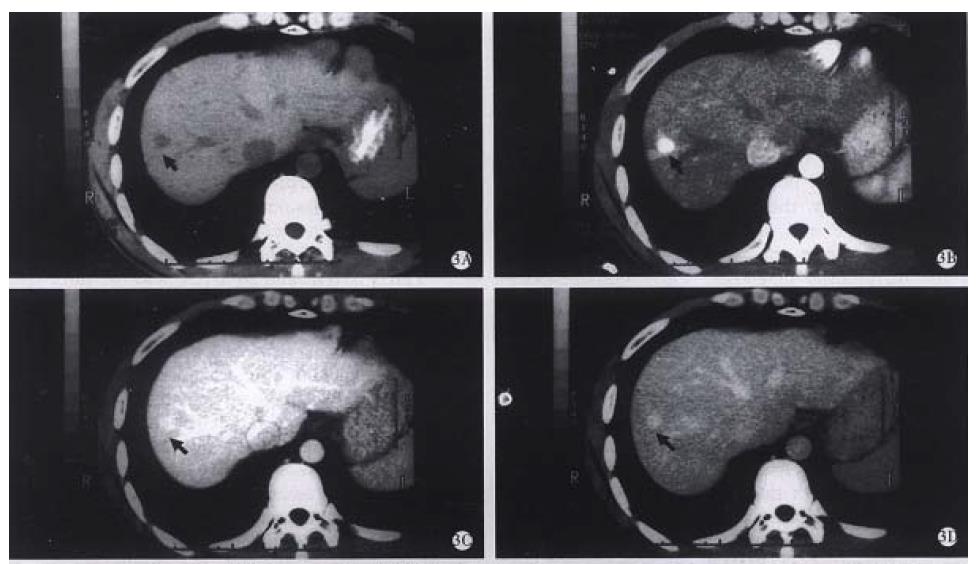
Figure 3 SHHE confirmed by surgery.
A. Plain scan demonstrated a hypoattenuating lesion in the right lobe, the edge was unclear (arrow). B. Arterial phase CT scan demonstrates the lesion enhanced homogenously and hecame hyperdense (arrow). C. Portal venous phase CT scan demonstrated the lesion remained hyperdense (arrow). D. Delay phase scan demonstrated the same finding as portal venous phase scan (arrow).
Figure 4 SHCC confirmed by surgery.
A. Plain scan demonstrated a small hypoattenuating lesion in the right lobe, the edge was clear (arrow). B. Arterial phase CT scan demonstrates the lesion enhanced homogenously and became hyperdense (arrow). C. Portal venous phase CT scan demonstrated the lesion was isodense and could not be found (arrow). D. Delay phase scan demonstrated the lesion was hypodense with clear boundary (arrow).
- Citation: Yan FH, Zeng MS, Zhou KR. Role and pitfalls of hepatic helical multi-phase CT scanning in differential diagnosis of small hemangioma and small hepatocellular carcinoma. World J Gastroenterol 1998; 4(4): 343-347
- URL: https://www.wjgnet.com/1007-9327/full/v4/i4/343.htm
- DOI: https://dx.doi.org/10.3748/wjg.v4.i4.343


