
















Copyright: ©Author(s) 2026.
World J Gastroenterol. Jan 21, 2027; 33(3): 123339
Published online Jan 21, 2027. doi: 10.3748/wjg.123339
Published online Jan 21, 2027. doi: 10.3748/wjg.123339
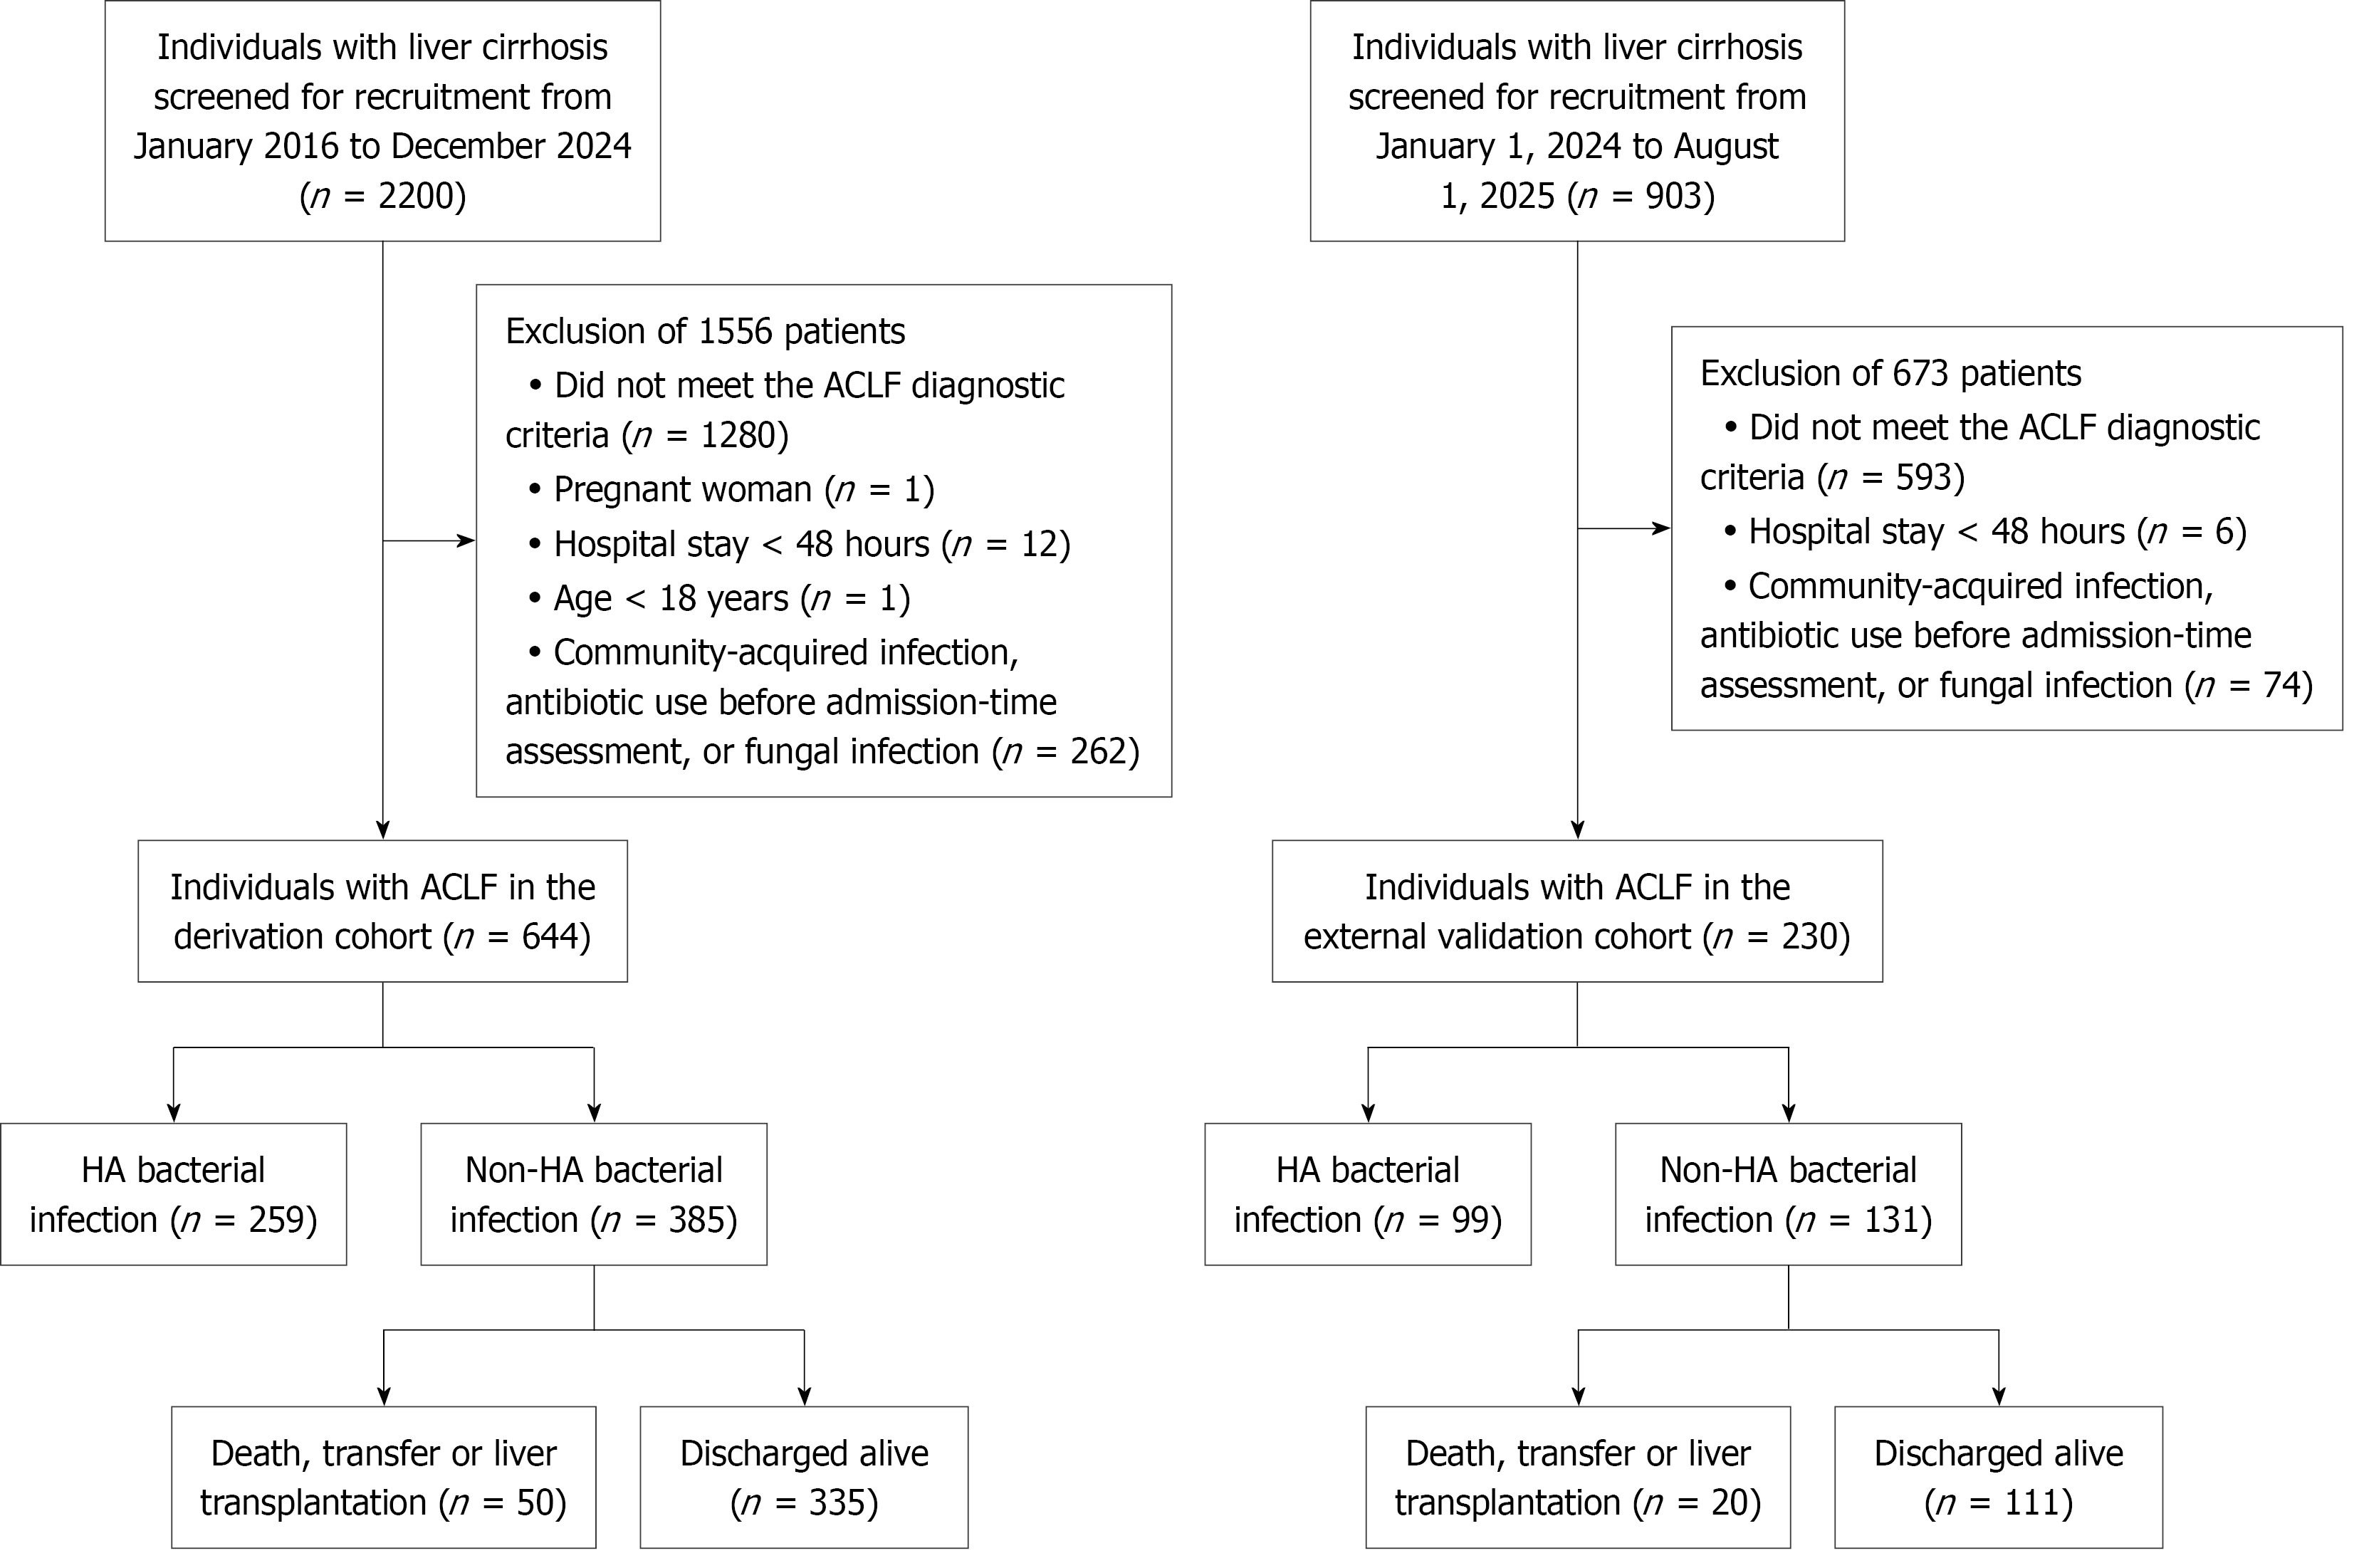
Figure 1 Flowchart for population in study.
ACLF: Acute-on-chronic liver failure; HA: Hospital-acquired.
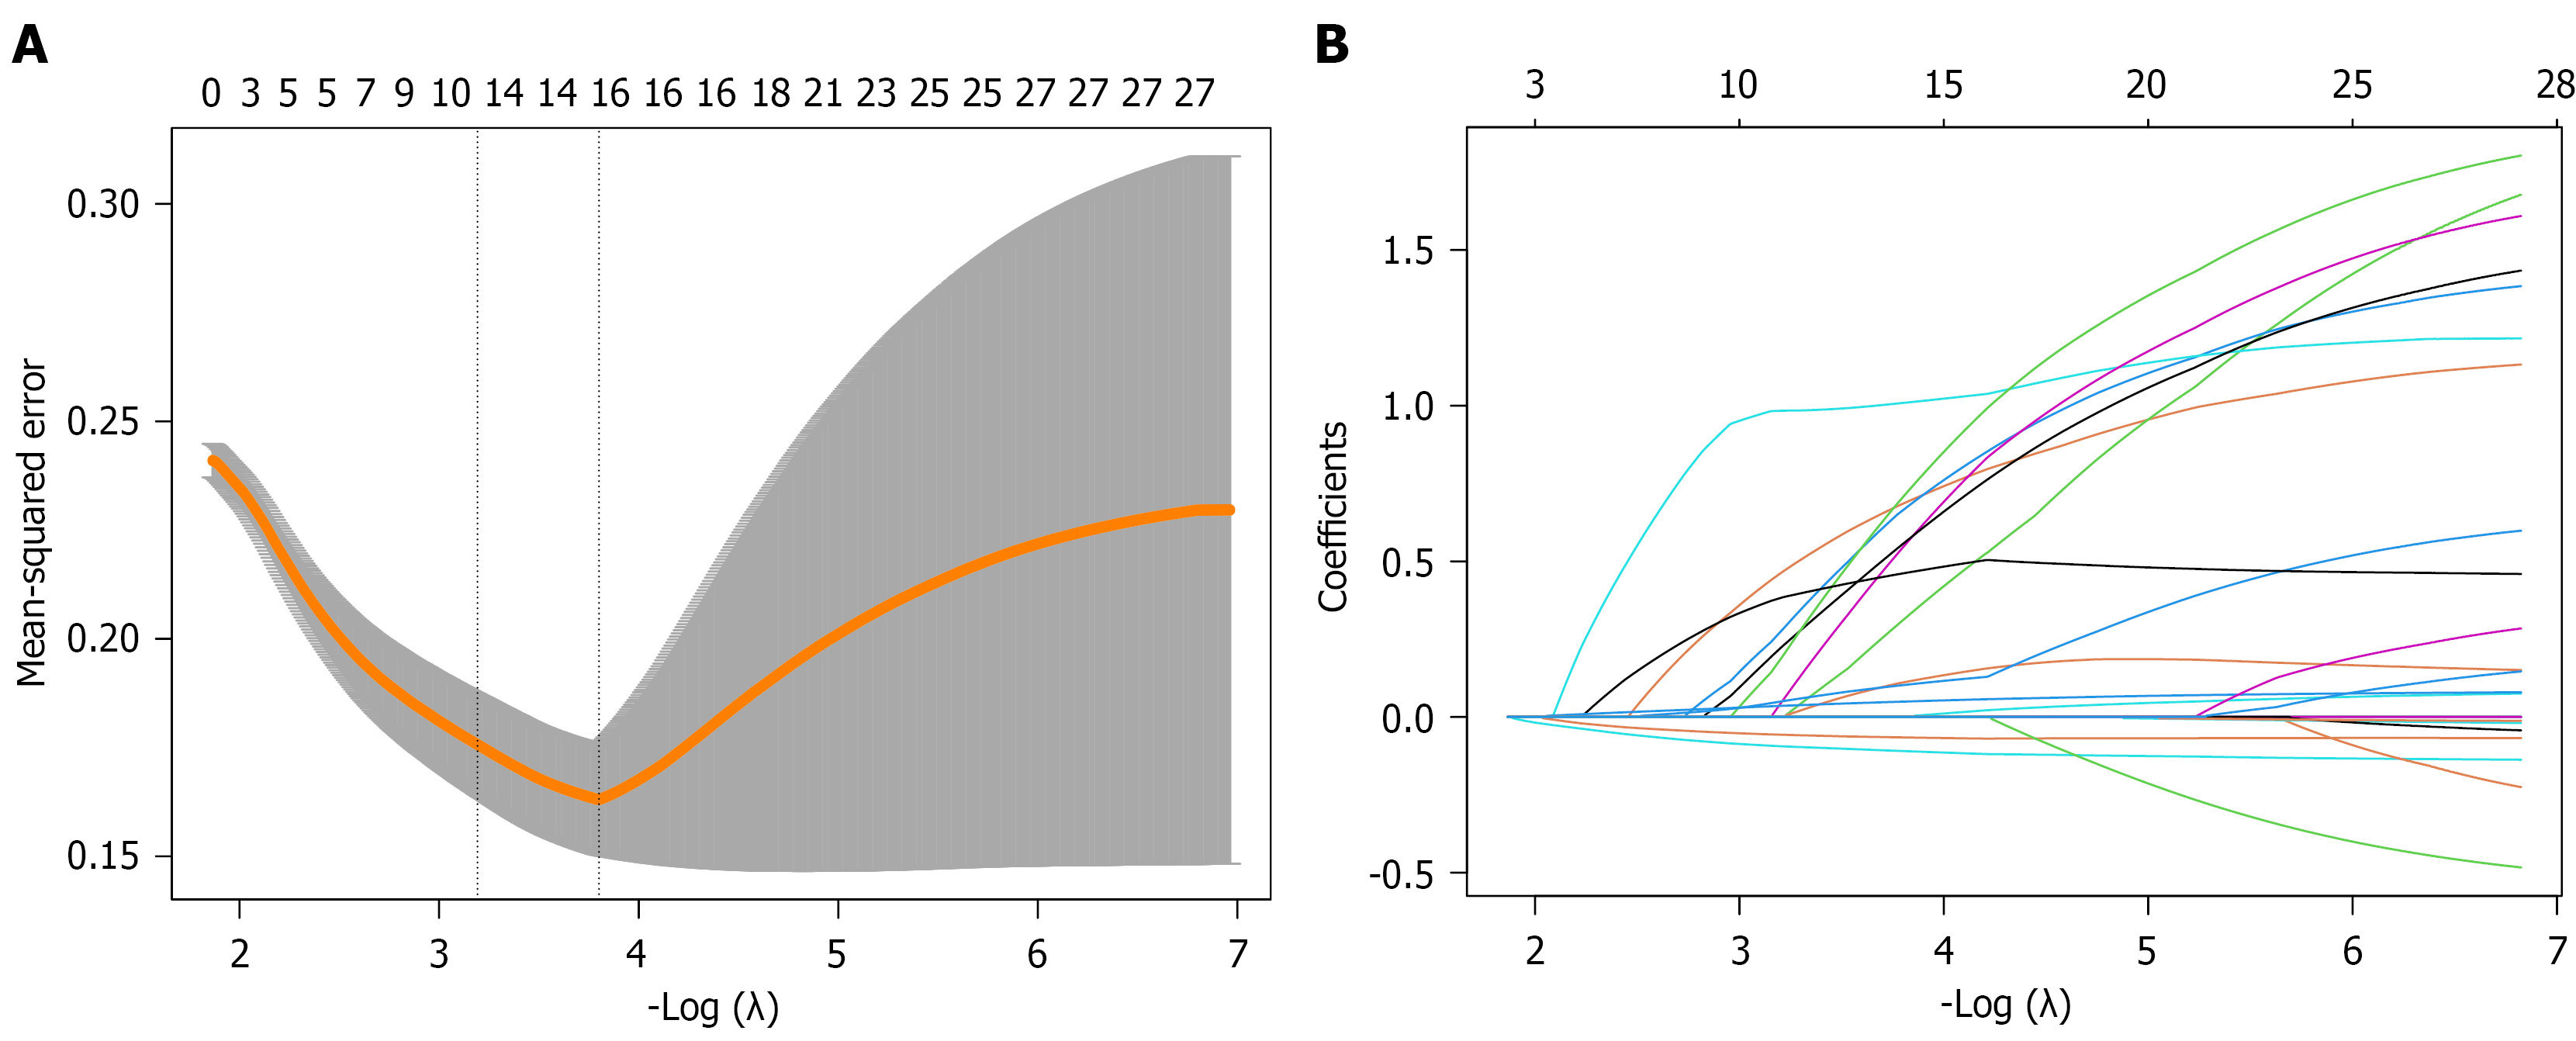
Figure 2 Variable selection through least absolute shrinkage and selection operator regression analysis in acute-on-chronic liver failure patients.
A: The optimal penalty parameter (λ) in our least absolute shrinkage and selection operator (LASSO) regression was selected via 10-fold cross-validation under the minimum criterion, which resulted in the retention of 16 clinical features with non-zero coefficients; B: Profile plot of LASSO regression coefficients.
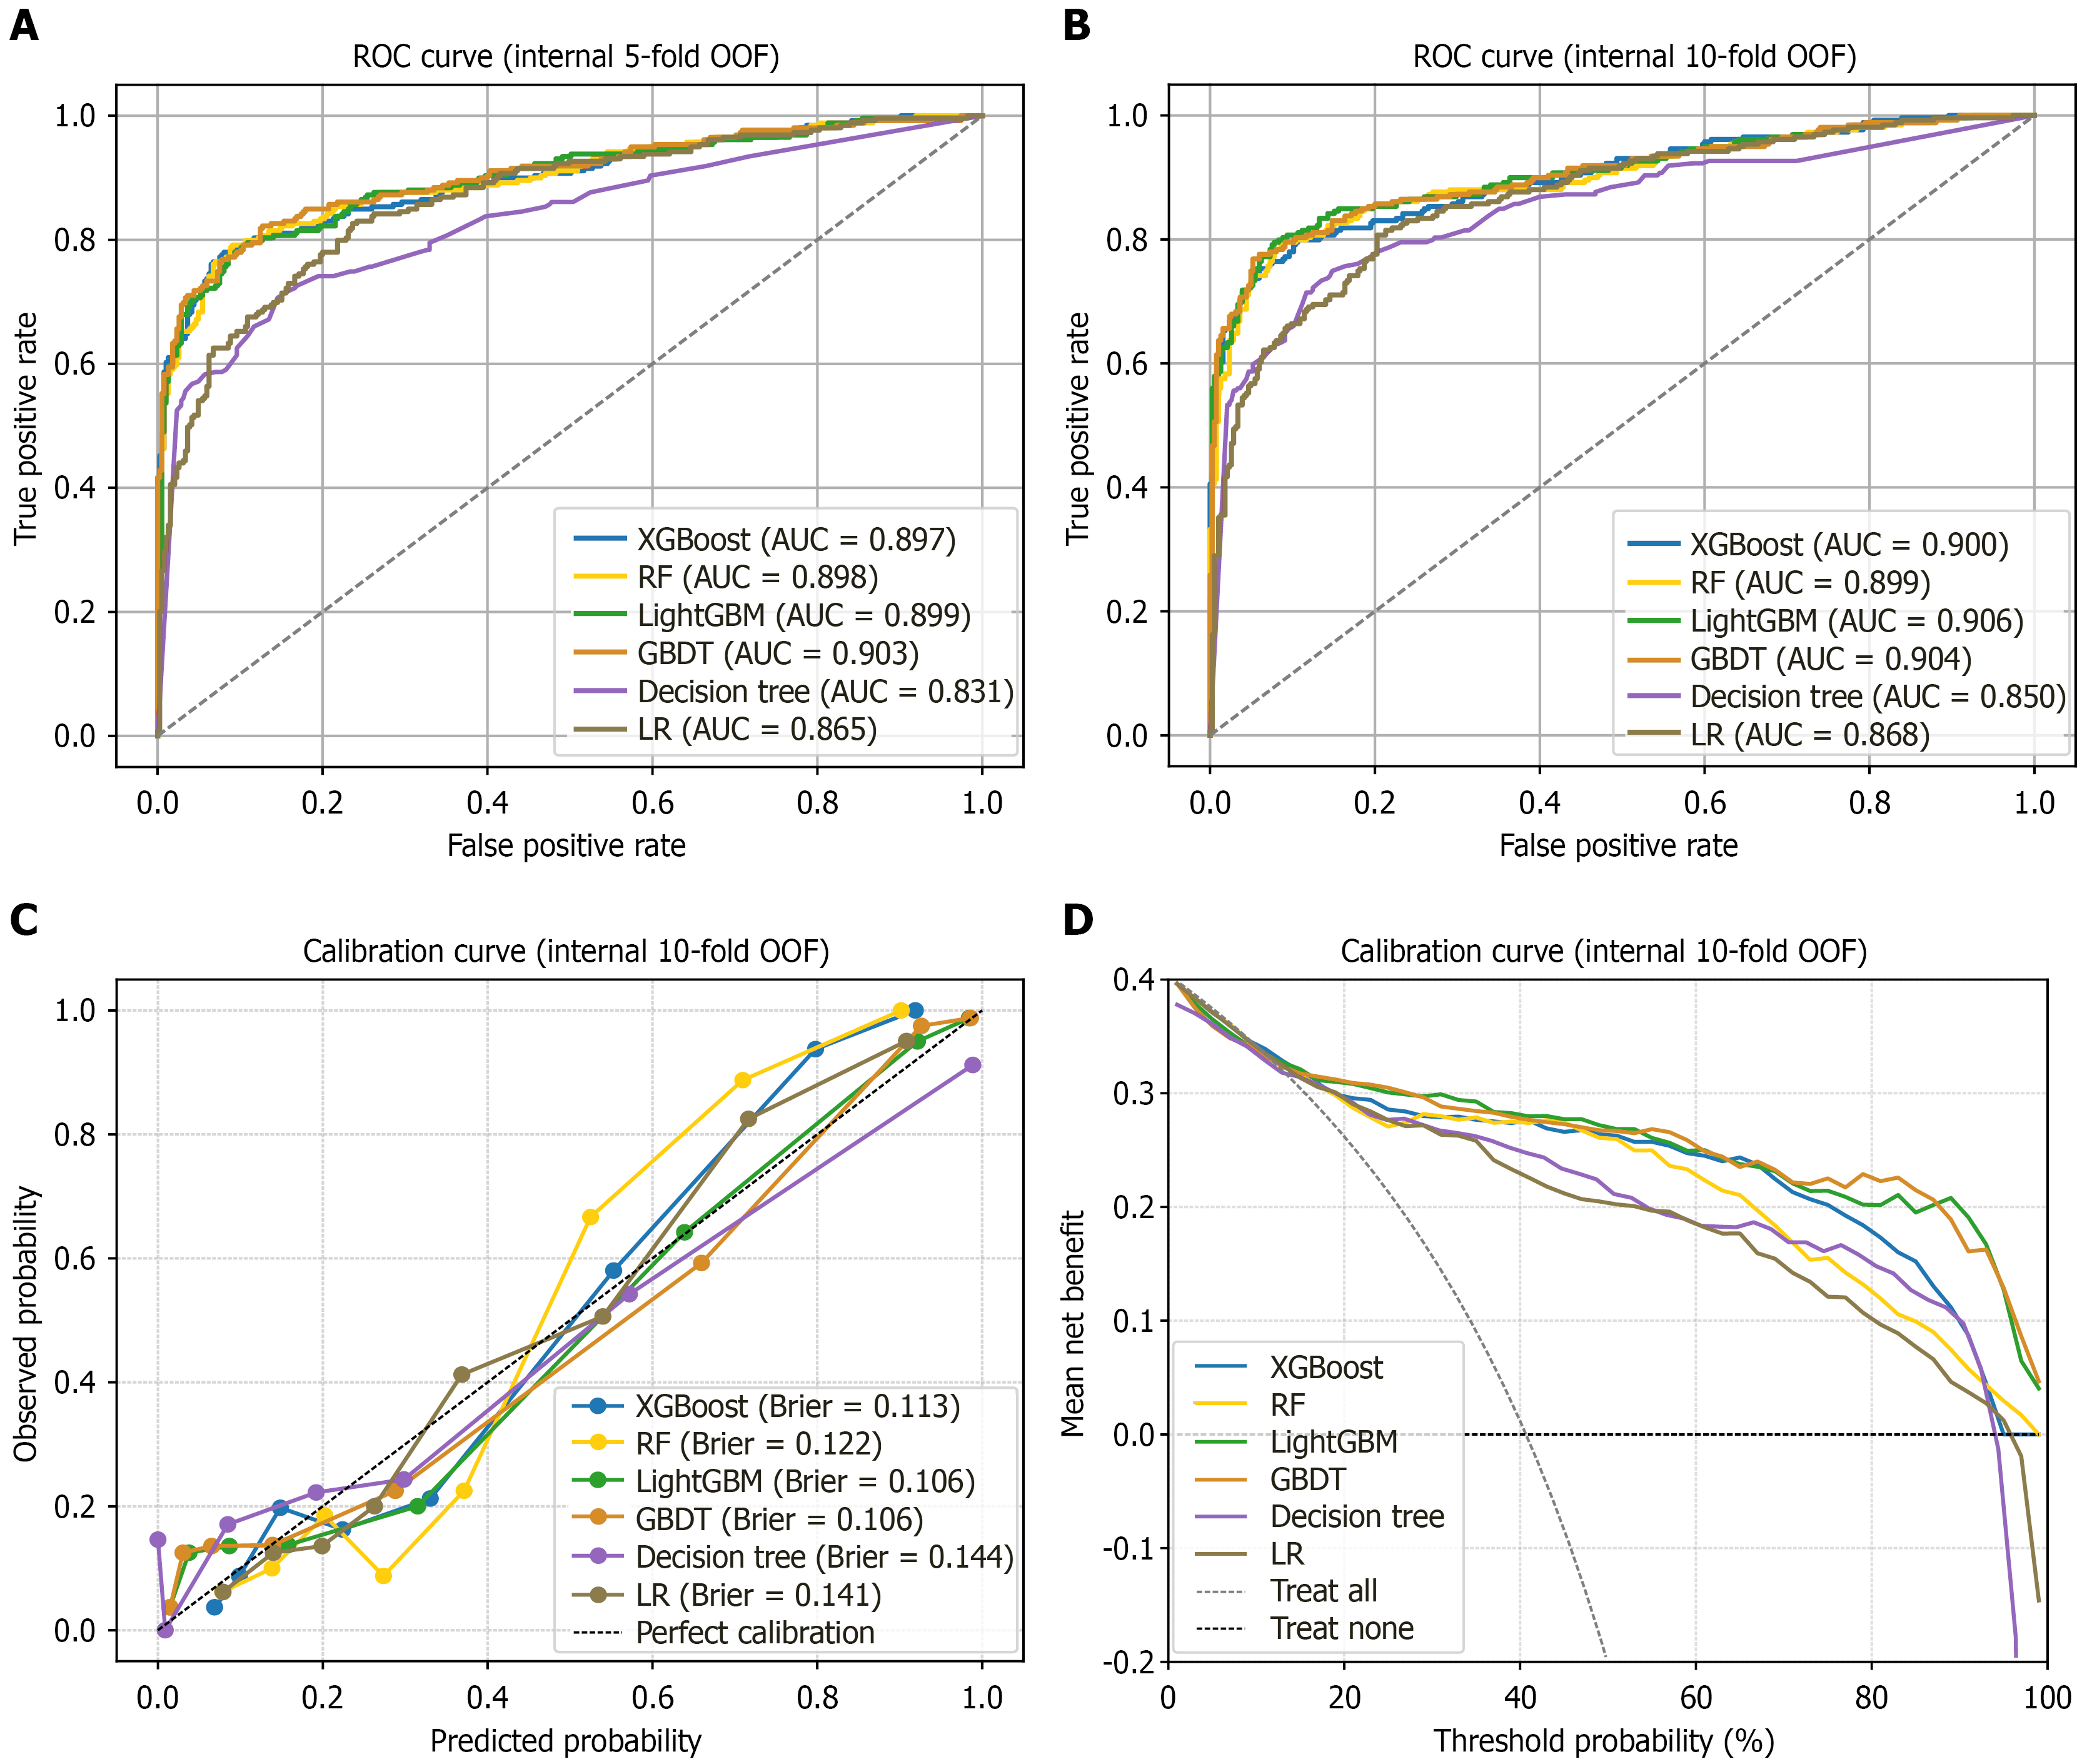
Figure 3 Machine learning model comprehensive analysis.
A: Receiver operating characteristic (ROC) curves from the initial 5-fold out-of-fold (OOF) cross-validation used for hyperparameter tuning; B: ROC curves based on 10-fold OOF predictions; C: Calibration curves based on 10-fold OOF predictions, showing the relationship between predicted probabilities (X-axis) and observed outcomes (Y-axis). The dashed line represents ideal calibration, whereas solid lines indicate model performance; D: Decision curve analysis based on 10-fold OOF predictions. The gray dashed line indicates a “treat-all” strategy, and the black dashed line indicates a “treat-none” strategy. Solid lines represent the net benefit of the prediction models across different threshold probabilities. XGBoost: Extreme Gradient Boosting; RF: Random Forest; LightGBM: Light Gradient Boosting Machine; GBDT: Gradient Boosting Decision Tree; LR: Logistic Regression; OOF: Out-of-fold; ROC: Receiver operating characteristic; AUC: Area under the curve.
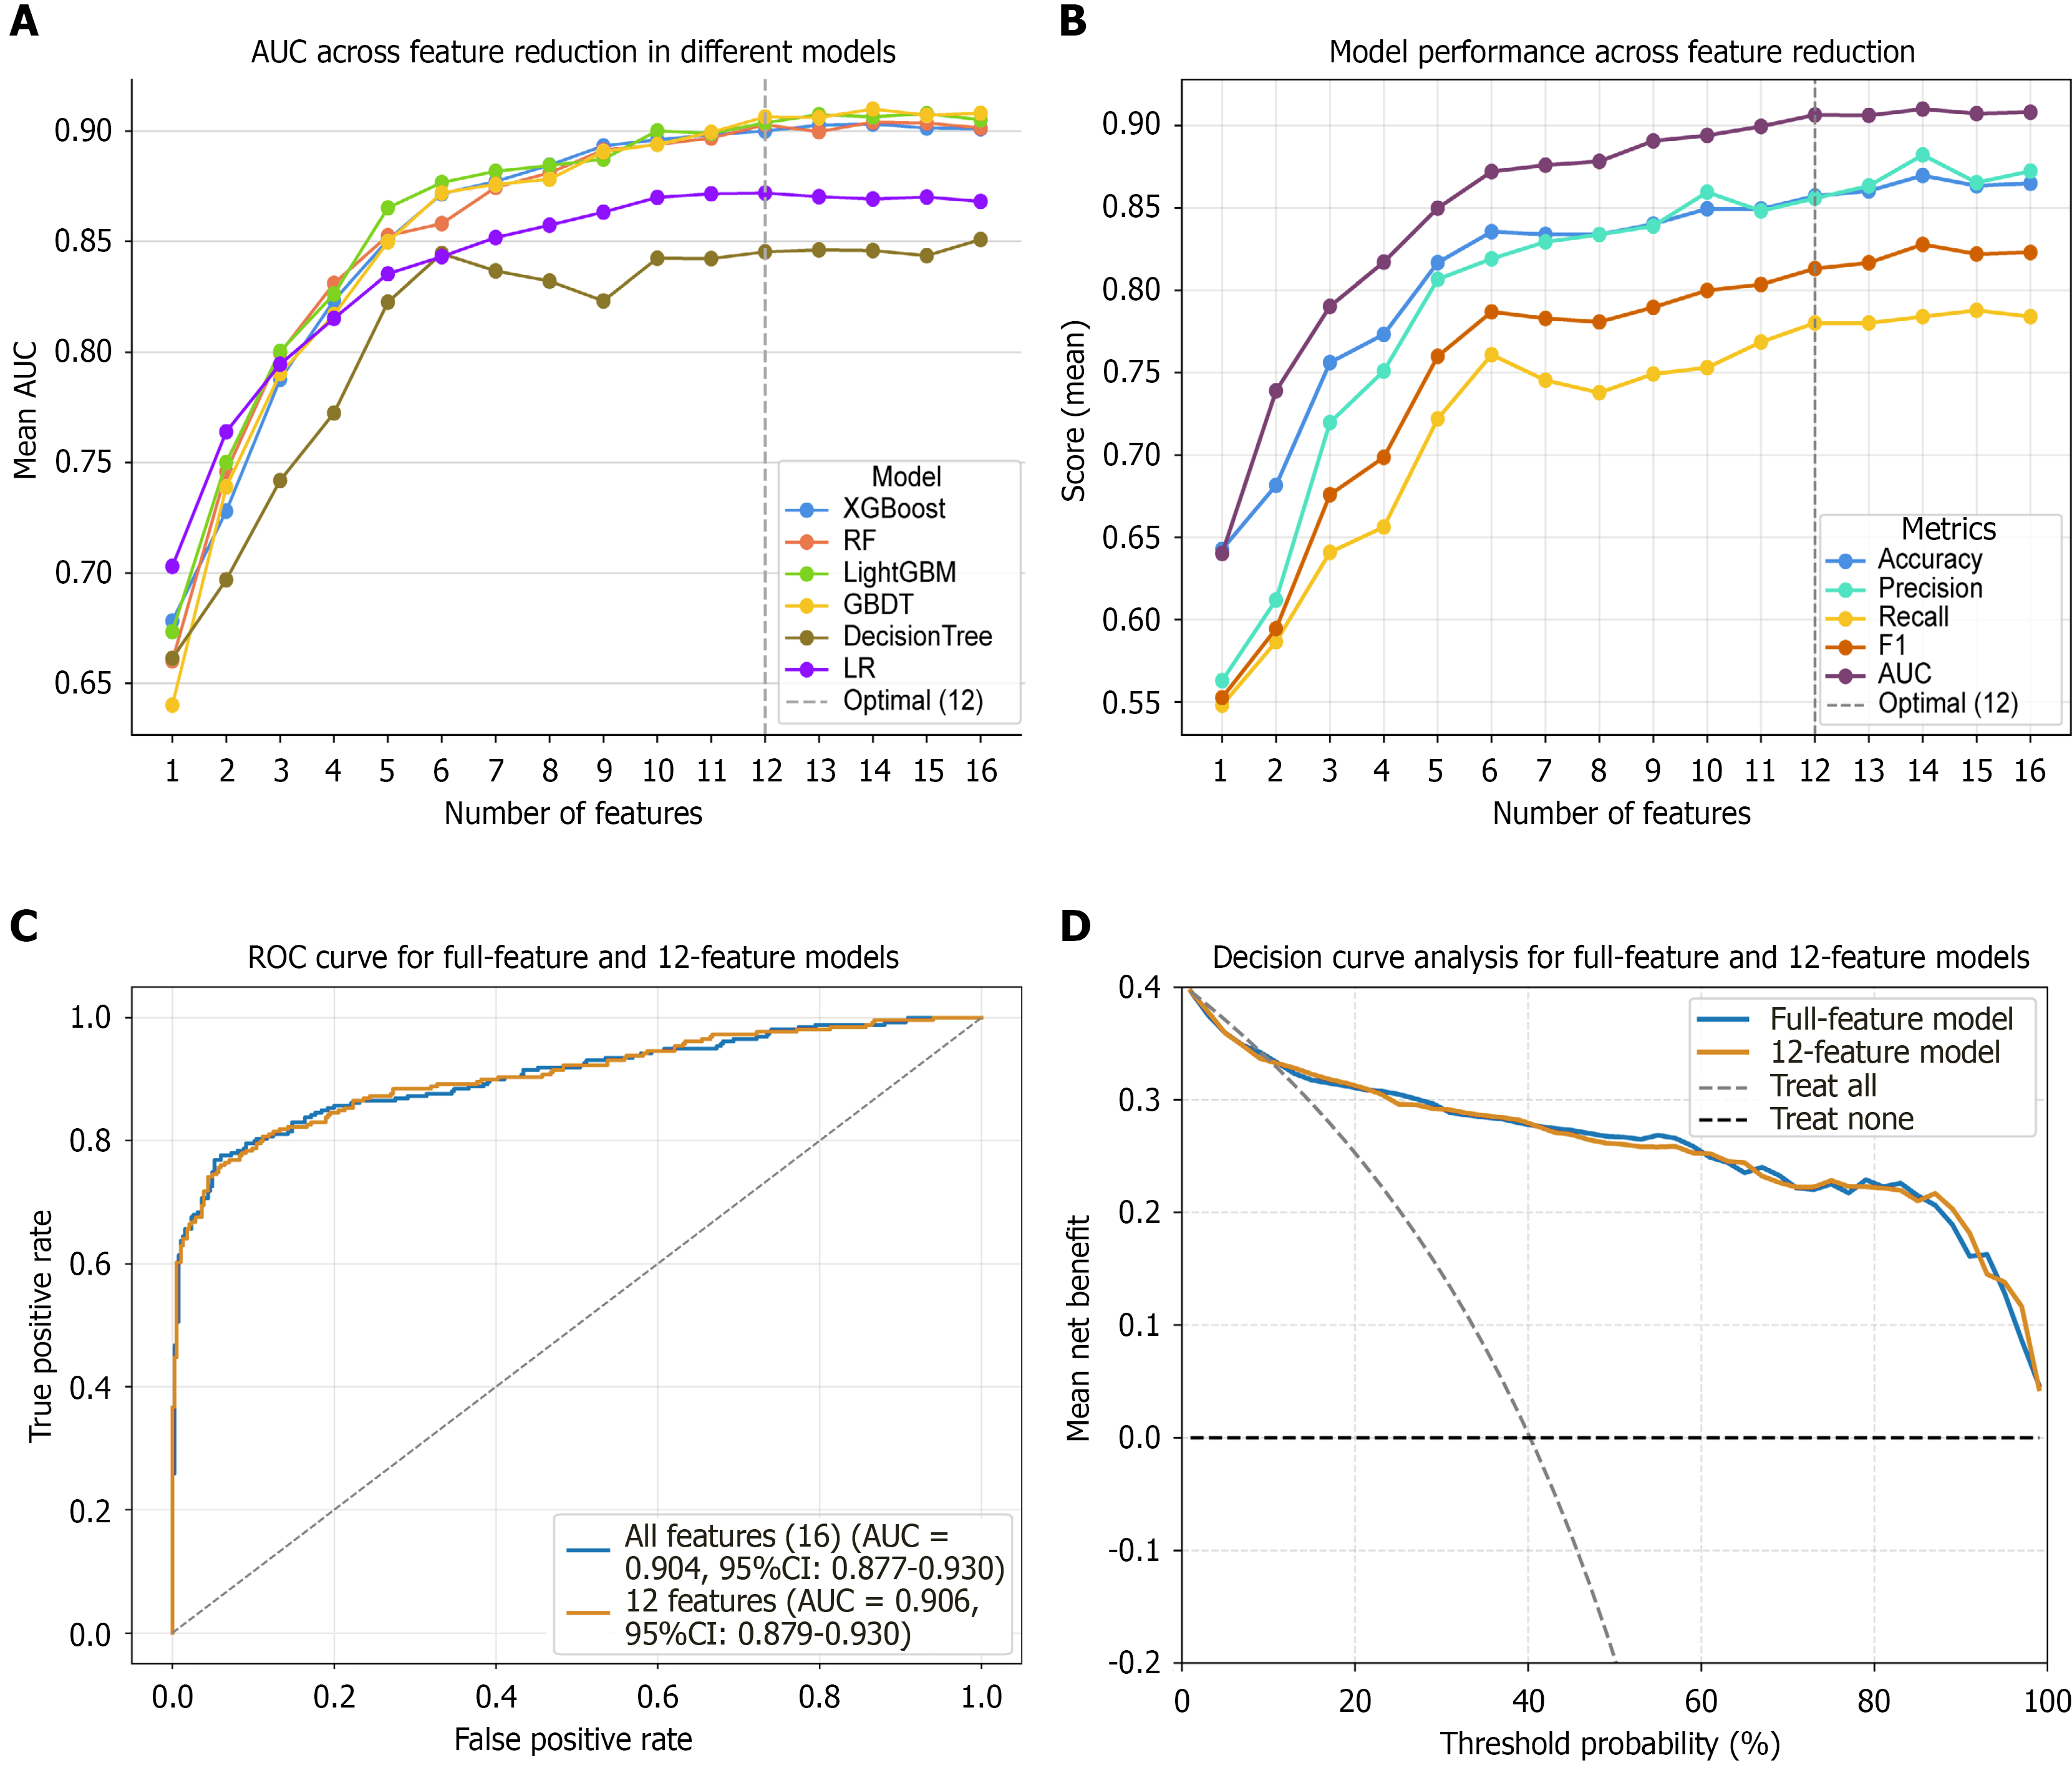
Figure 4 Feature selection of the Gradient Boosting Decision Tree model.
A: The area under the receiver curve for models with different numbers of features selected by sequential elimination of the least important features according to SHapley Additive exPlanations (SHAP) values. The gray dashed line indicates the optimal number of features chosen for the final model; B: Performance trends of the Gradient Boosting Decision Tree (GBDT) model during sequential SHAP-based feature elimination, based on out-of-fold (OOF) predictions; C: Comparison of receiver operating characteristic curves based on OOF predictions for the GBDT model using 16 features vs the reduced 12-feature set in the internal validation process during sequential feature elimination; D: Decision curve analysis comparing the 16-feature and 12-feature GBDT models. XGBoost: Extreme Gradient Boosting; RF: Random Forest; LightGBM: Light Gradient Boosting Machine; GBDT: Gradient Boosting Decision Tree; LR: Logistic Regression; AUC: Area under the curve; CI: Confidence interval.
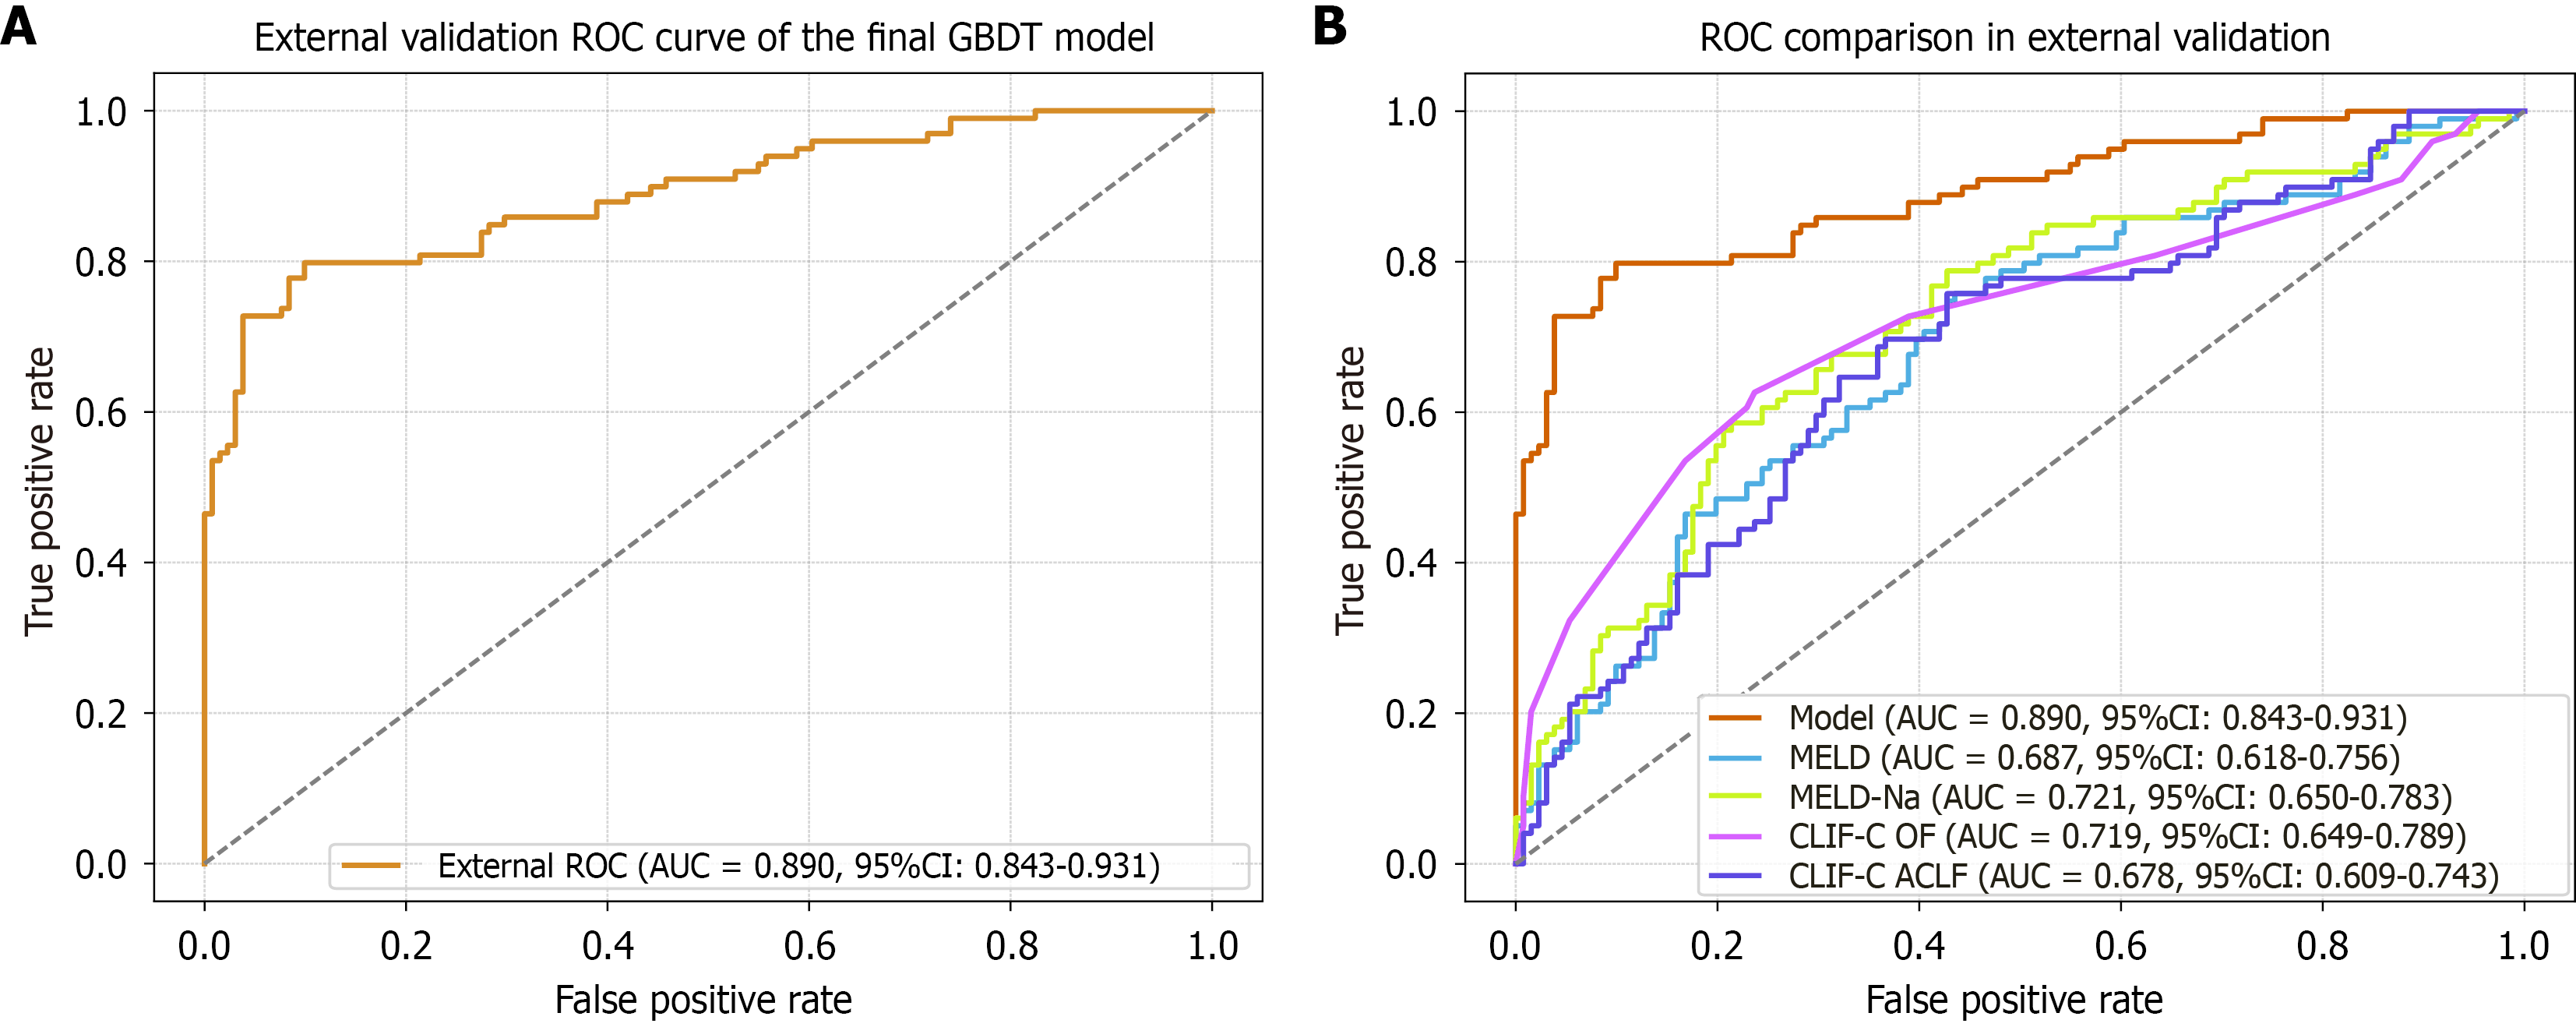
Figure 5 External validation of the final 12-feature Gradient Boosting Decision Tree model.
A: Receiver operating characteristic (ROC) curve of the final 12-feature Gradient Boosting Decision Tree (GBDT) model in the external validation cohort; B: Comparison of ROC curves between the final 12-feature GBDT model and conventional liver disease severity scores, including Model for End-Stage Liver Disease (MELD), MELD-Na, Chronic Liver Failure Consortium Organ Failure, and Chronic Liver Failure Consortium Acute-on-Chronic Liver Failure, in the external validation cohort. GBDT: Gradient Boosting Decision Tree; MELD: Model for End-Stage Liver Disease; CLIF-C OF: Chronic Liver Failure Consortium Organ Failure; CLIF-C ACLF: Chronic Liver Failure Consortium Acute-on-Chronic Liver Failure; AUC: Area under the curve; CI: Confidence interval; ROC: Receiver operating characteristic.
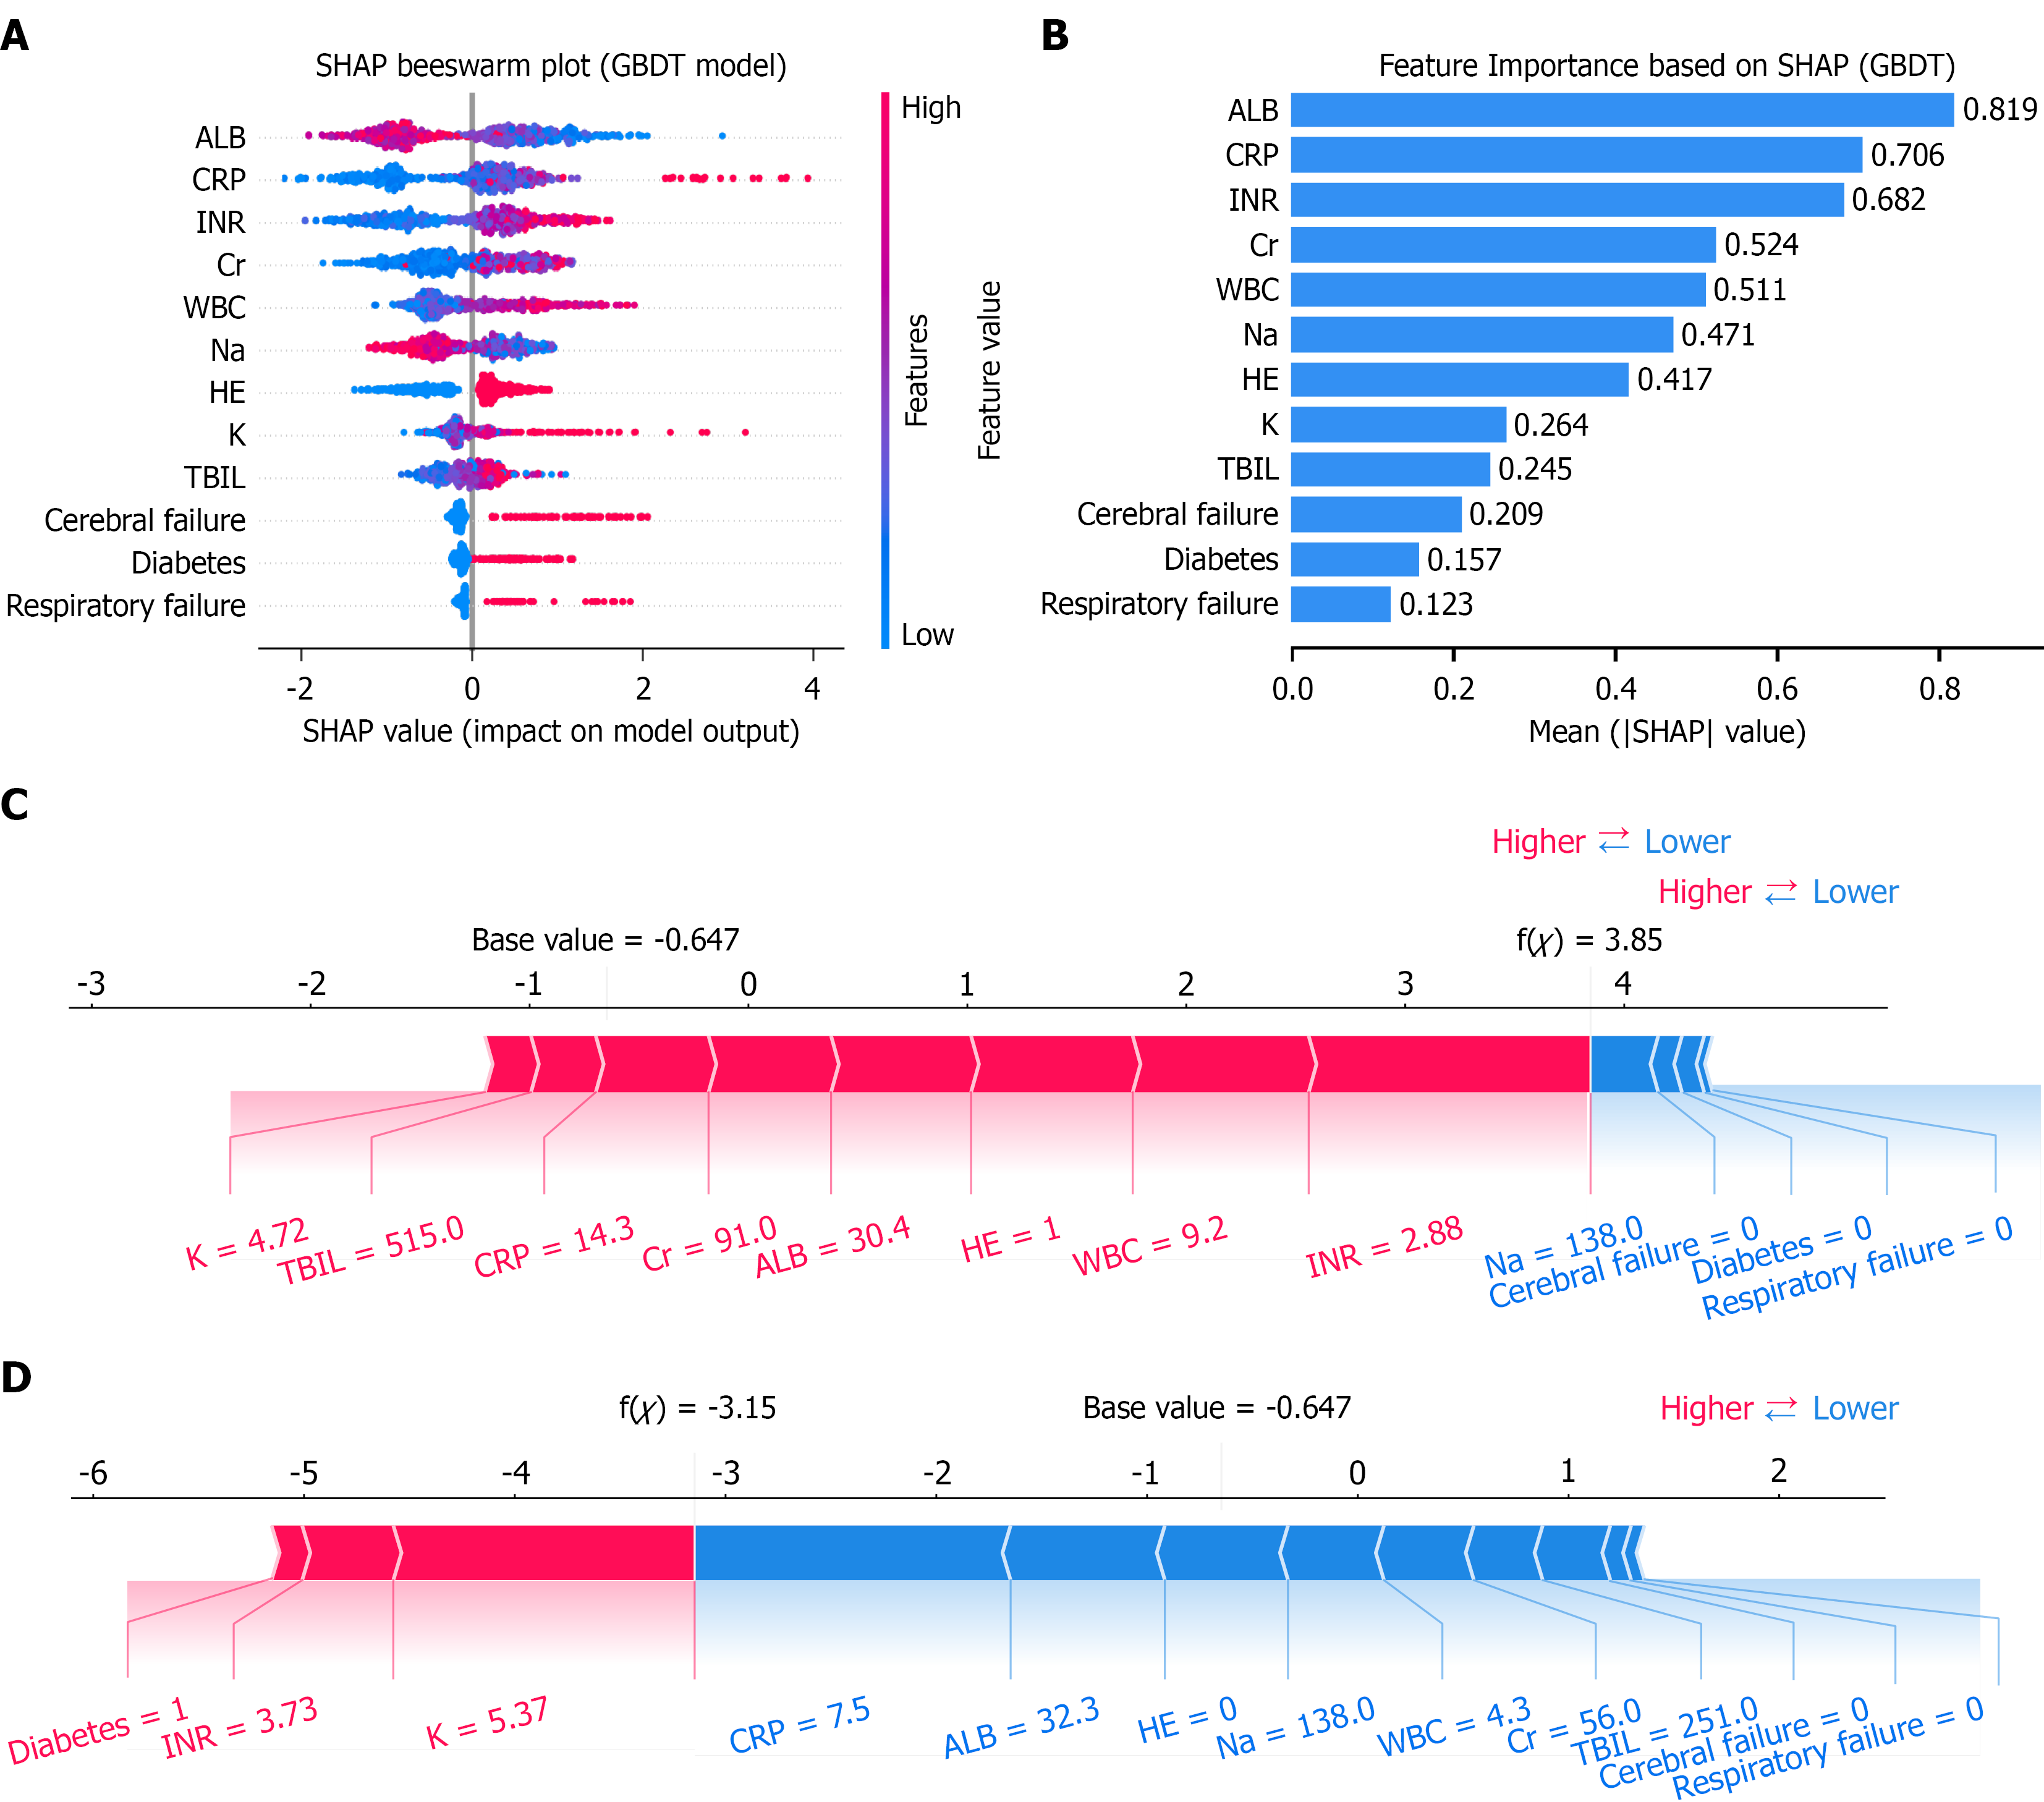
Figure 6 SHapley Additive exPlanations analysis of the final 12-feature Gradient Boosting Decision Tree model.
A: SHapley Additive exPlanations (SHAP) summary plot showing the distribution of SHAP values for each feature. Each dot represents one patient; red indicates a higher feature value and blue indicates a lower feature value; B: SHAP bar plot ranking feature importance in the final model; C: Local SHAP explanation for a representative patient with hospital-acquired (HA) bacterial infection; D: Local SHAP explanation for a representative patient without HA bacterial infection. In panels C and D, the SHAP value indicates the contribution of each feature to the model prediction for an individual patient. The base value represents the average model output, and f(x) represents the final log-odds prediction for the individual patient. Arrow length reflects the magnitude of each feature’s contribution. ALB: Albumin; CRP: C-reactive protein; INR: International normalized ratio; Cr: Creatinine; WBC: White blood cell count; Na: Sodium; K: Potassium; HE: Hepatic encephalopathy; TBIL: Total bilirubin; GBDT: Gradient Boosting Decision Tree; SHAP: SHapley Additive exPlanations.
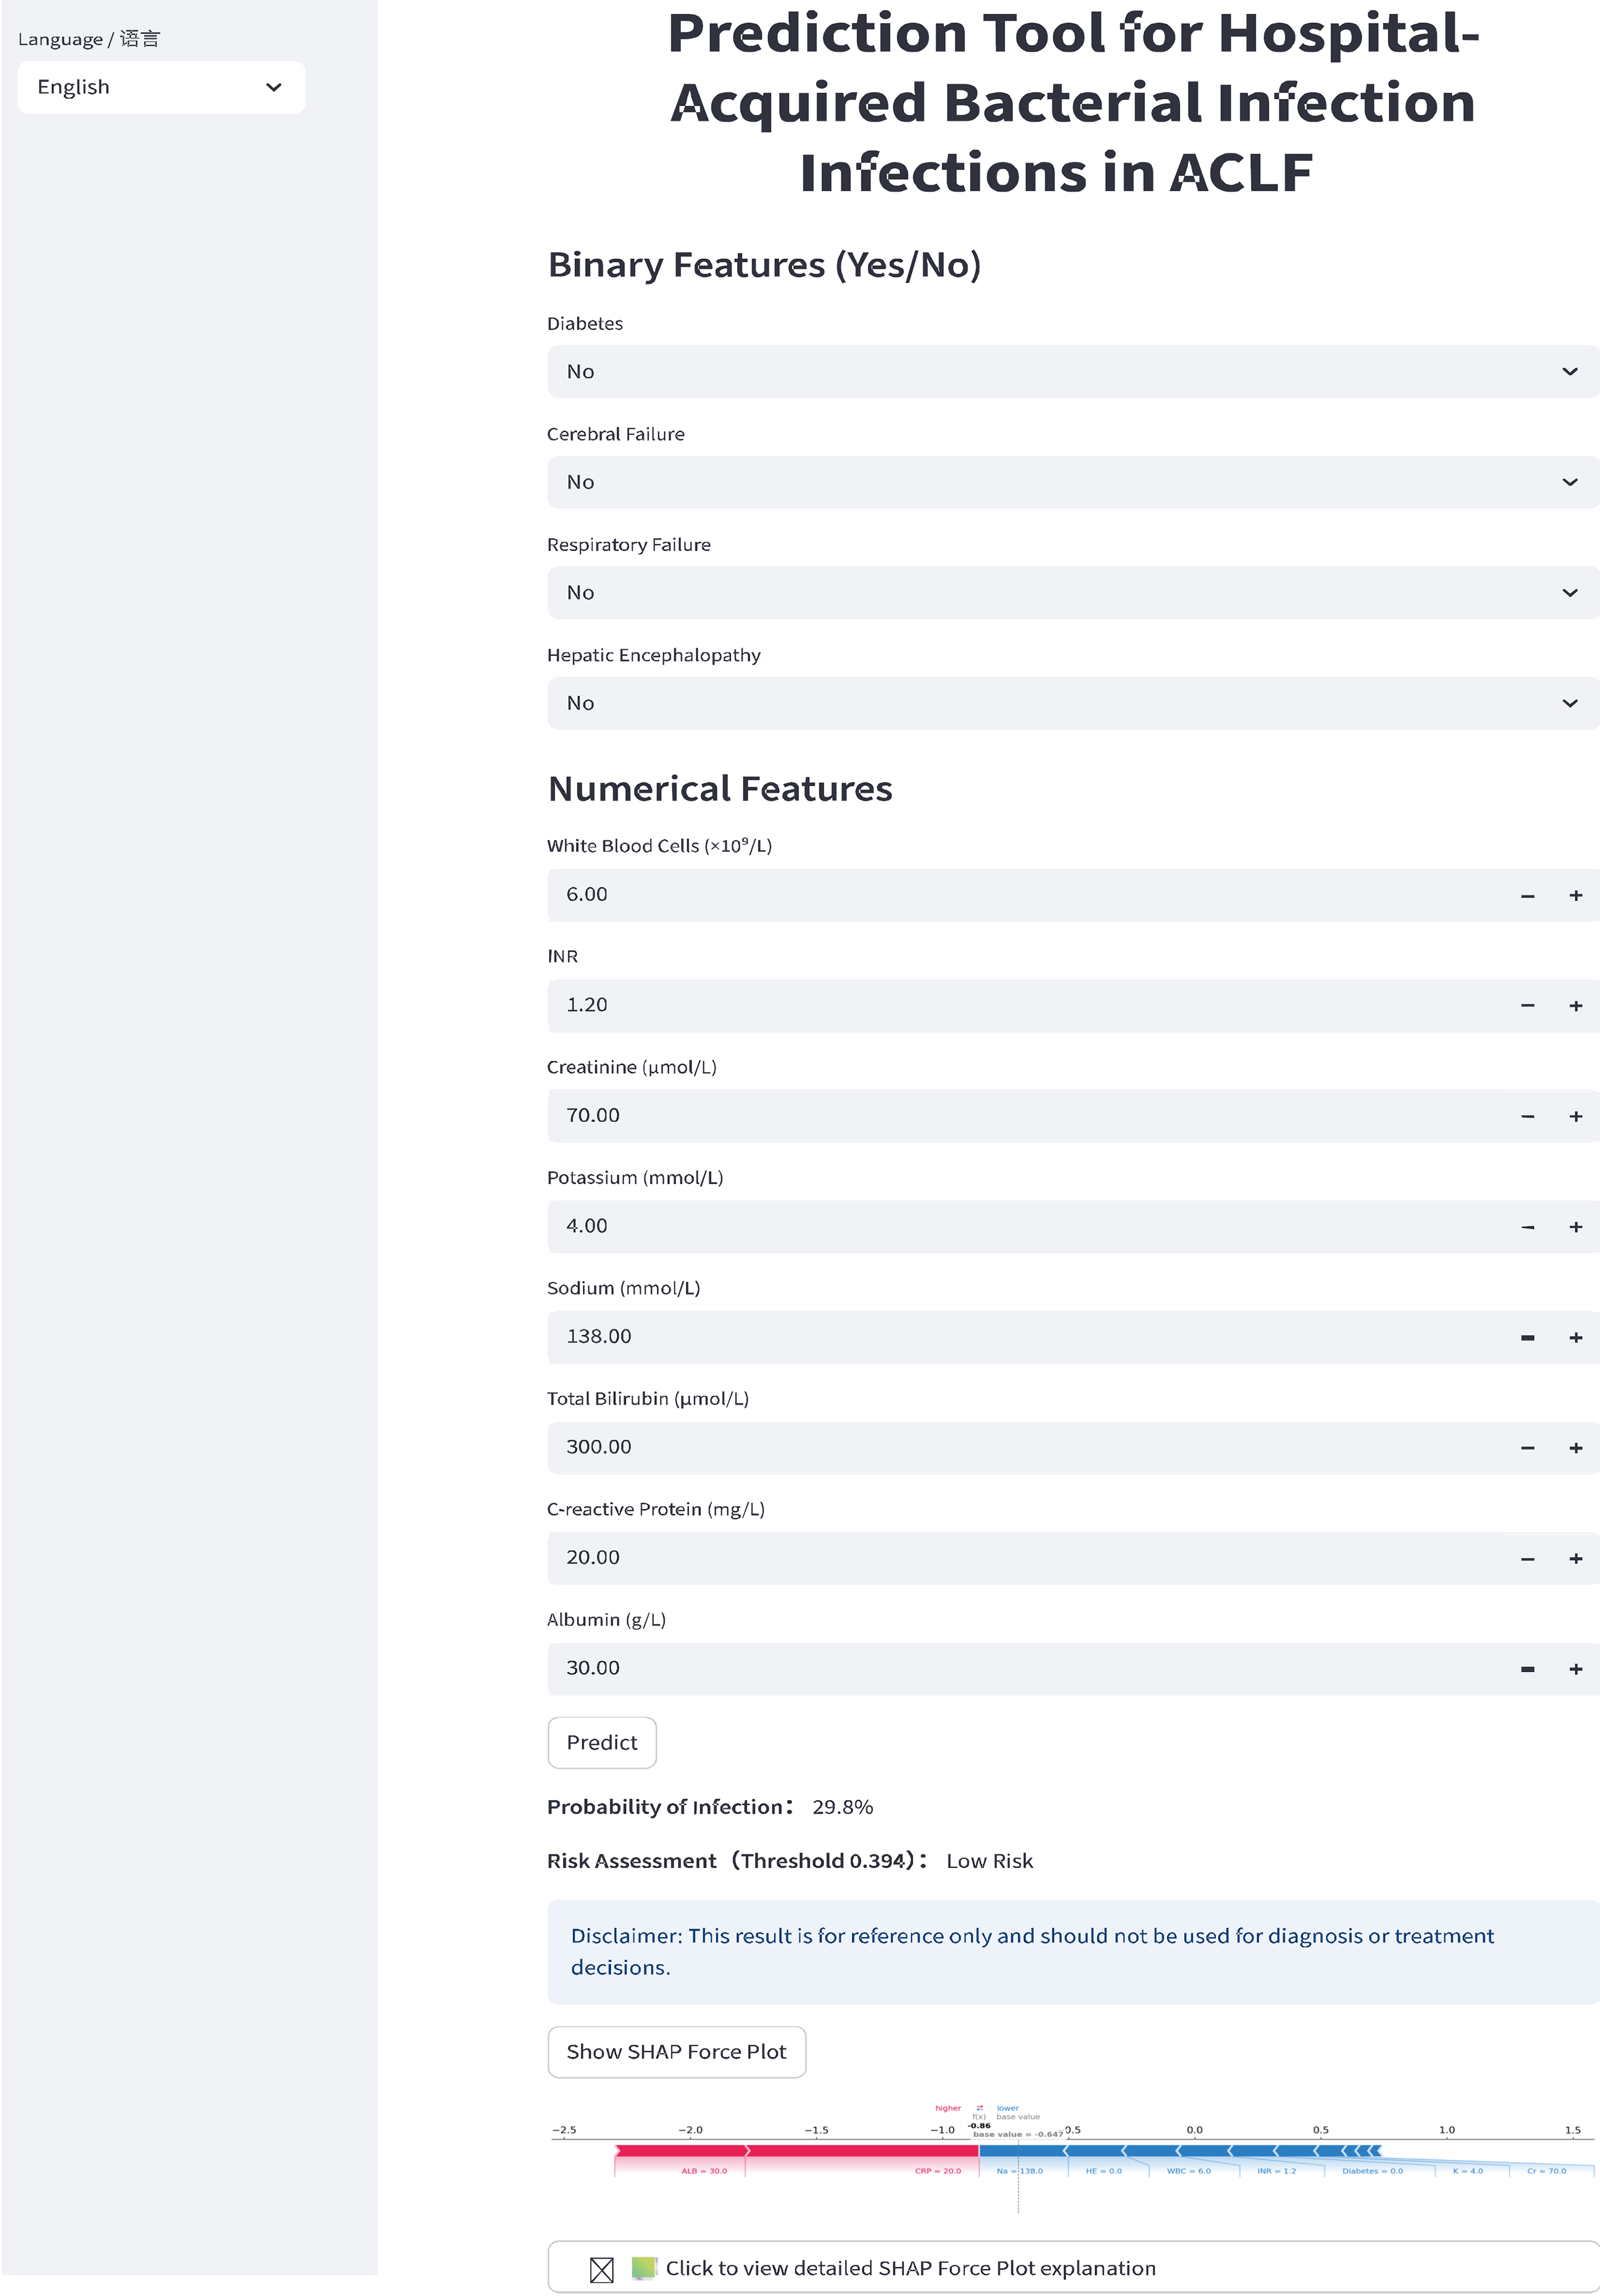
Figure 7 Web interface.
A user-friendly web-based application implementing the 12-feature Gradient Boosting Decision Tree model is available for predicting the risk of hospital-acquired bacterial infections in patients with acute-on-chronic liver failure. By entering the values of the 12 features, the tool automatically outputs the predicted probability of infection and simultaneously generates an individualized force plot to visualize the contribution of each feature. ACLF: Acute-on-chronic liver failure; SHAP: SHapley Additive exPlanations.
- Citation: Chen JY, Chen XY, Xie YW, Chen YW, Shi XW, Lin N, Huang CJ, Luo R, Lu XQ, Chen XX, Wu J, Huang HJ, Zhu Q, Li LJ, Yu J, Cao HC. Development and validation of a machine learning model for hospital-acquired bacterial infection prediction in acute-on-chronic liver failure. World J Gastroenterol 2027; 33(3): 123339
- URL: https://www.wjgnet.com/1007-9327/full/v33/i3/123339.htm
- DOI: https://dx.doi.org/10.3748/wjg.123339