
















Copyright: ©Author(s) 2026.
World J Gastroenterol. Jan 21, 2027; 33(3): 123339
Published online Jan 21, 2027. doi: 10.3748/wjg.123339
Published online Jan 21, 2027. doi: 10.3748/wjg.123339
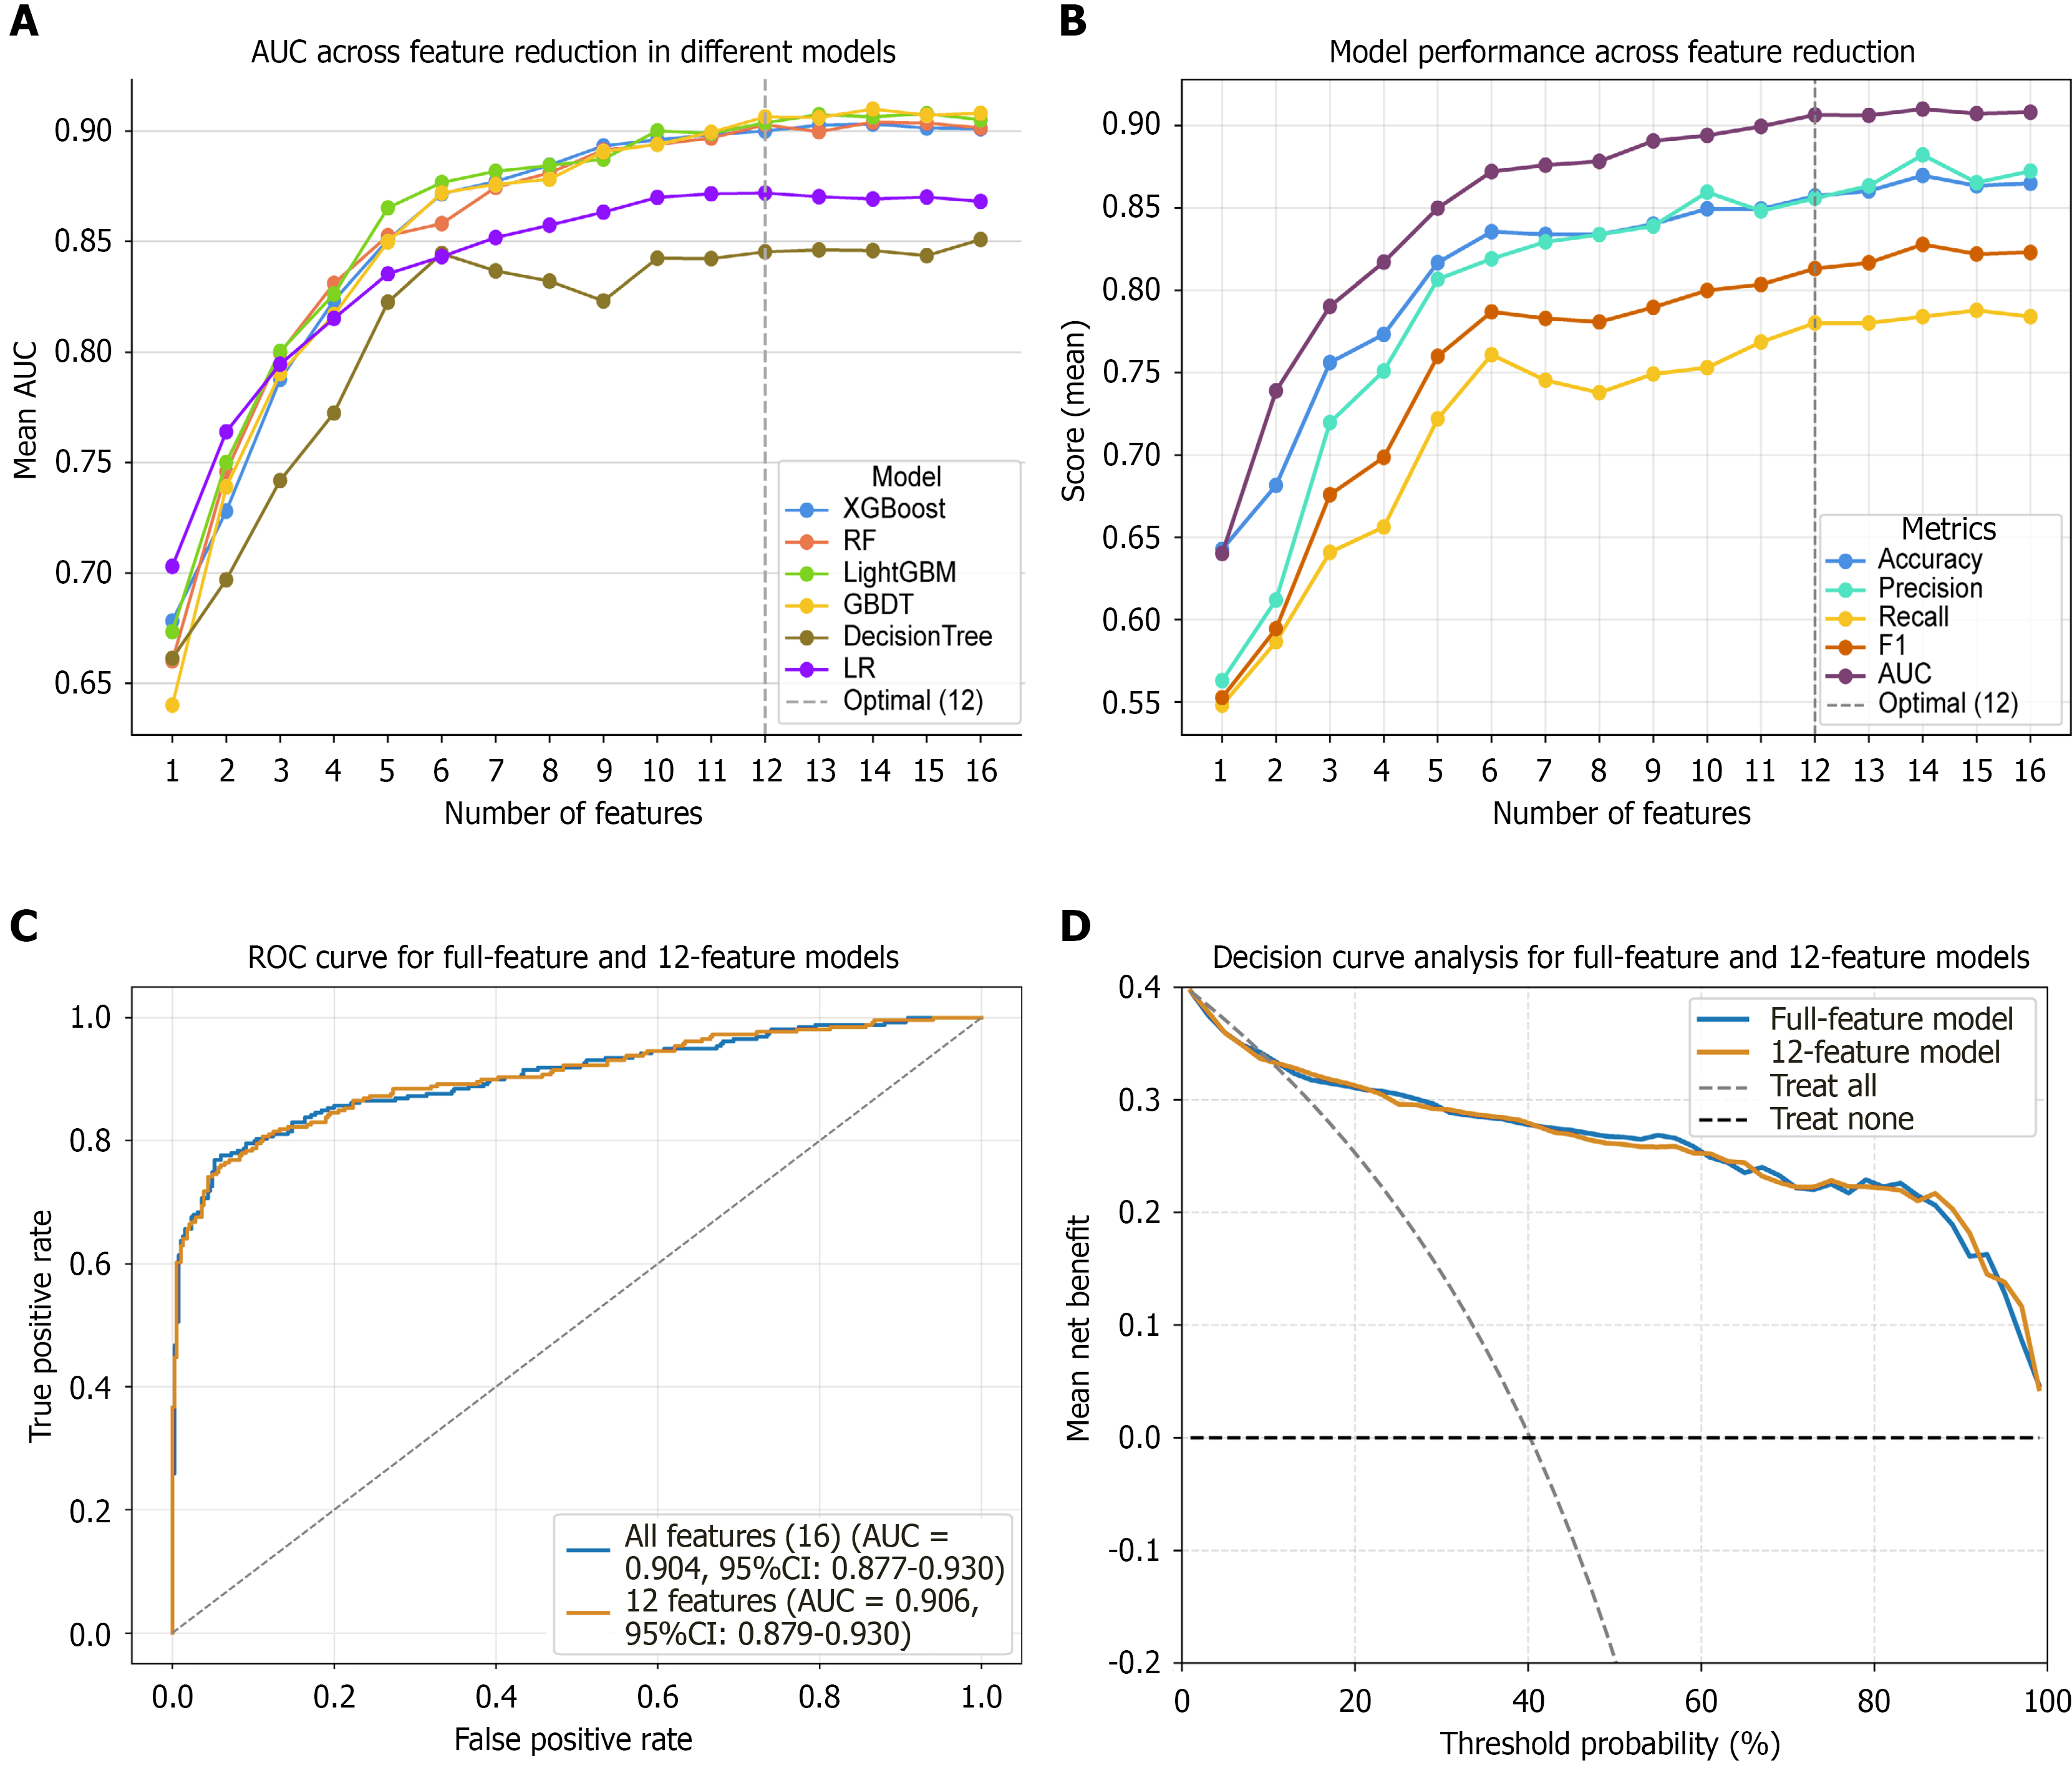
Figure 4 Feature selection of the Gradient Boosting Decision Tree model.
A: The area under the receiver curve for models with different numbers of features selected by sequential elimination of the least important features according to SHapley Additive exPlanations (SHAP) values. The gray dashed line indicates the optimal number of features chosen for the final model; B: Performance trends of the Gradient Boosting Decision Tree (GBDT) model during sequential SHAP-based feature elimination, based on out-of-fold (OOF) predictions; C: Comparison of receiver operating characteristic curves based on OOF predictions for the GBDT model using 16 features vs the reduced 12-feature set in the internal validation process during sequential feature elimination; D: Decision curve analysis comparing the 16-feature and 12-feature GBDT models. XGBoost: Extreme Gradient Boosting; RF: Random Forest; LightGBM: Light Gradient Boosting Machine; GBDT: Gradient Boosting Decision Tree; LR: Logistic Regression; AUC: Area under the curve; CI: Confidence interval.
- Citation: Chen JY, Chen XY, Xie YW, Chen YW, Shi XW, Lin N, Huang CJ, Luo R, Lu XQ, Chen XX, Wu J, Huang HJ, Zhu Q, Li LJ, Yu J, Cao HC. Development and validation of a machine learning model for hospital-acquired bacterial infection prediction in acute-on-chronic liver failure. World J Gastroenterol 2027; 33(3): 123339
- URL: https://www.wjgnet.com/1007-9327/full/v33/i3/123339.htm
- DOI: https://dx.doi.org/10.3748/wjg.123339