
















Copyright: ©Author(s) 2027.
World J Gastroenterol. Jan 7, 2027; 33(1): 122550
Published online Jan 7, 2027. doi: 10.3748/wjg.122550
Published online Jan 7, 2027. doi: 10.3748/wjg.122550
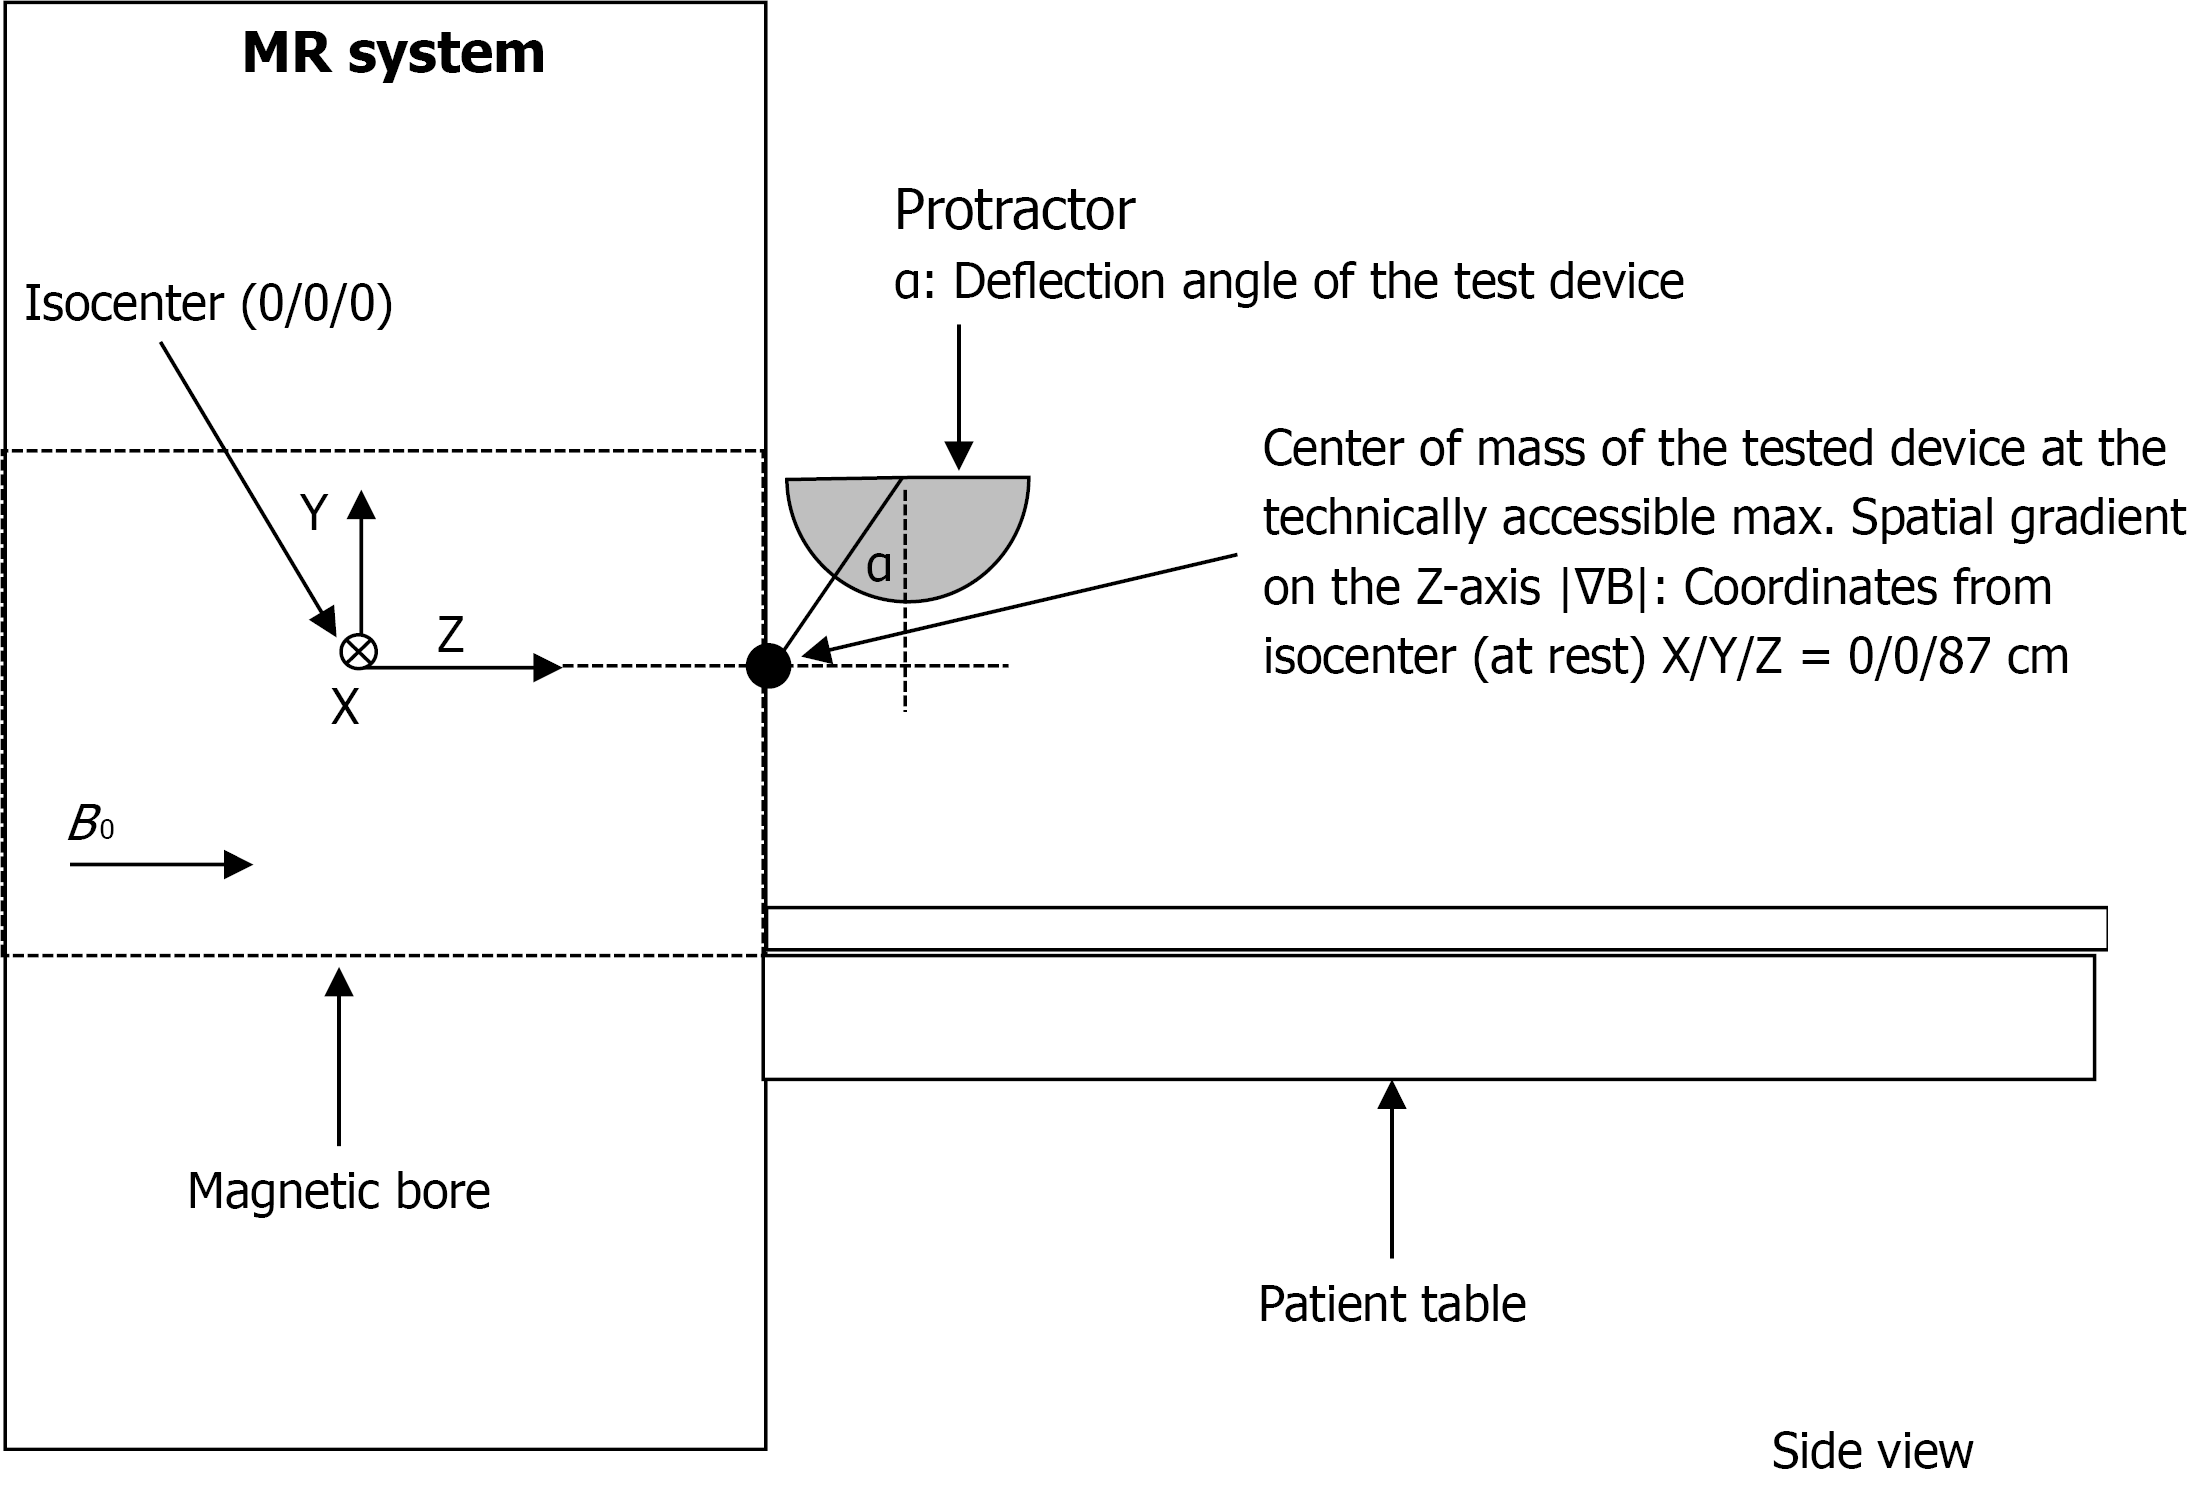
Figure 1 Test fixture for magnetically induced displacement force measurement.
Static magnetic field B0 at the isocenter, spatial magnetic gradient ∇B = dB/dz of magnetic field dB between coordinates on the Z-axis (dz). MR: Magnetic resonance.
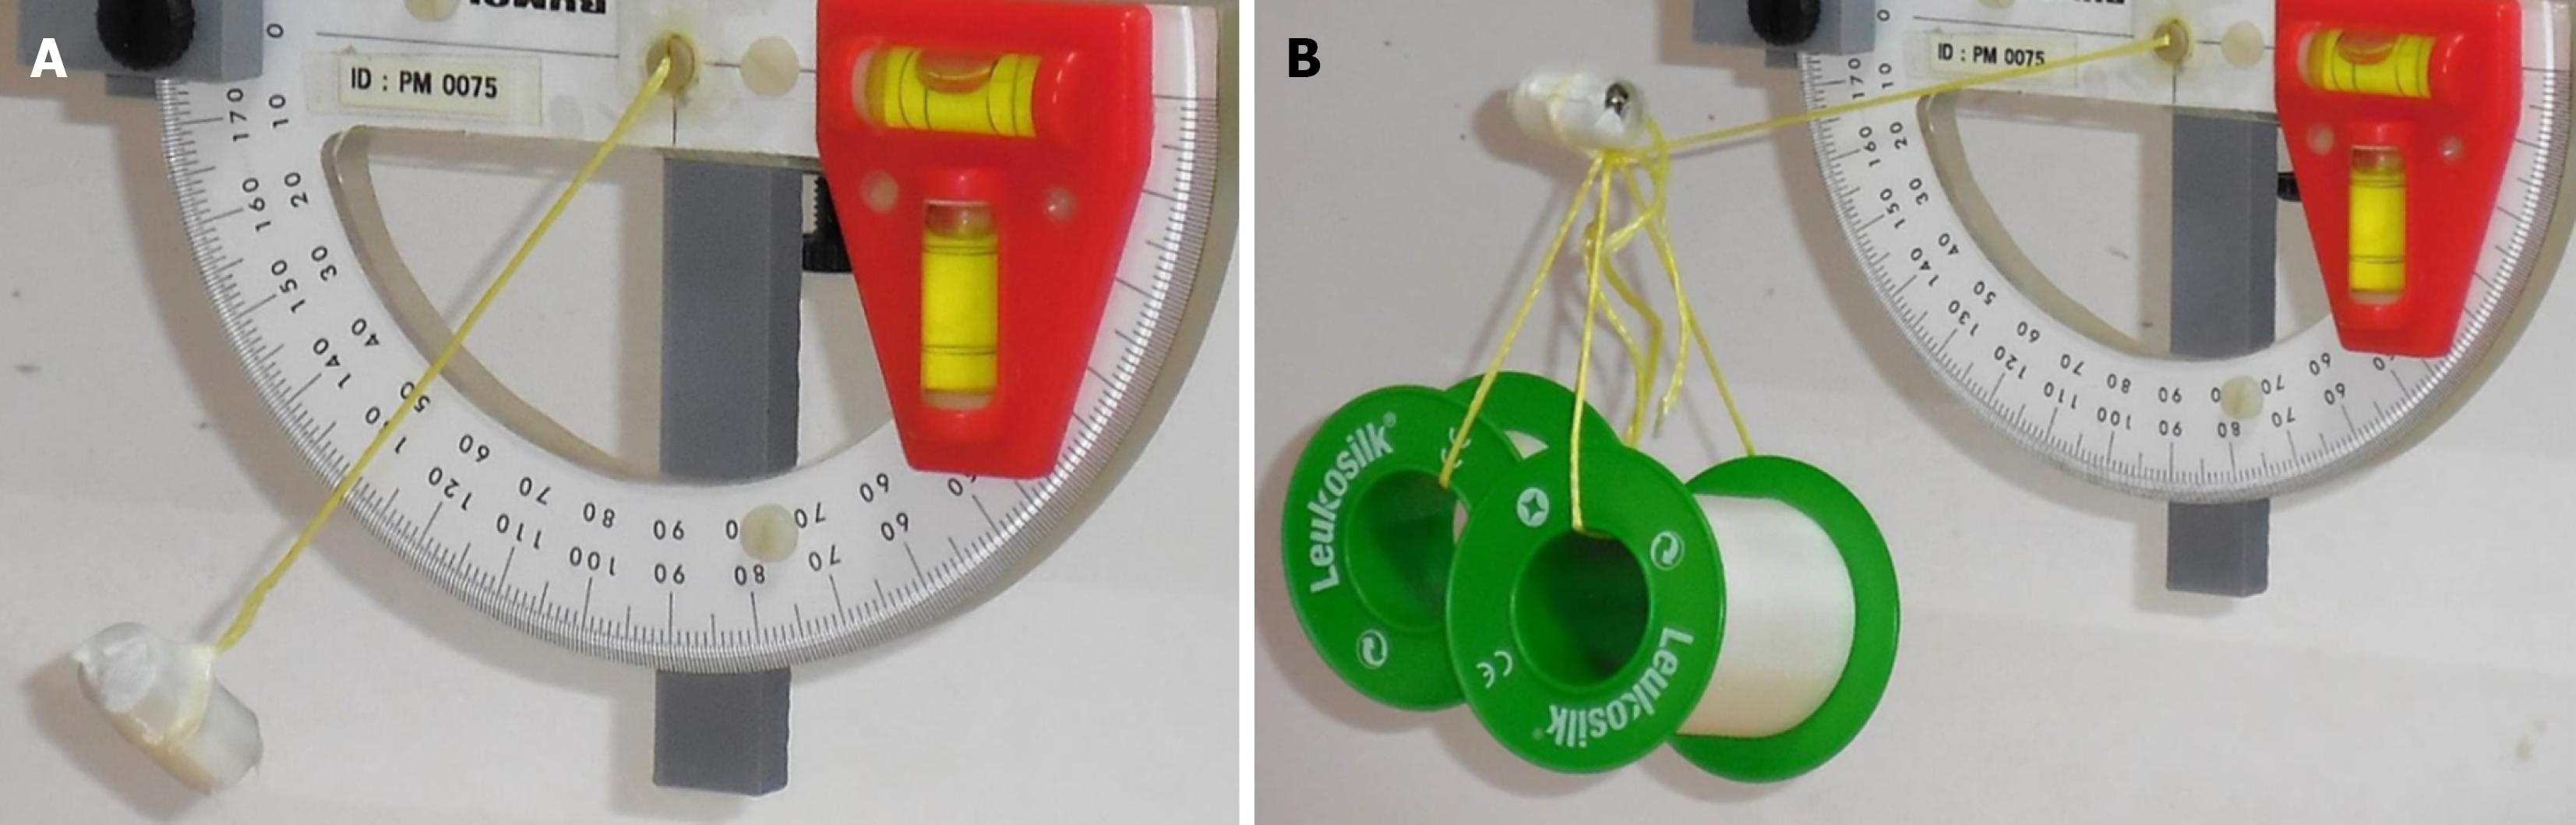
Figure 2 Test setup for calculation of displacement force.
A: Deflection angle < 45°; B: Deflection angle > 45° even with additional weights.
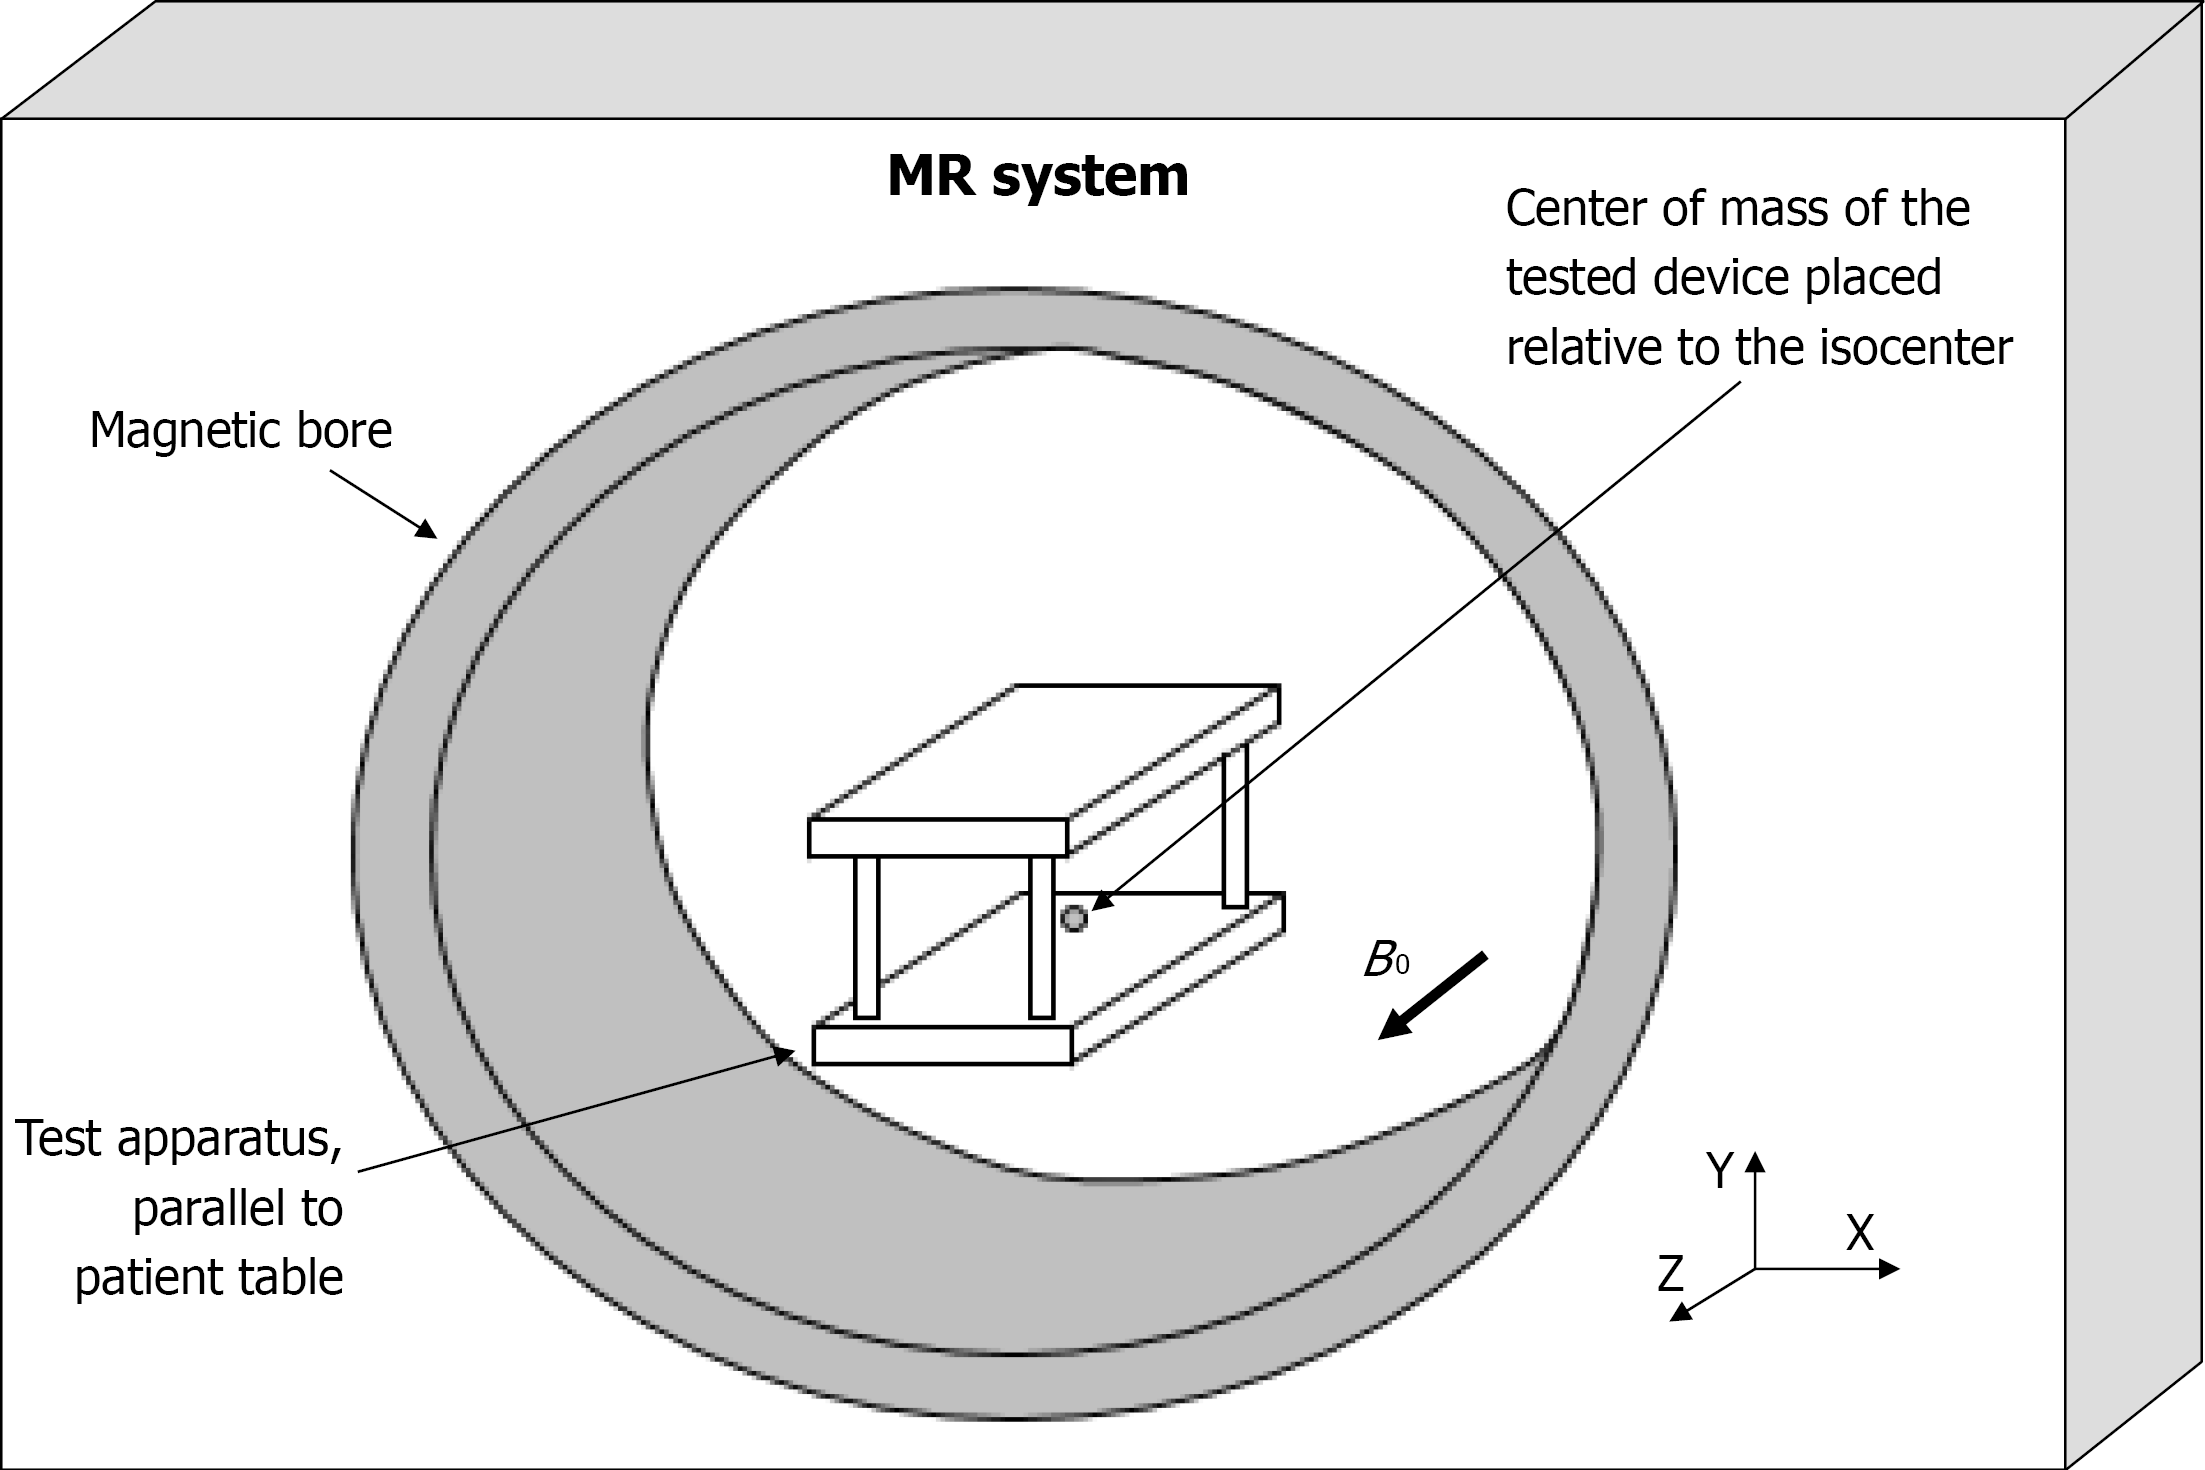
Figure 3 Magnetic resonance system with test apparatus relative to the isocenter.
MR: Magnetic resonance.
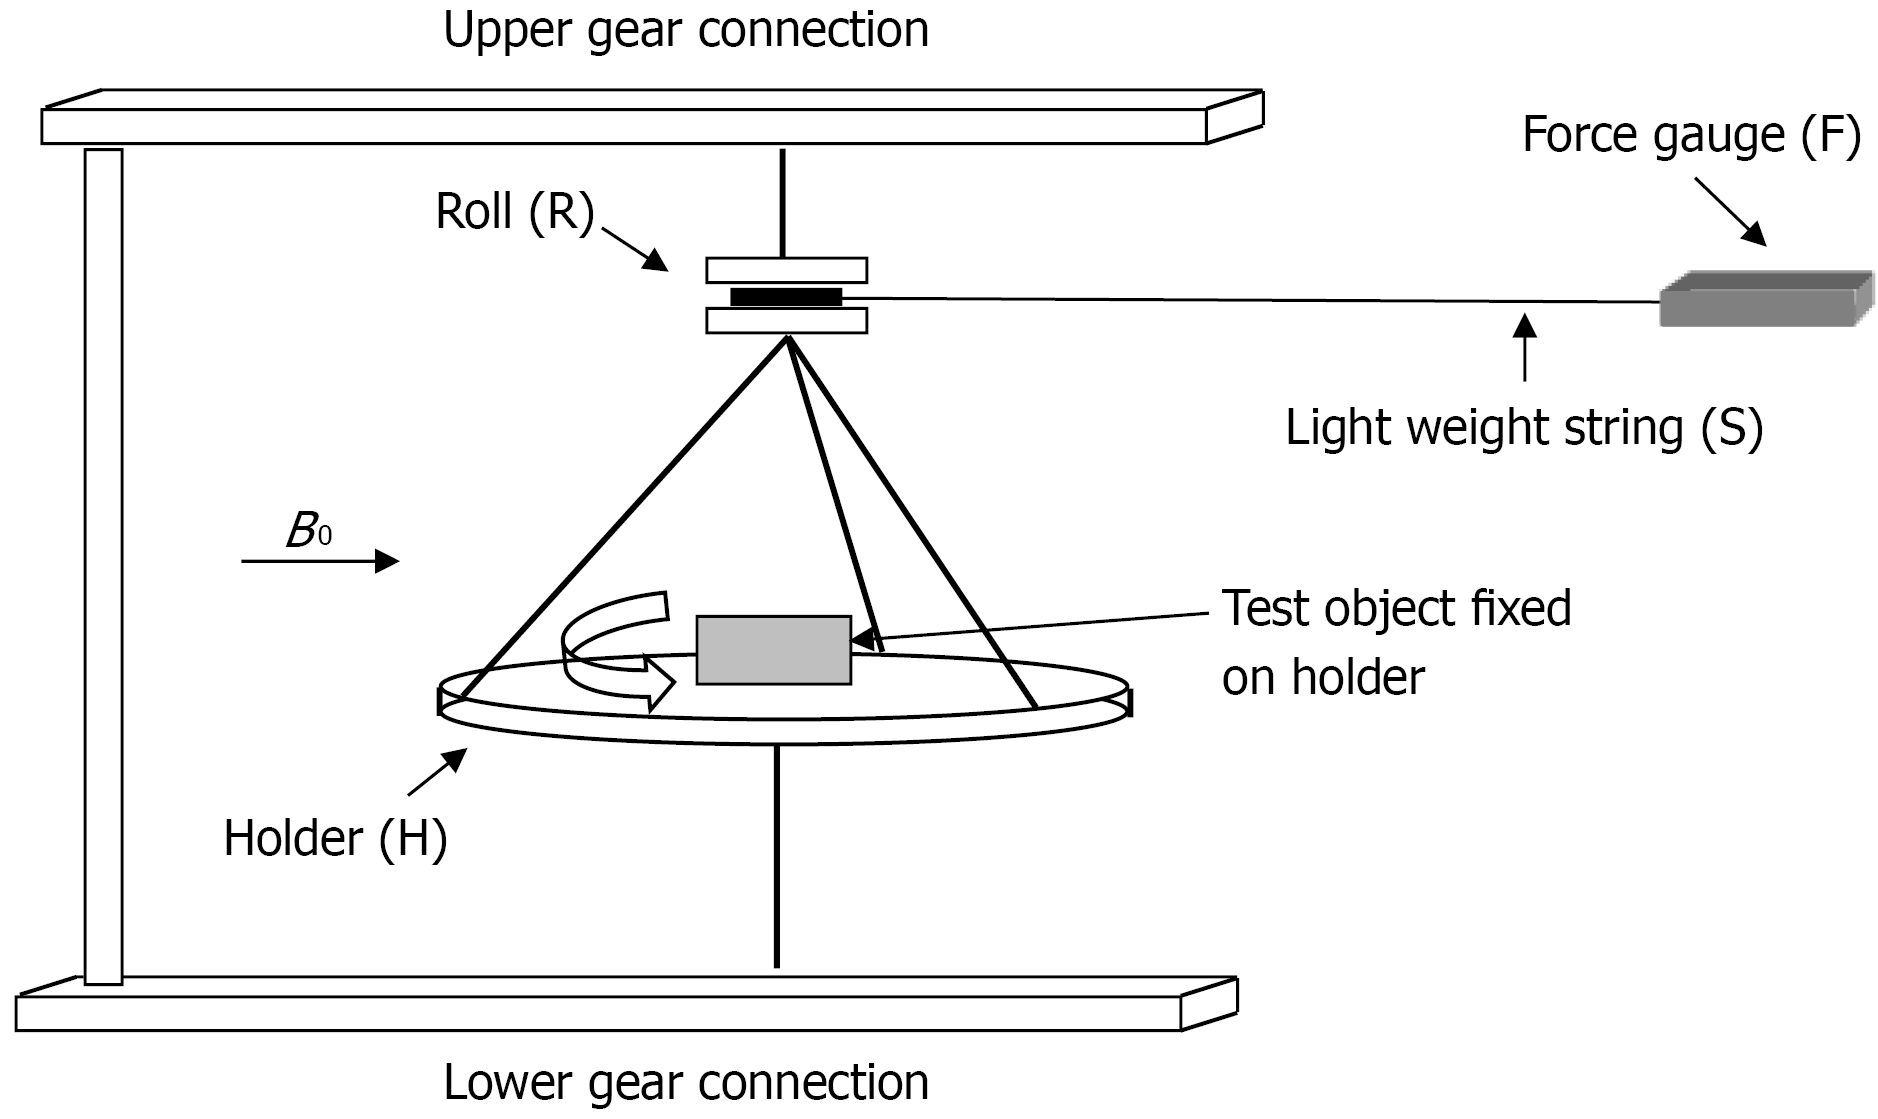
Figure 4 Schematic drawing of test apparatus for torque with force gauge.
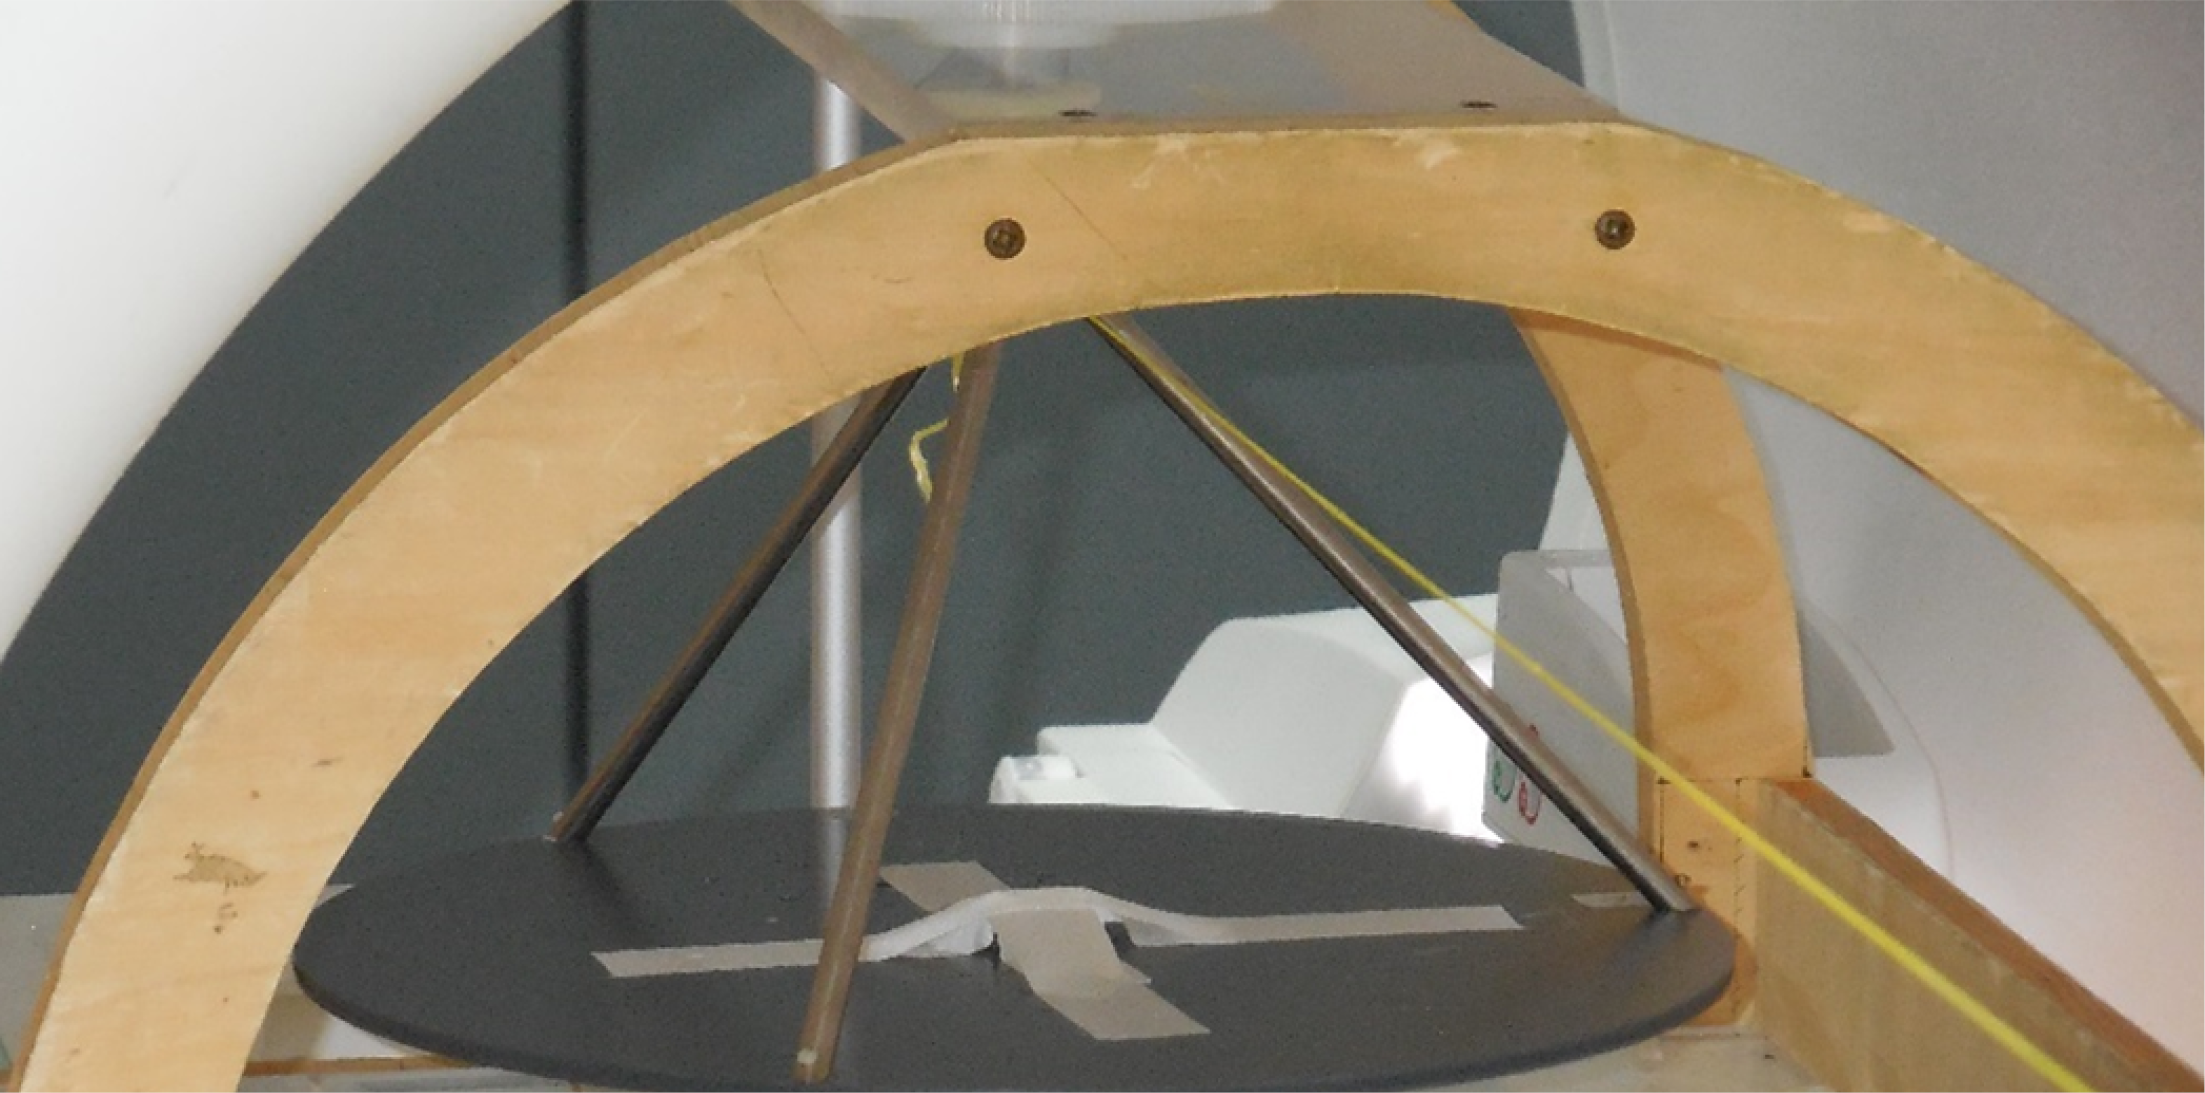
Figure 5 Test apparatus with force gauge for torque.
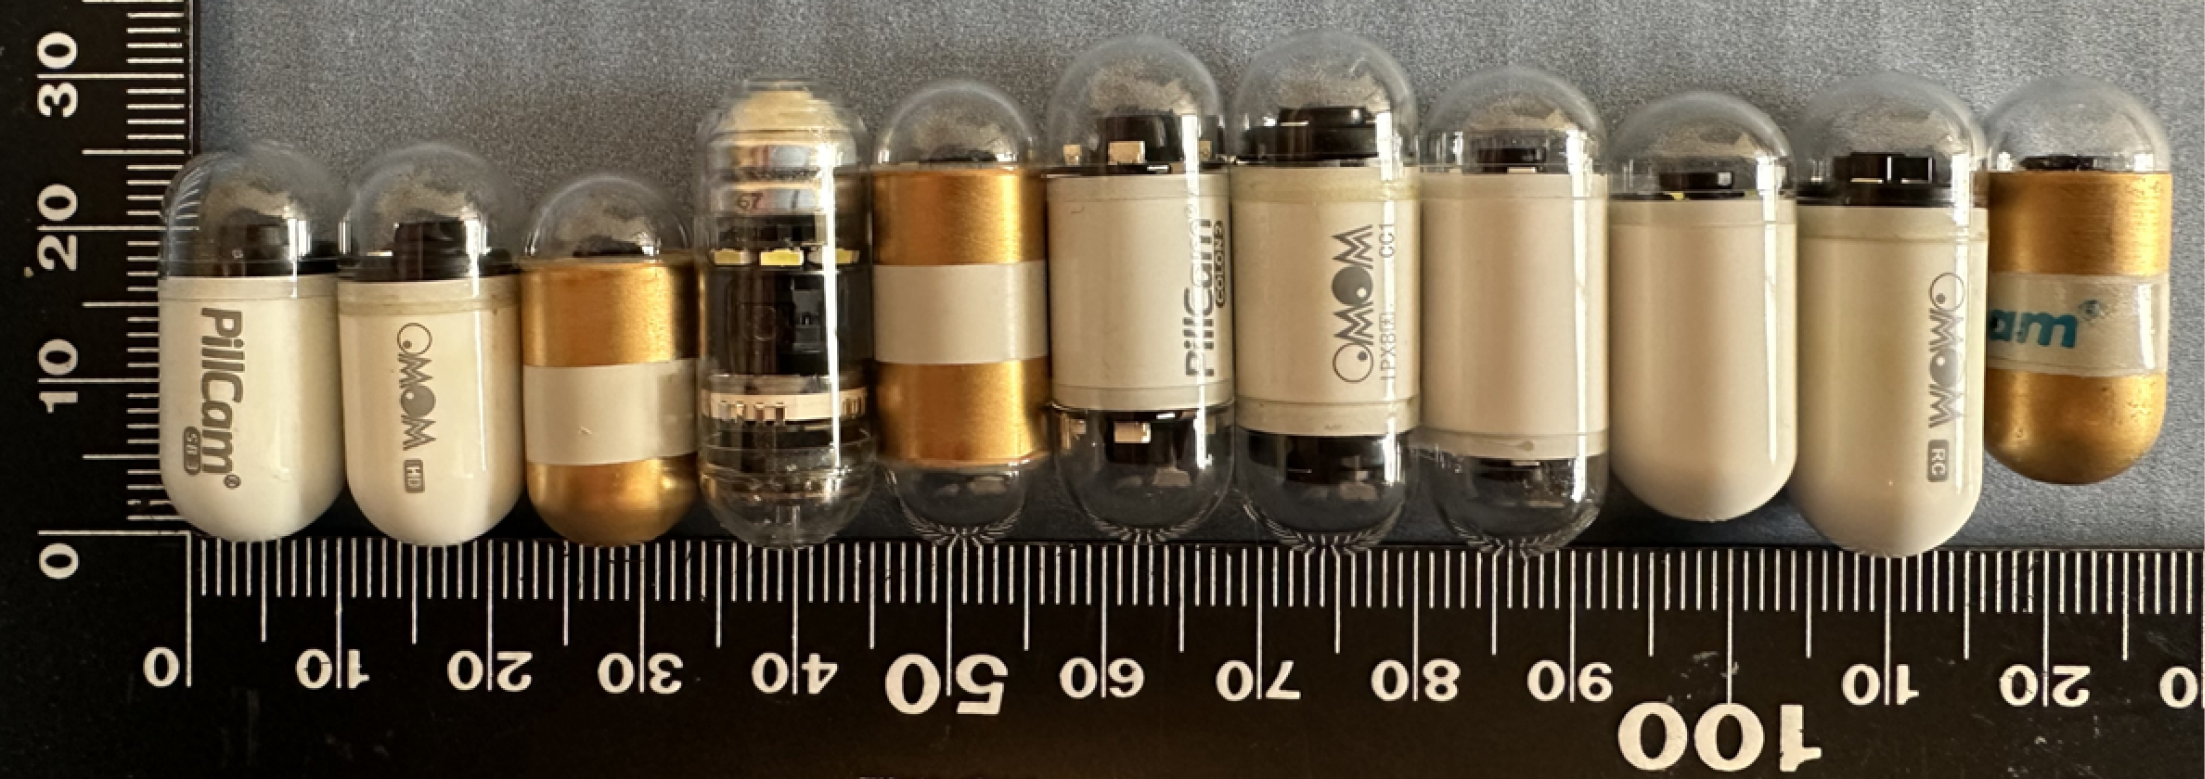
Figure 6 Video capsule endoscopy tested.
From left to right: PillCam SB3, OMOM HD, MiroCam 1200, CapsoCam Plus, MiroCam 2000, PillCam Colon2, OMOM CC, NaviCam Colon, NaviCam, OMOM RC, MiroCam Navi. Note the magnetic attraction of the three capsules to the right.
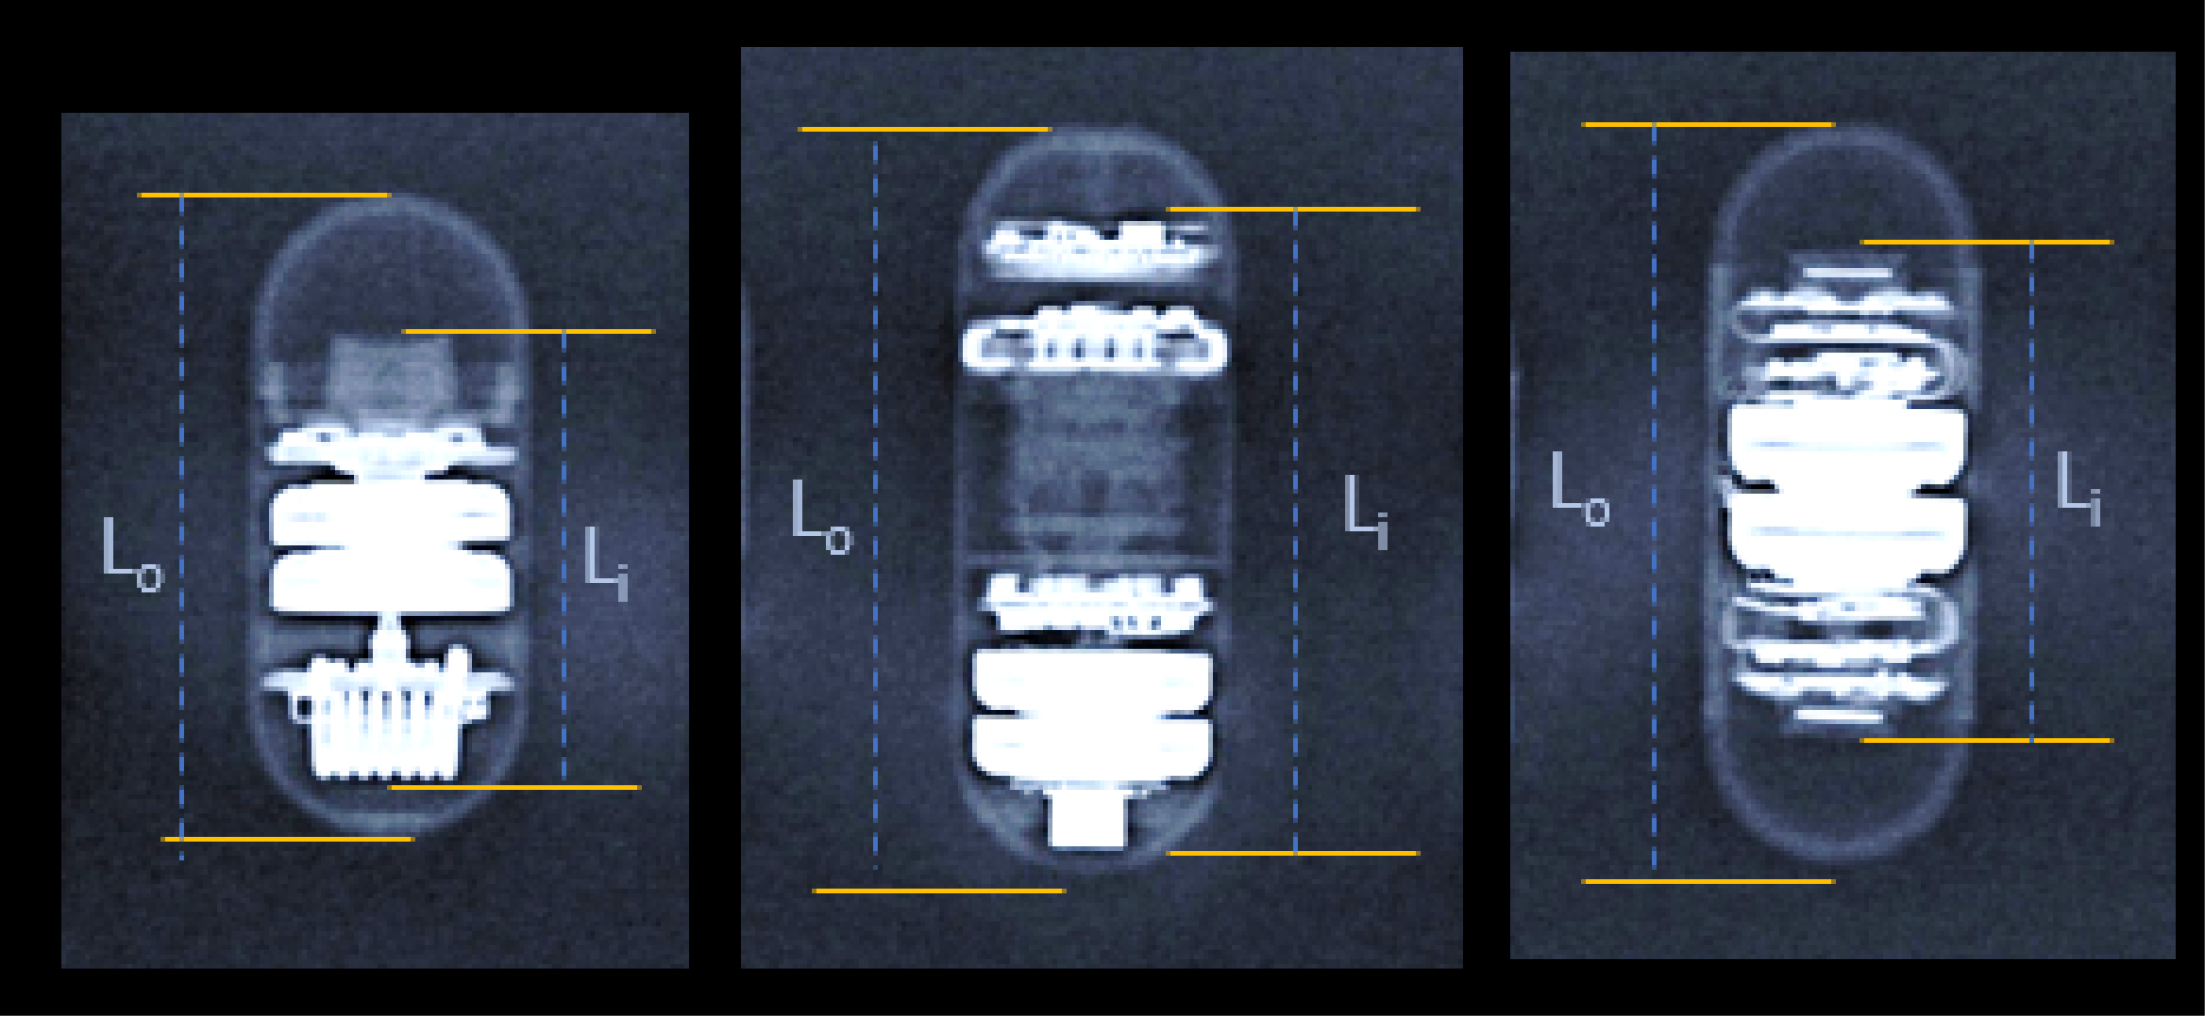
Figure 7 Examples of the radiographs taken from all video capsule endoscopes.
The relative distances between yellow lines on the left represent the outer length (Lo). The relative distances between yellow lines on the right side of each capsule mark the length of the potentially magnetic inner parts (Li). The relation of these relative distances (measured as pixels) together with physically measured length (mm) (Table 1) is used to calculate the absolute length of the solid inner part for each capsule.
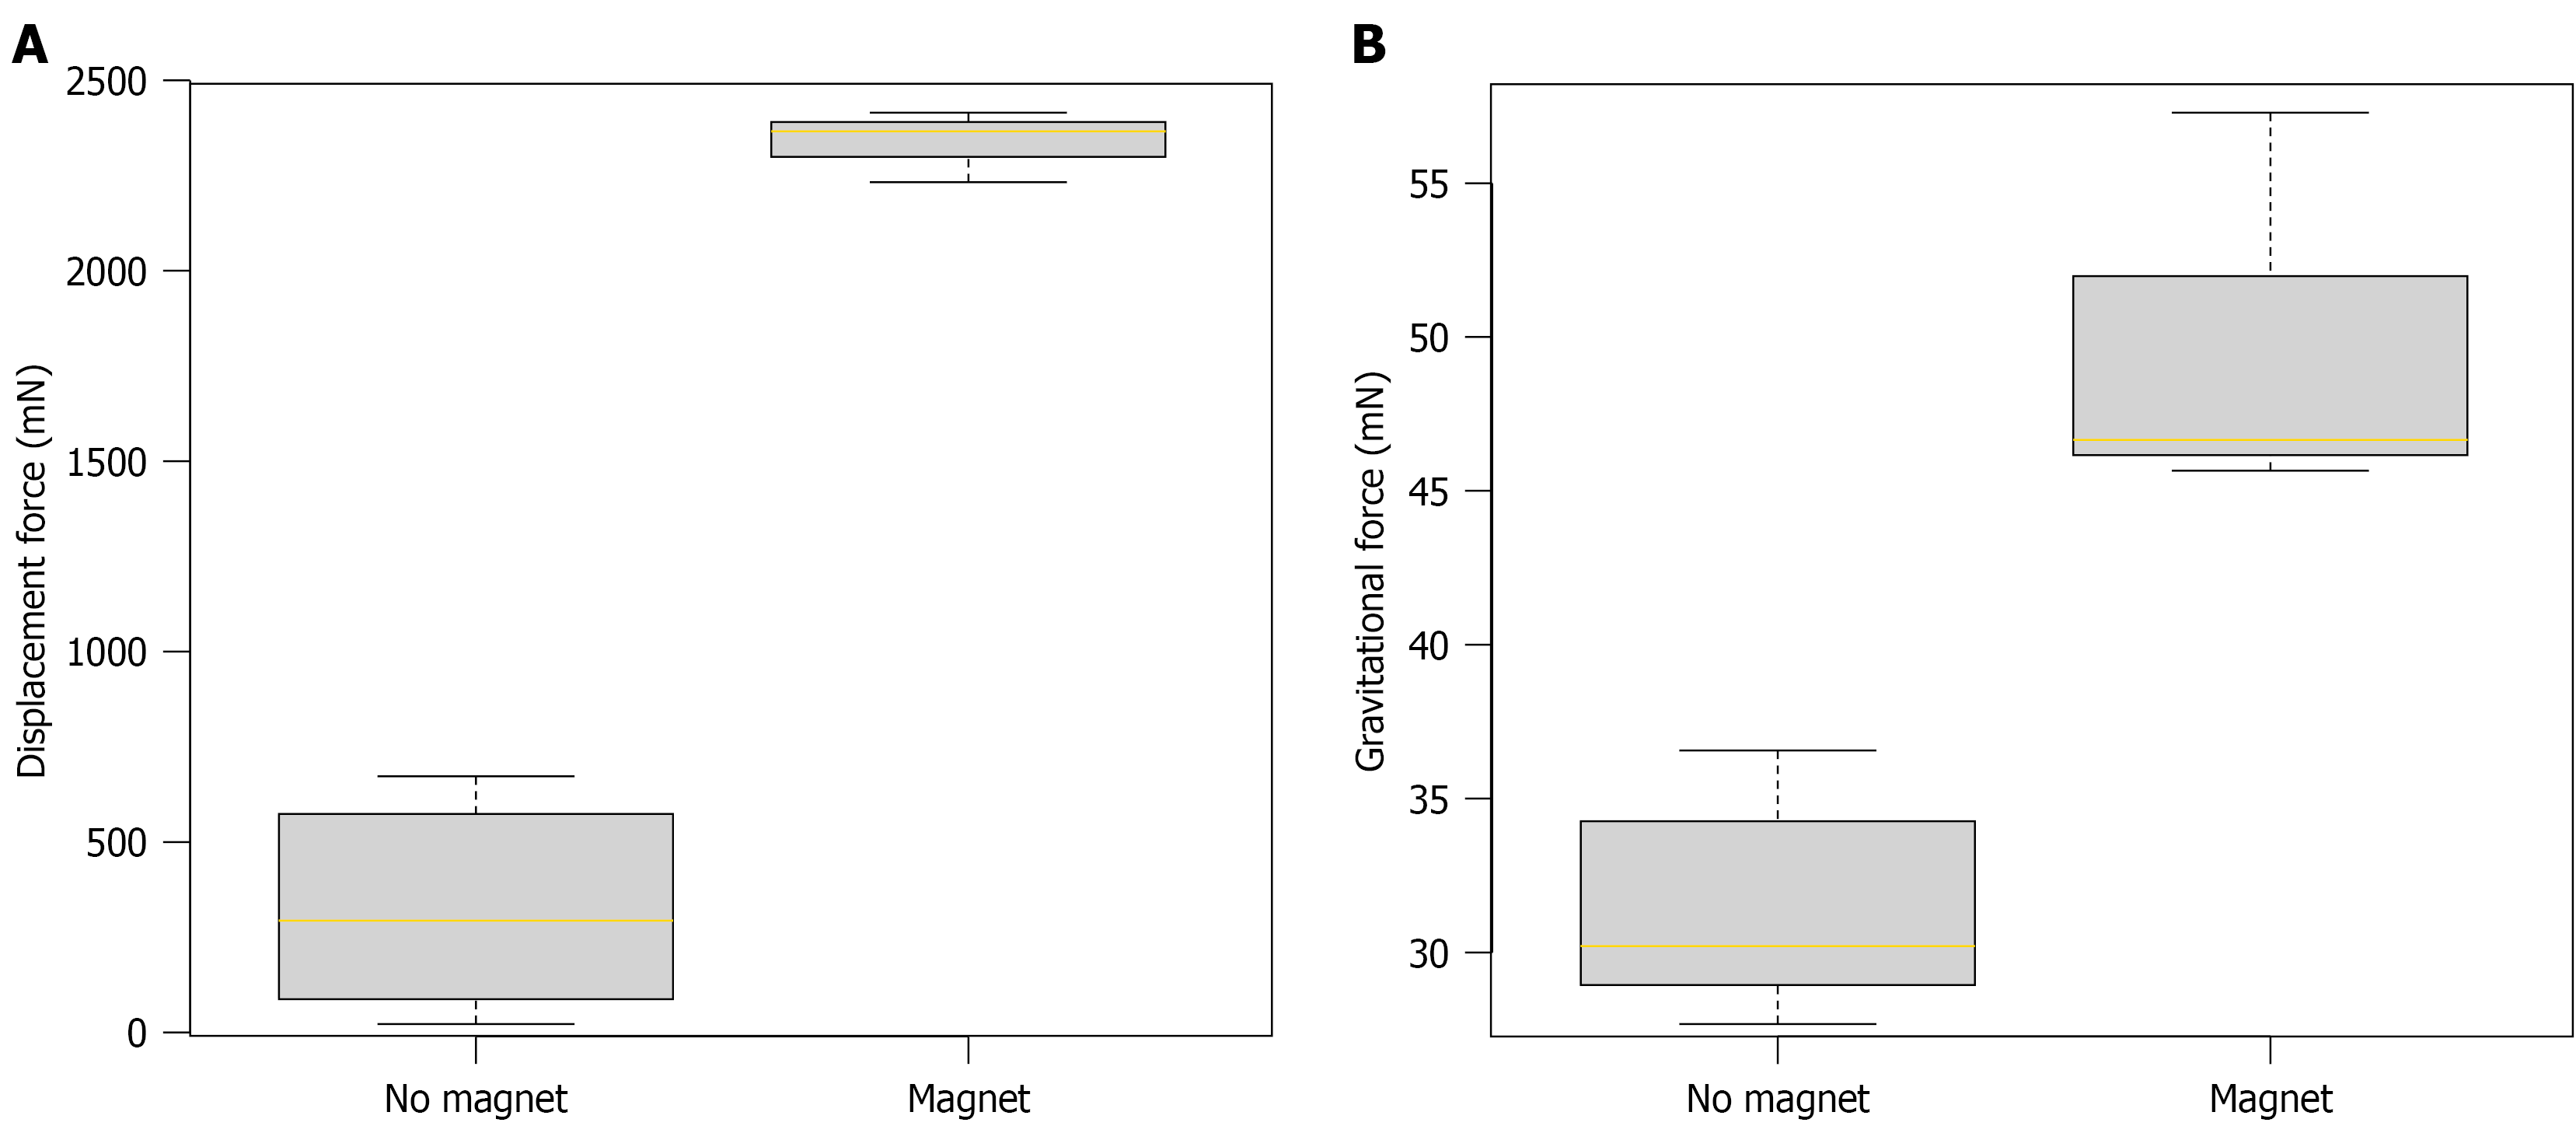
Figure 8 Box plots of magnetically induced displacement force and gravitational force on video capsule endoscopes.
A: Magnetically induced displacement force on video capsule endoscopes (VCEs) without (left) and with (right) an integrated permanent magnet; B: Gravity-induced force on VCEs without (left) and with (right) an integrated permanent magnet. The lengths of the boxes mark the 25th and 75th percentiles, the yellow lines indicate the 50th percentile (median), and the whiskers represent the 1.5-fold interquartile range. Note the different scales of the Y-axis in Figure 8A and B.
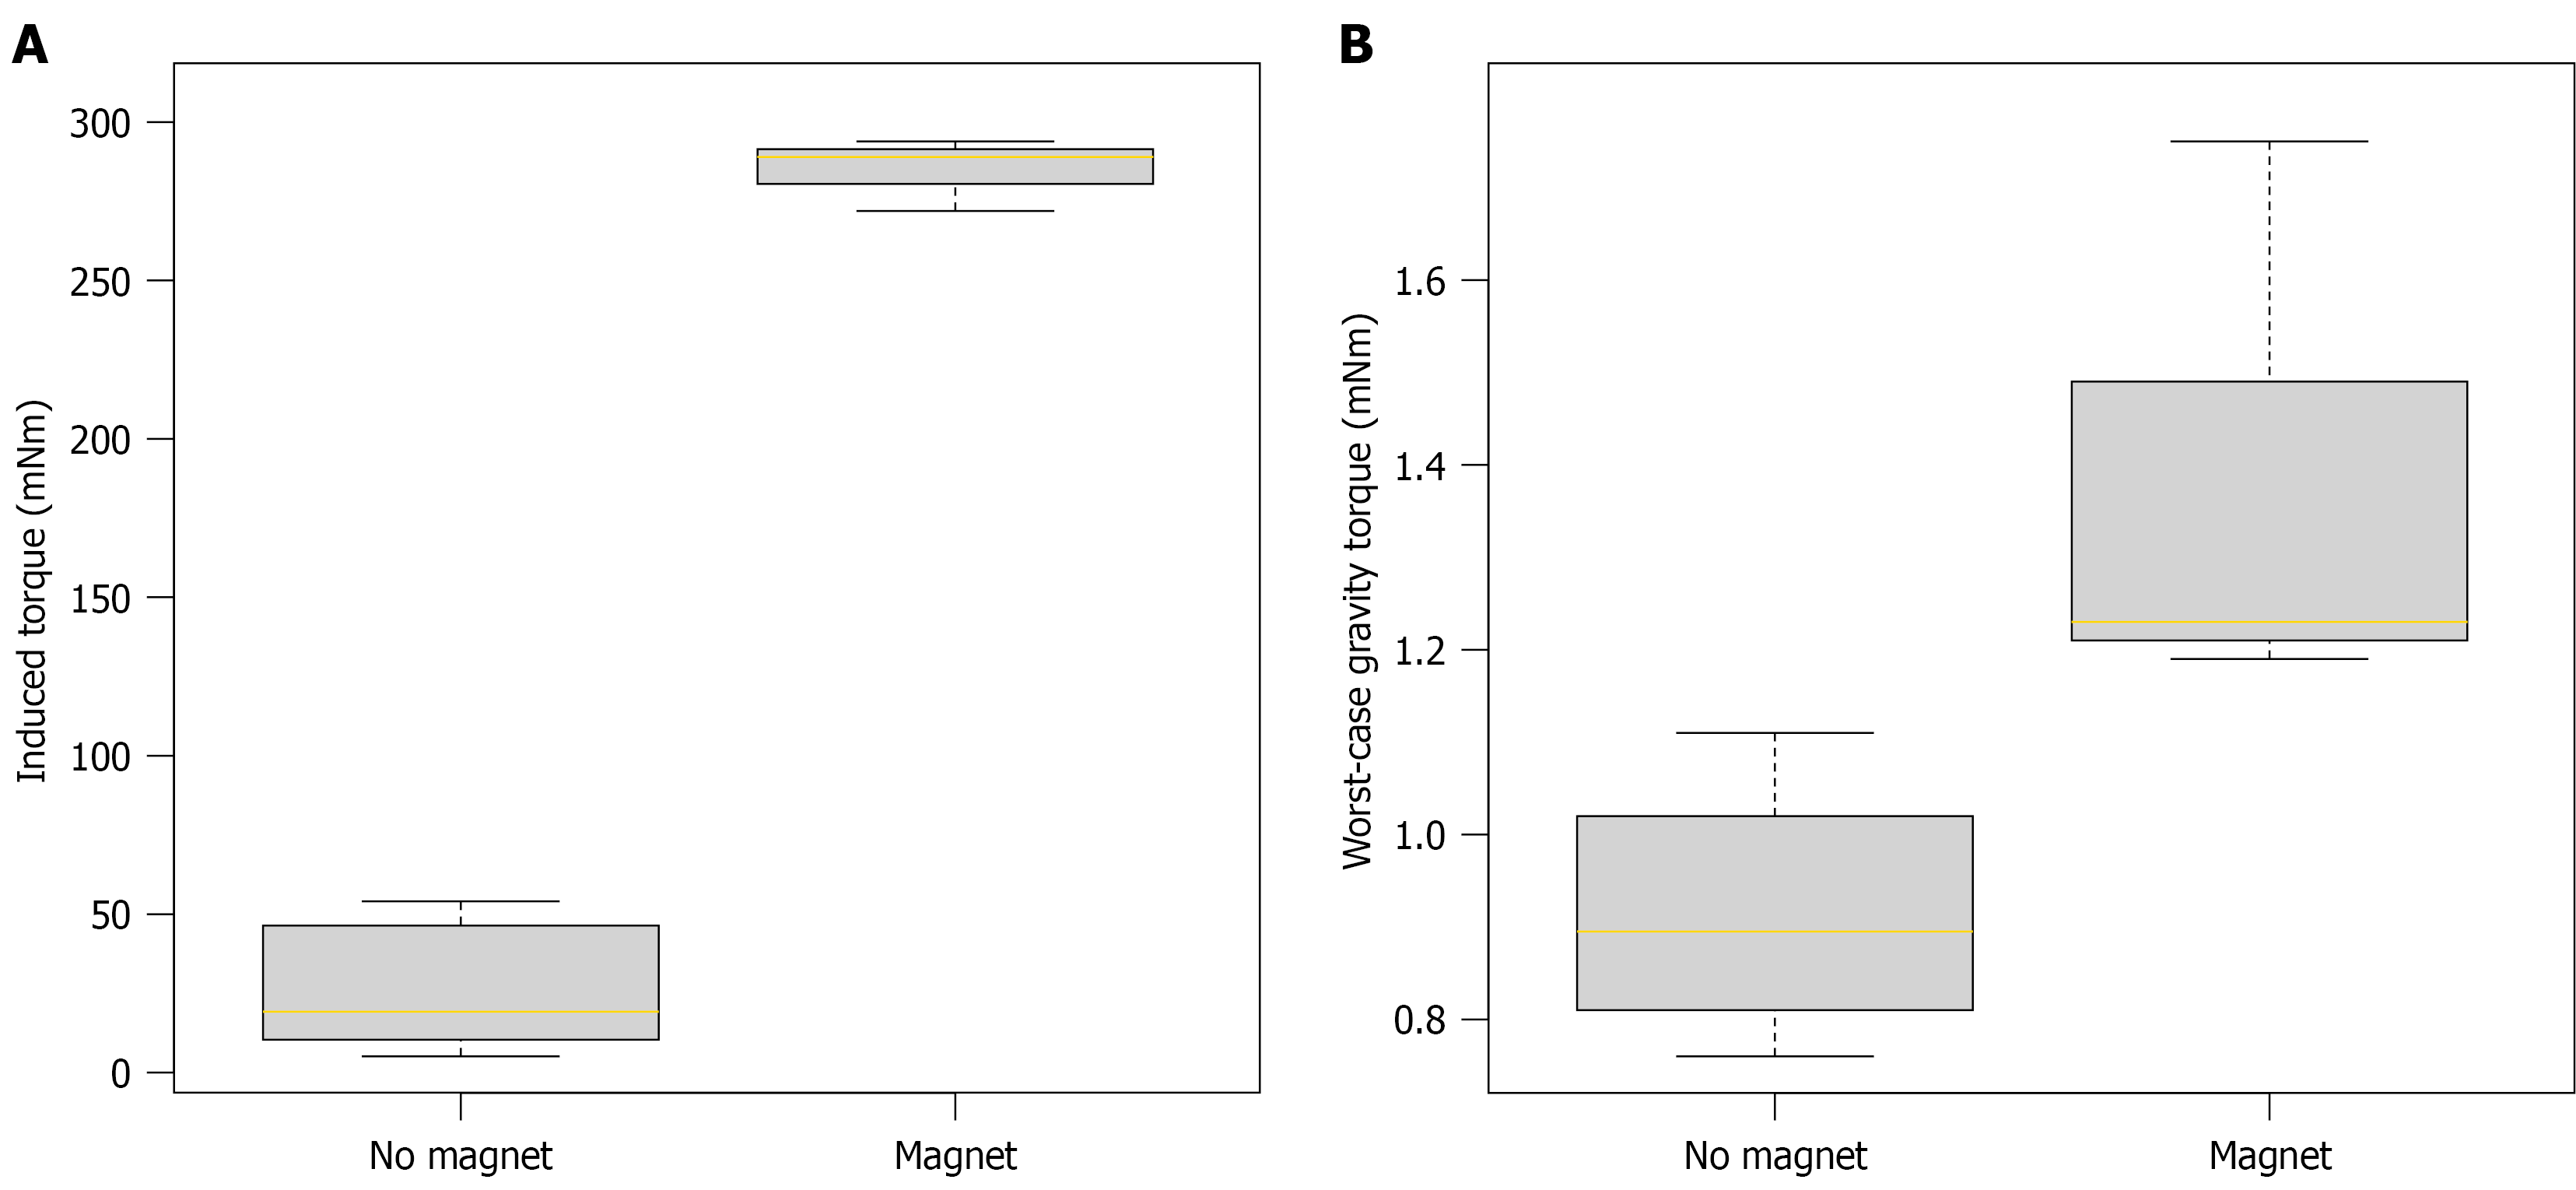
Figure 9 Box plots of magnetically induced torque and gravity-induced torque on video capsule endoscopes.
A: Magnetically induced torque on video capsule endoscopes (VCEs) without an integrated permanent magnet (left; measured) and with an integrated permanent magnet (right; calculated from displacement force); B: Worst-case torque due to gravity on VCEs without (left) and with (right) an integrated permanent magnet. The lengths of the boxes mark the 25th and 75th percentiles, the yellow lines indicate the 50th percentile (median), and the whiskers represent the 1.5-fold interquartile range. Note the different scales of the Y-axis in Figure 9A and B.
- Citation: Beck MJ, Keuchel M, Paschen J, Laser RM, Roling J, Bandorski D, Windhorst AC, Kurniawan N, Baltes P. Magnetic resonance imaging-induced forces on video capsule endoscopes: First systematic in vitro assessment. World J Gastroenterol 2027; 33(1): 122550
- URL: https://www.wjgnet.com/1007-9327/full/v33/i1/122550.htm
- DOI: https://dx.doi.org/10.3748/wjg.122550