Copyright
©The Author(s) 2025.
World J Gastroenterol. Jun 28, 2025; 31(24): 105823
Published online Jun 28, 2025. doi: 10.3748/wjg.v31.i24.105823
Published online Jun 28, 2025. doi: 10.3748/wjg.v31.i24.105823
Figure 1 Schematic diagram of gastric filling score.
A: Score 5. Smooth gastric mucosa without folds; B: Score 4. The height of mucosal folds was lower than the distance between the adjacent mucosal folds at greater gastric curvature; C: Score 3. The height of mucosal folds was roughly equivalent to the distance between the adjacent mucosal folds; D: Score 2. The height of mucosal folds is greater than the distance between the adjacent mucosal folds; E: Score 1. Gastric mucosa between folds was hard to observe.
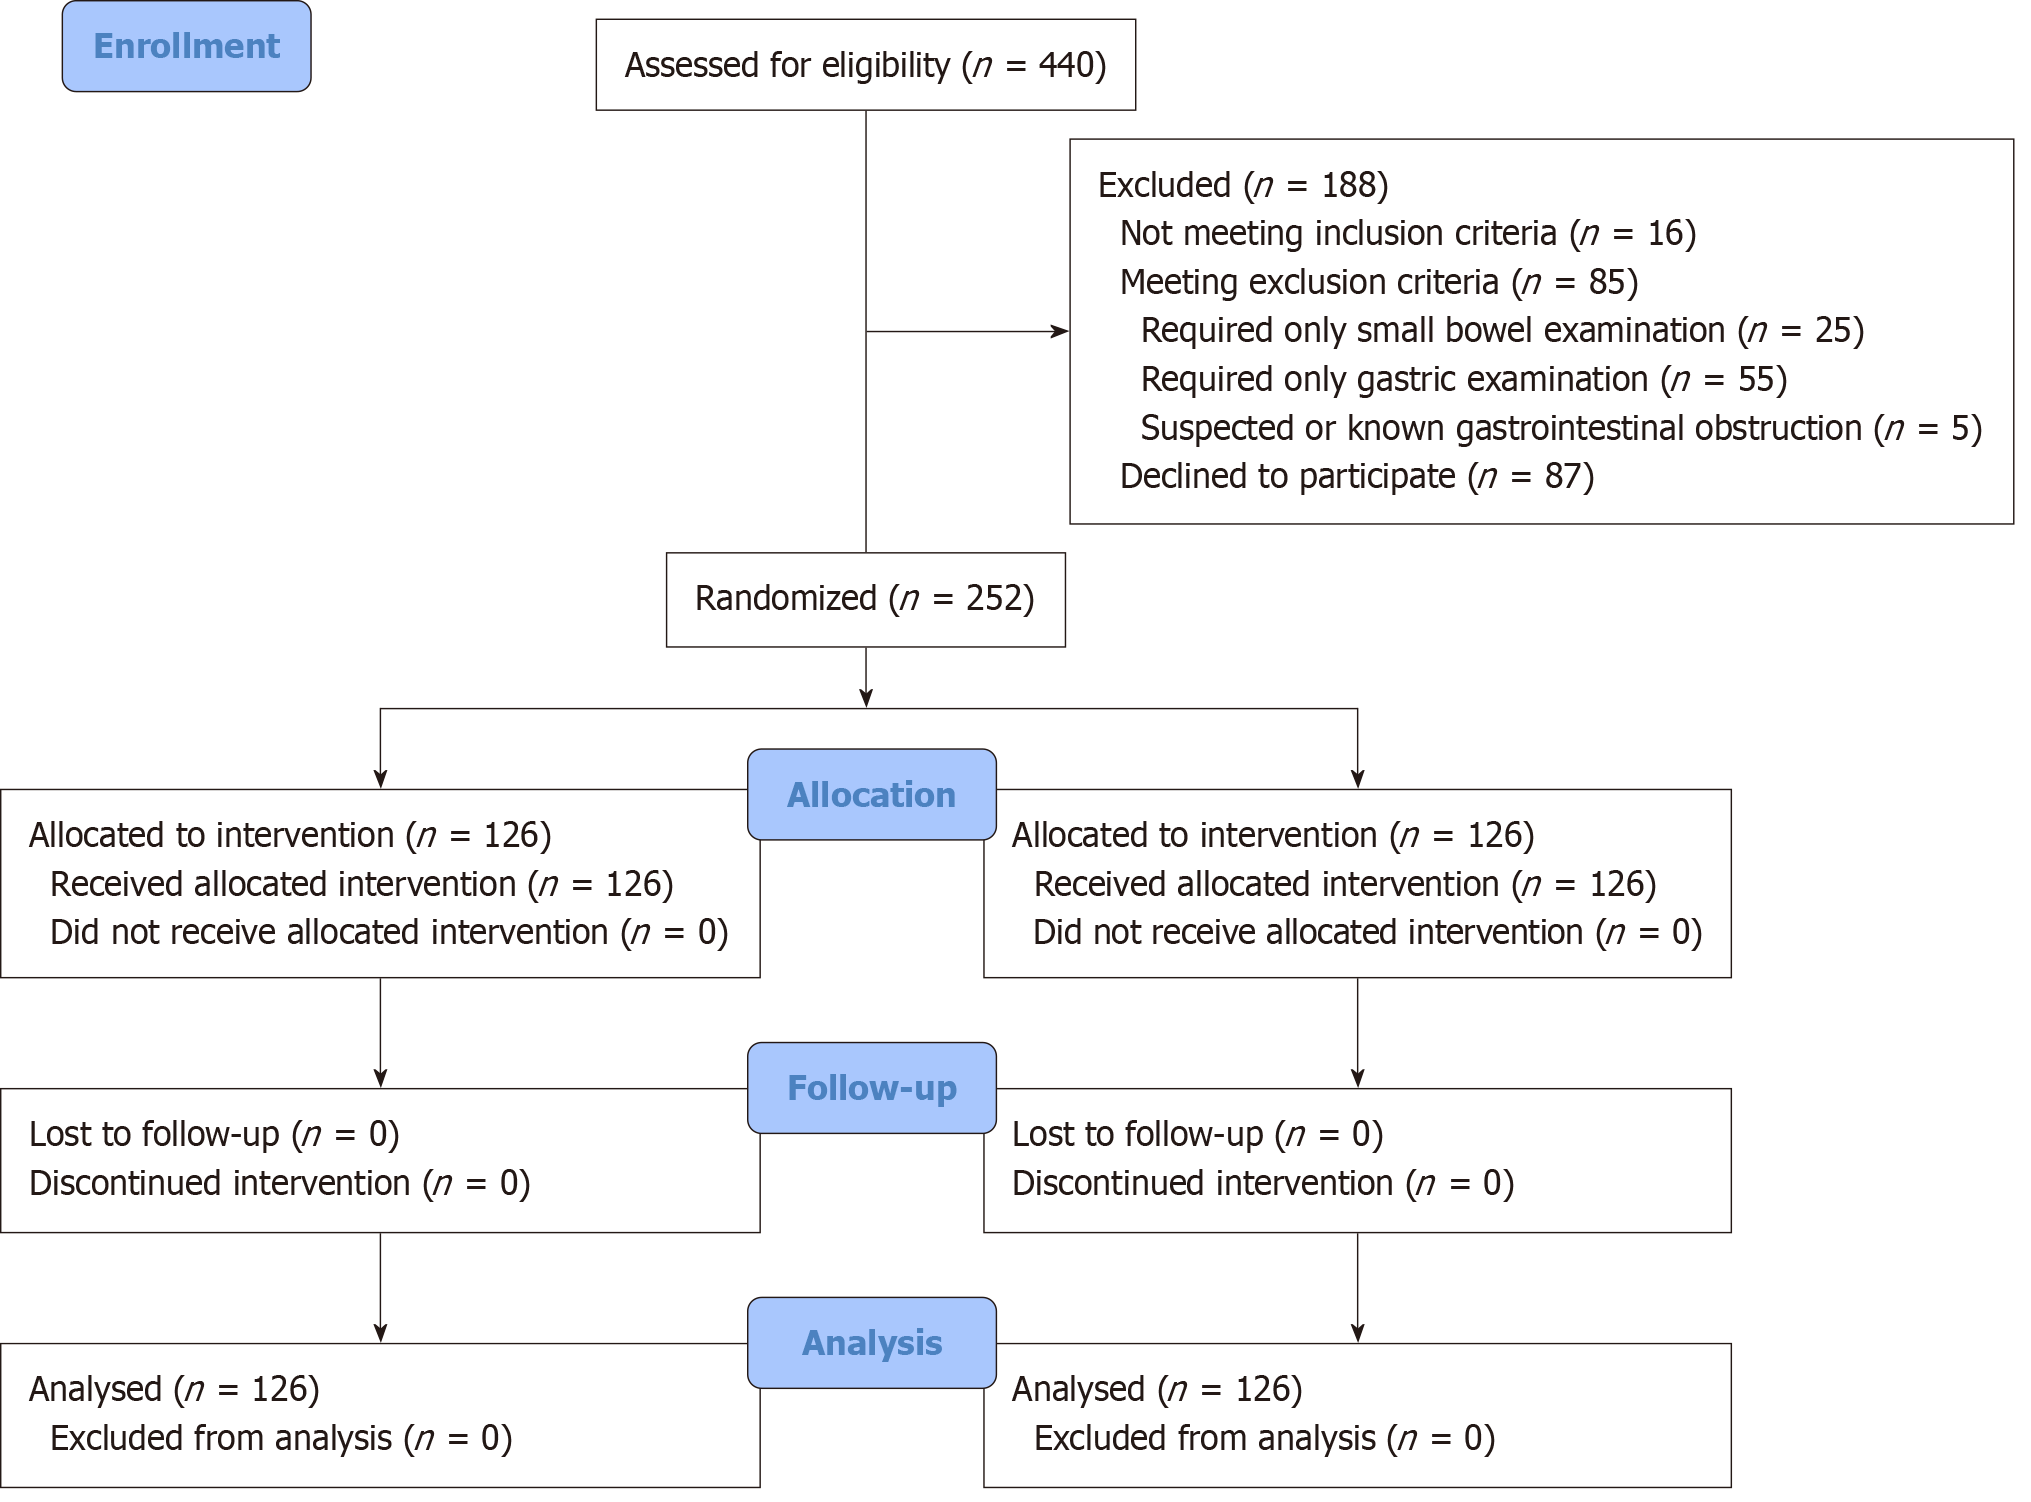
Figure 2
CONSORT 2010 flow diagram.
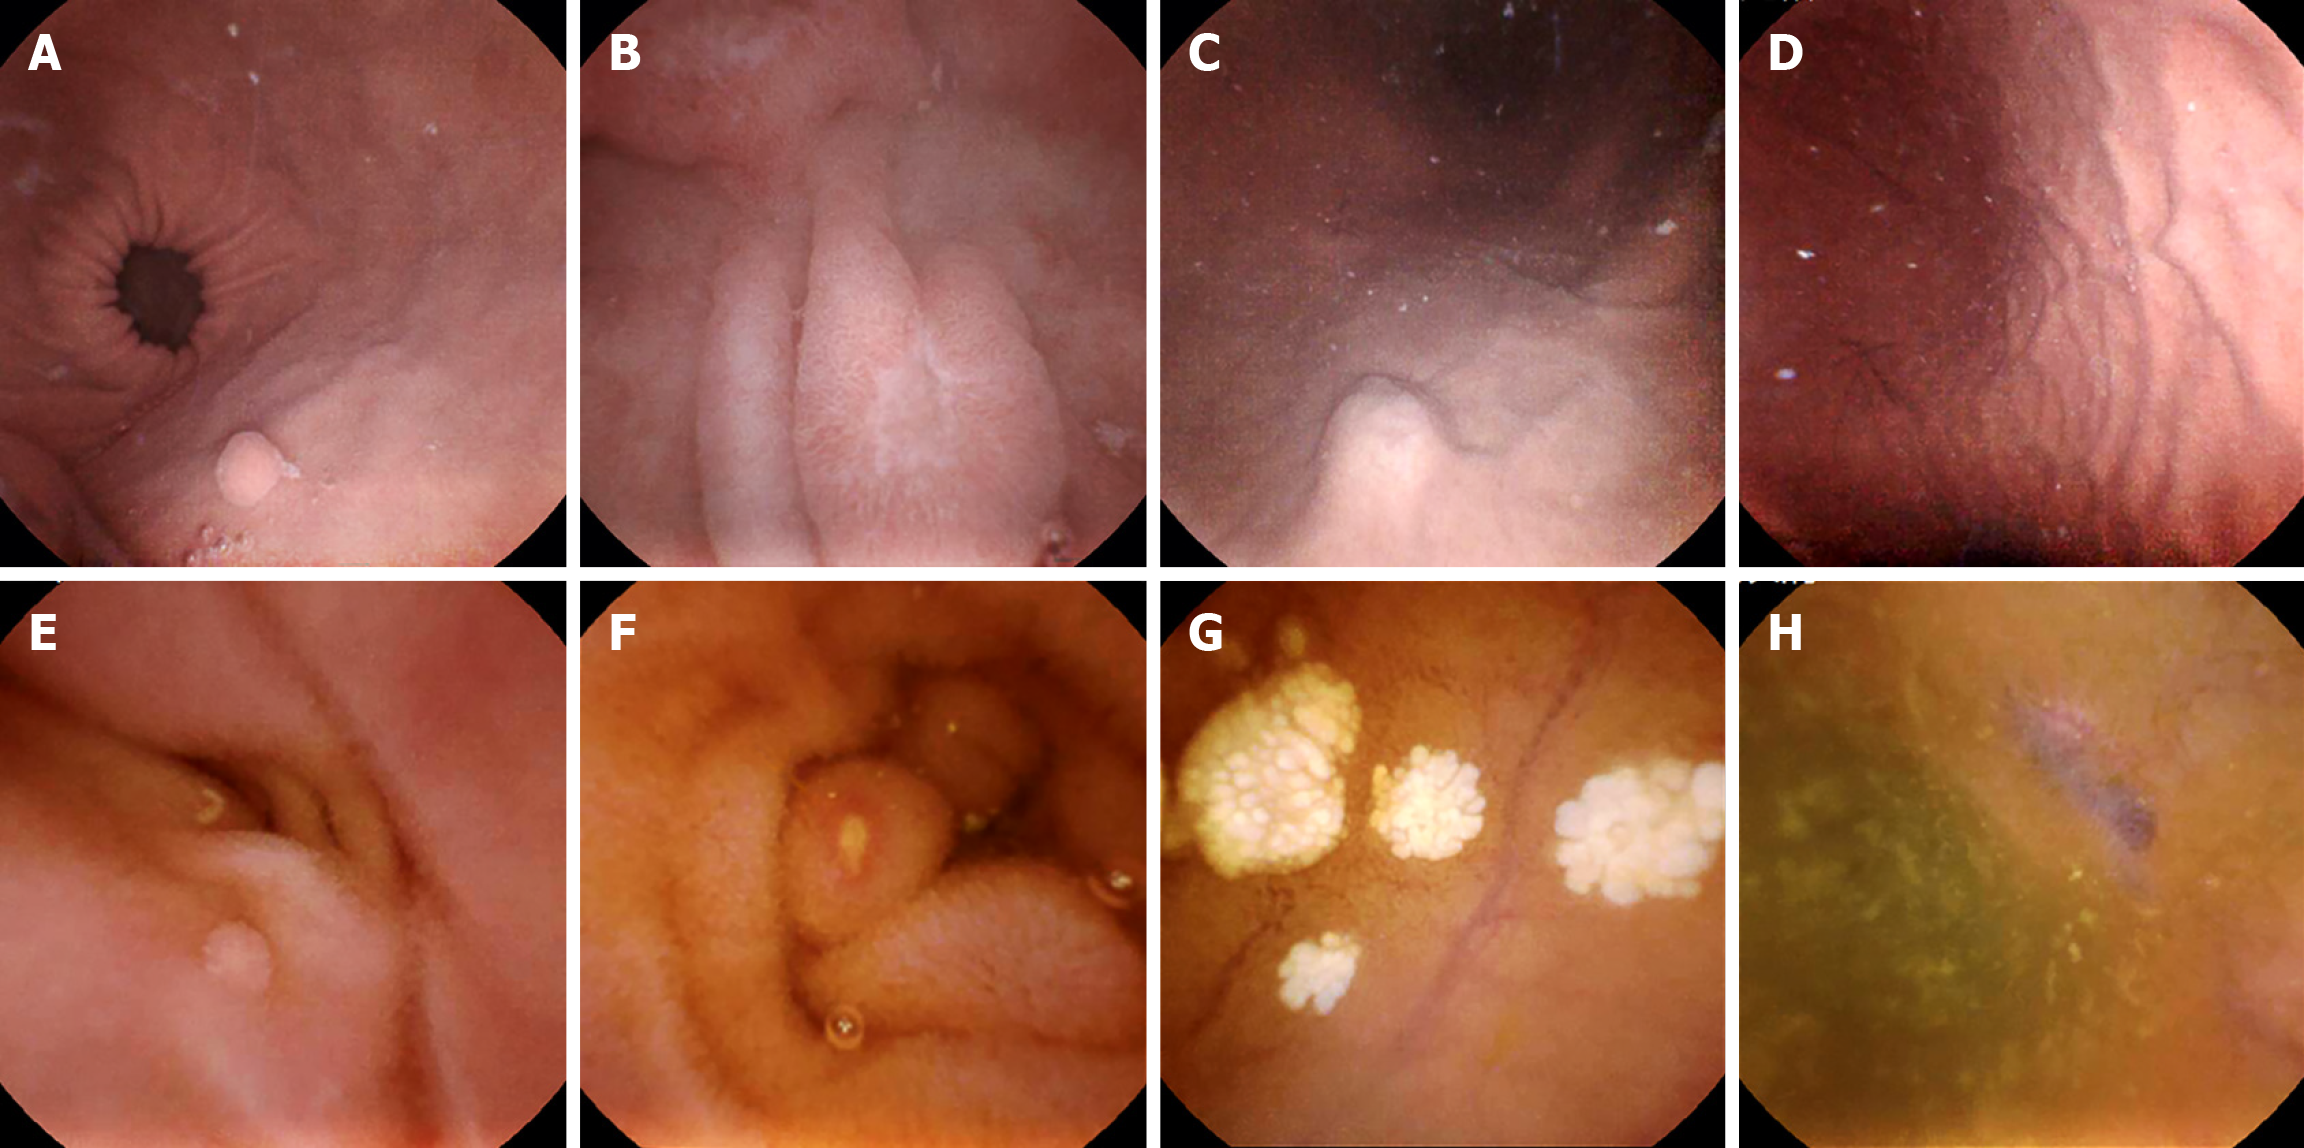
Figure 3 The images of focal lesions.
A: Gastric polyp; B: Gastric ulcer; C: Gastric submucosal mass; D: Gastric diverticulum; E: Small bowel polyp; F: Small bowel ulcer; G: Intestinal lymphangiectasia; H: Intestinal vascular malformation.
- Citation: Zhu JH, Liu X, Zhou W, Xu XN, Sheng WD, Han YL, Qiu XO, Liu YW, Qian YY, Liao Z, Li ZS. Carbonated soft drink for gastric preparation for magnetically controlled capsule endoscopy: An open-label randomized controlled trial. World J Gastroenterol 2025; 31(24): 105823
- URL: https://www.wjgnet.com/1007-9327/full/v31/i24/105823.htm
- DOI: https://dx.doi.org/10.3748/wjg.v31.i24.105823


