Copyright
©The Author(s) 2025.
World J Gastroenterol. Jun 14, 2025; 31(22): 106937
Published online Jun 14, 2025. doi: 10.3748/wjg.v31.i22.106937
Published online Jun 14, 2025. doi: 10.3748/wjg.v31.i22.106937
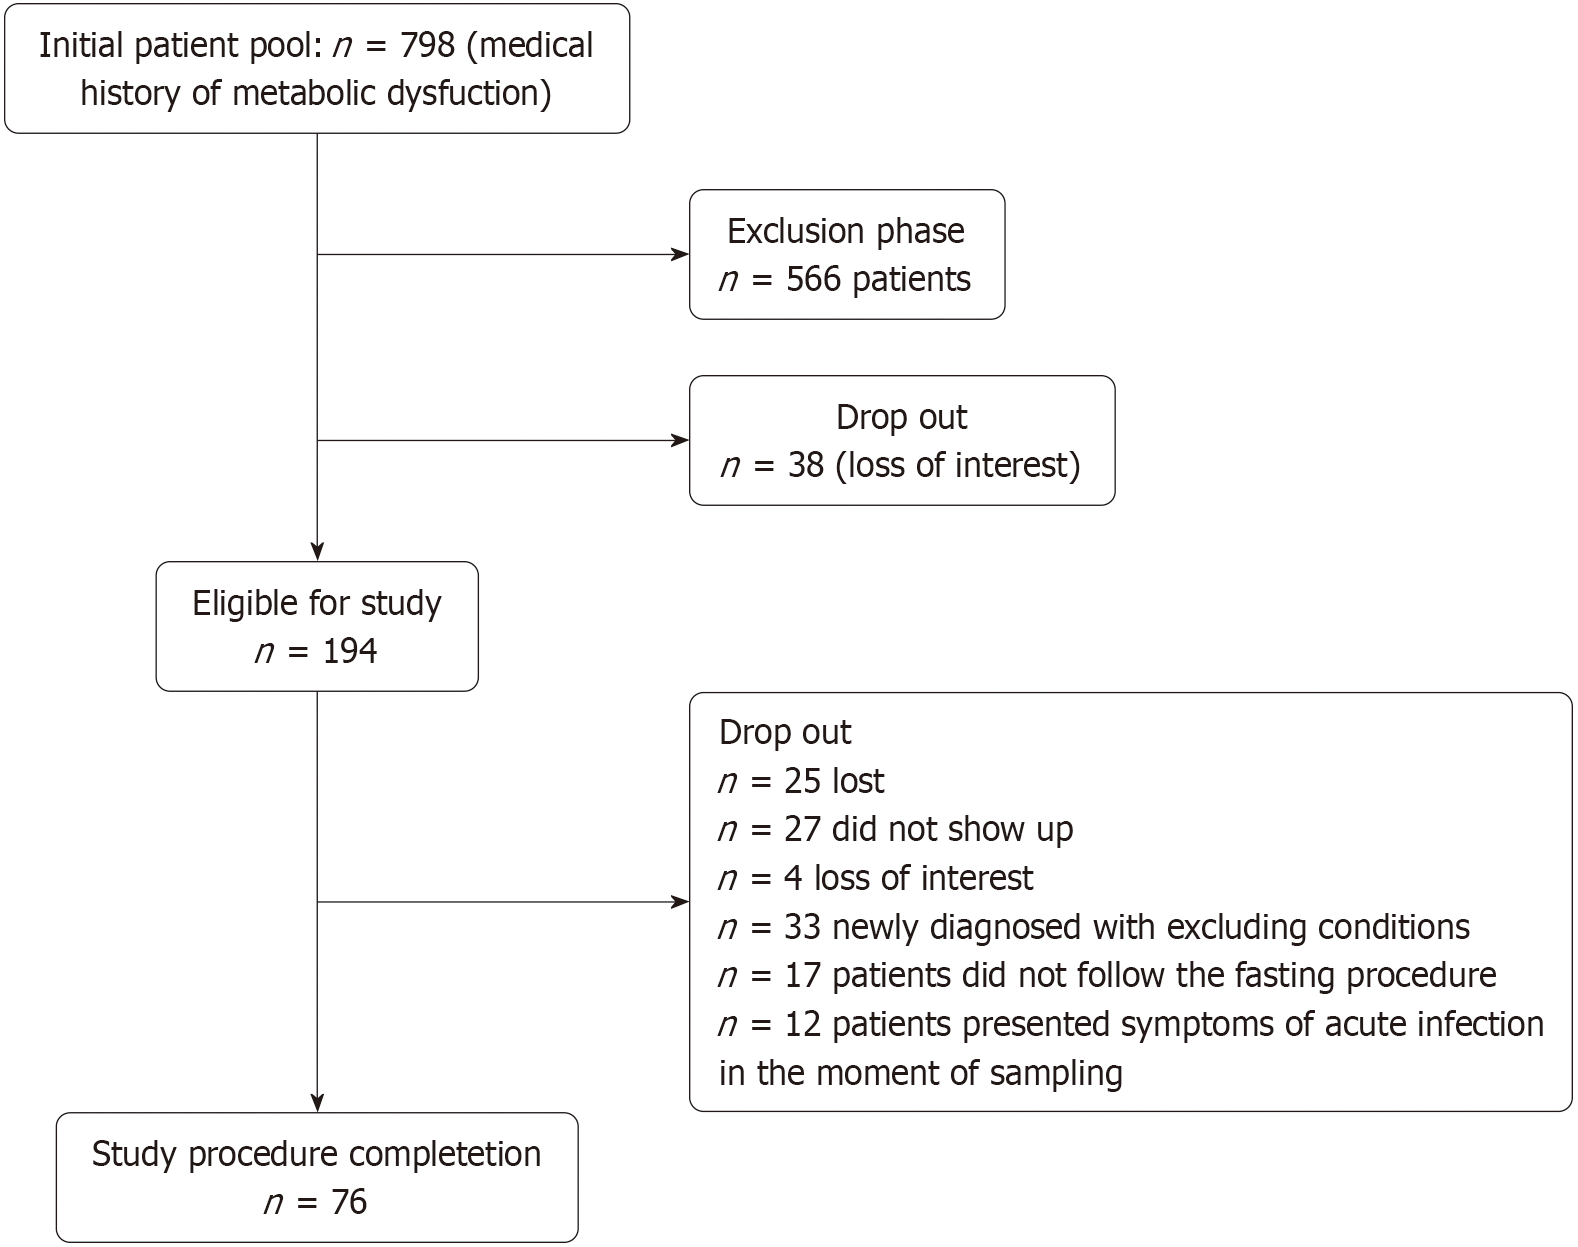
Figure 1 Flowchart of study participants.
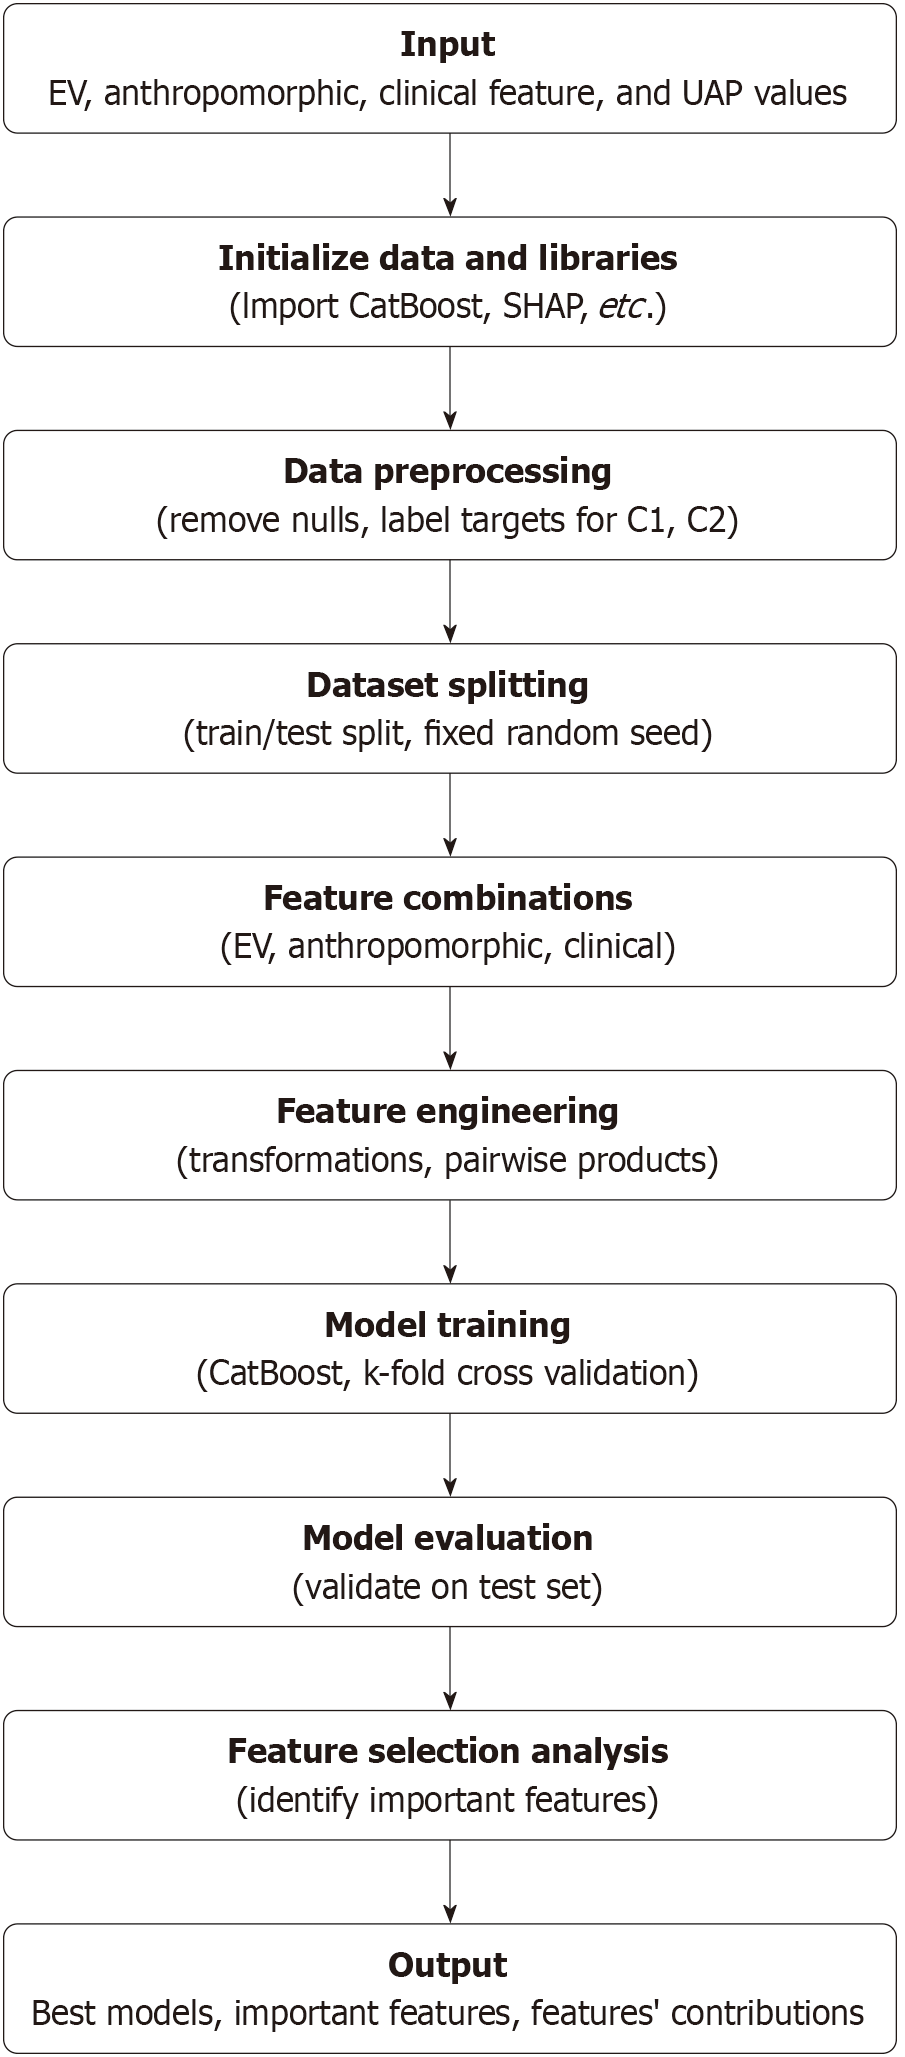
Figure 2 Flowchart of the algorithm.
EV: Extracellular vesicle; UAP: Ultrasound Attenuation Parameter; SHAP: SHapley Additive exPlanations; C1: Case 1; C2: Case 2.
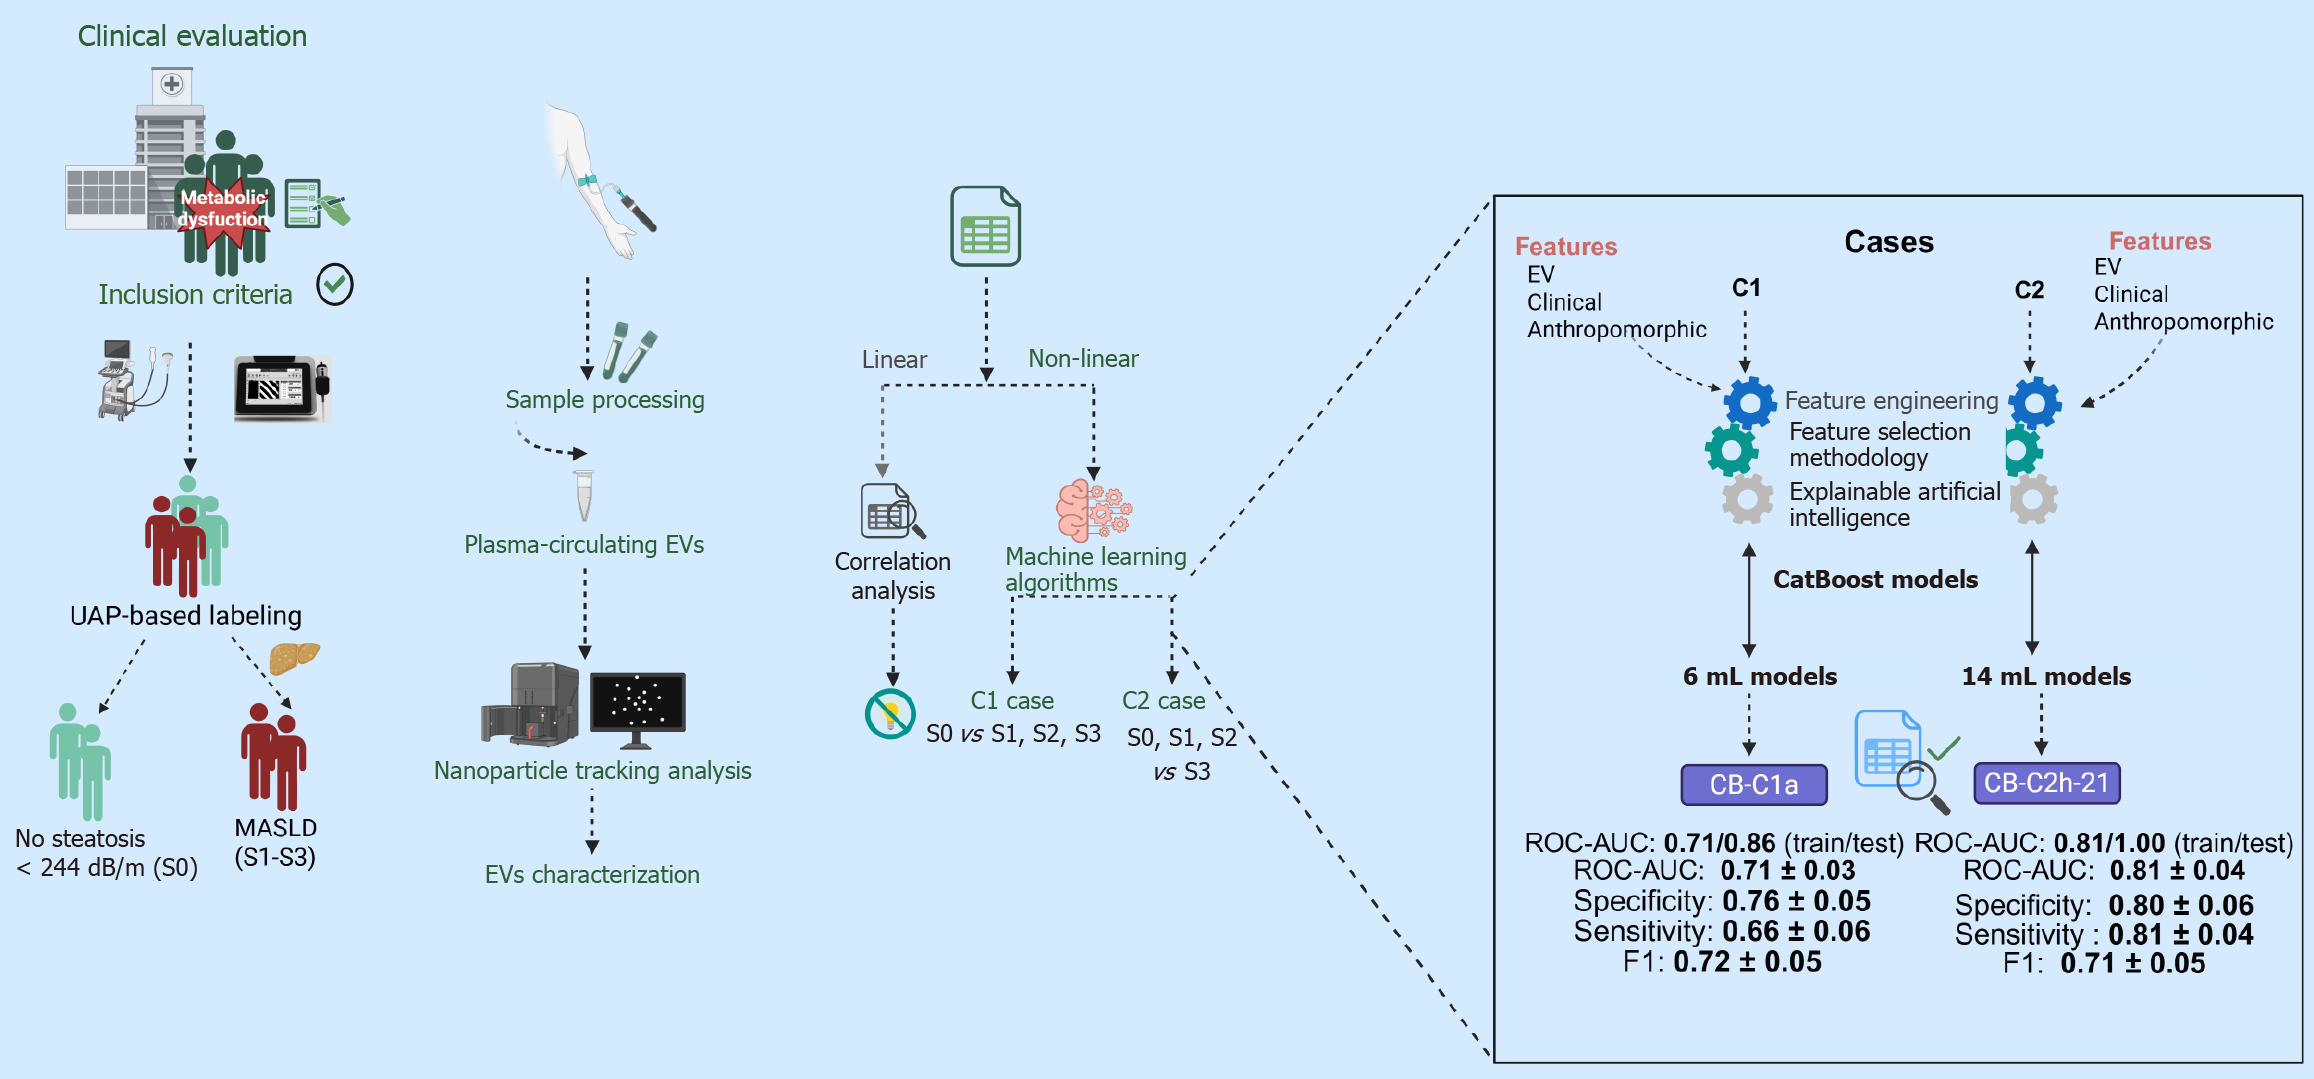
Figure 3 Graphical abstract.
MASLD: Metabolic dysfunction-associated steatotic liver disease; EVs: Extracellular vesicles; ROC-AUC: Receiver operating characteristic-area under the curve; C1: Case 1; C2: Case 2; UAP: Ultrasound Attenuation Parameter; ML: Machine learning. Created in BioRender (Supplementary material).
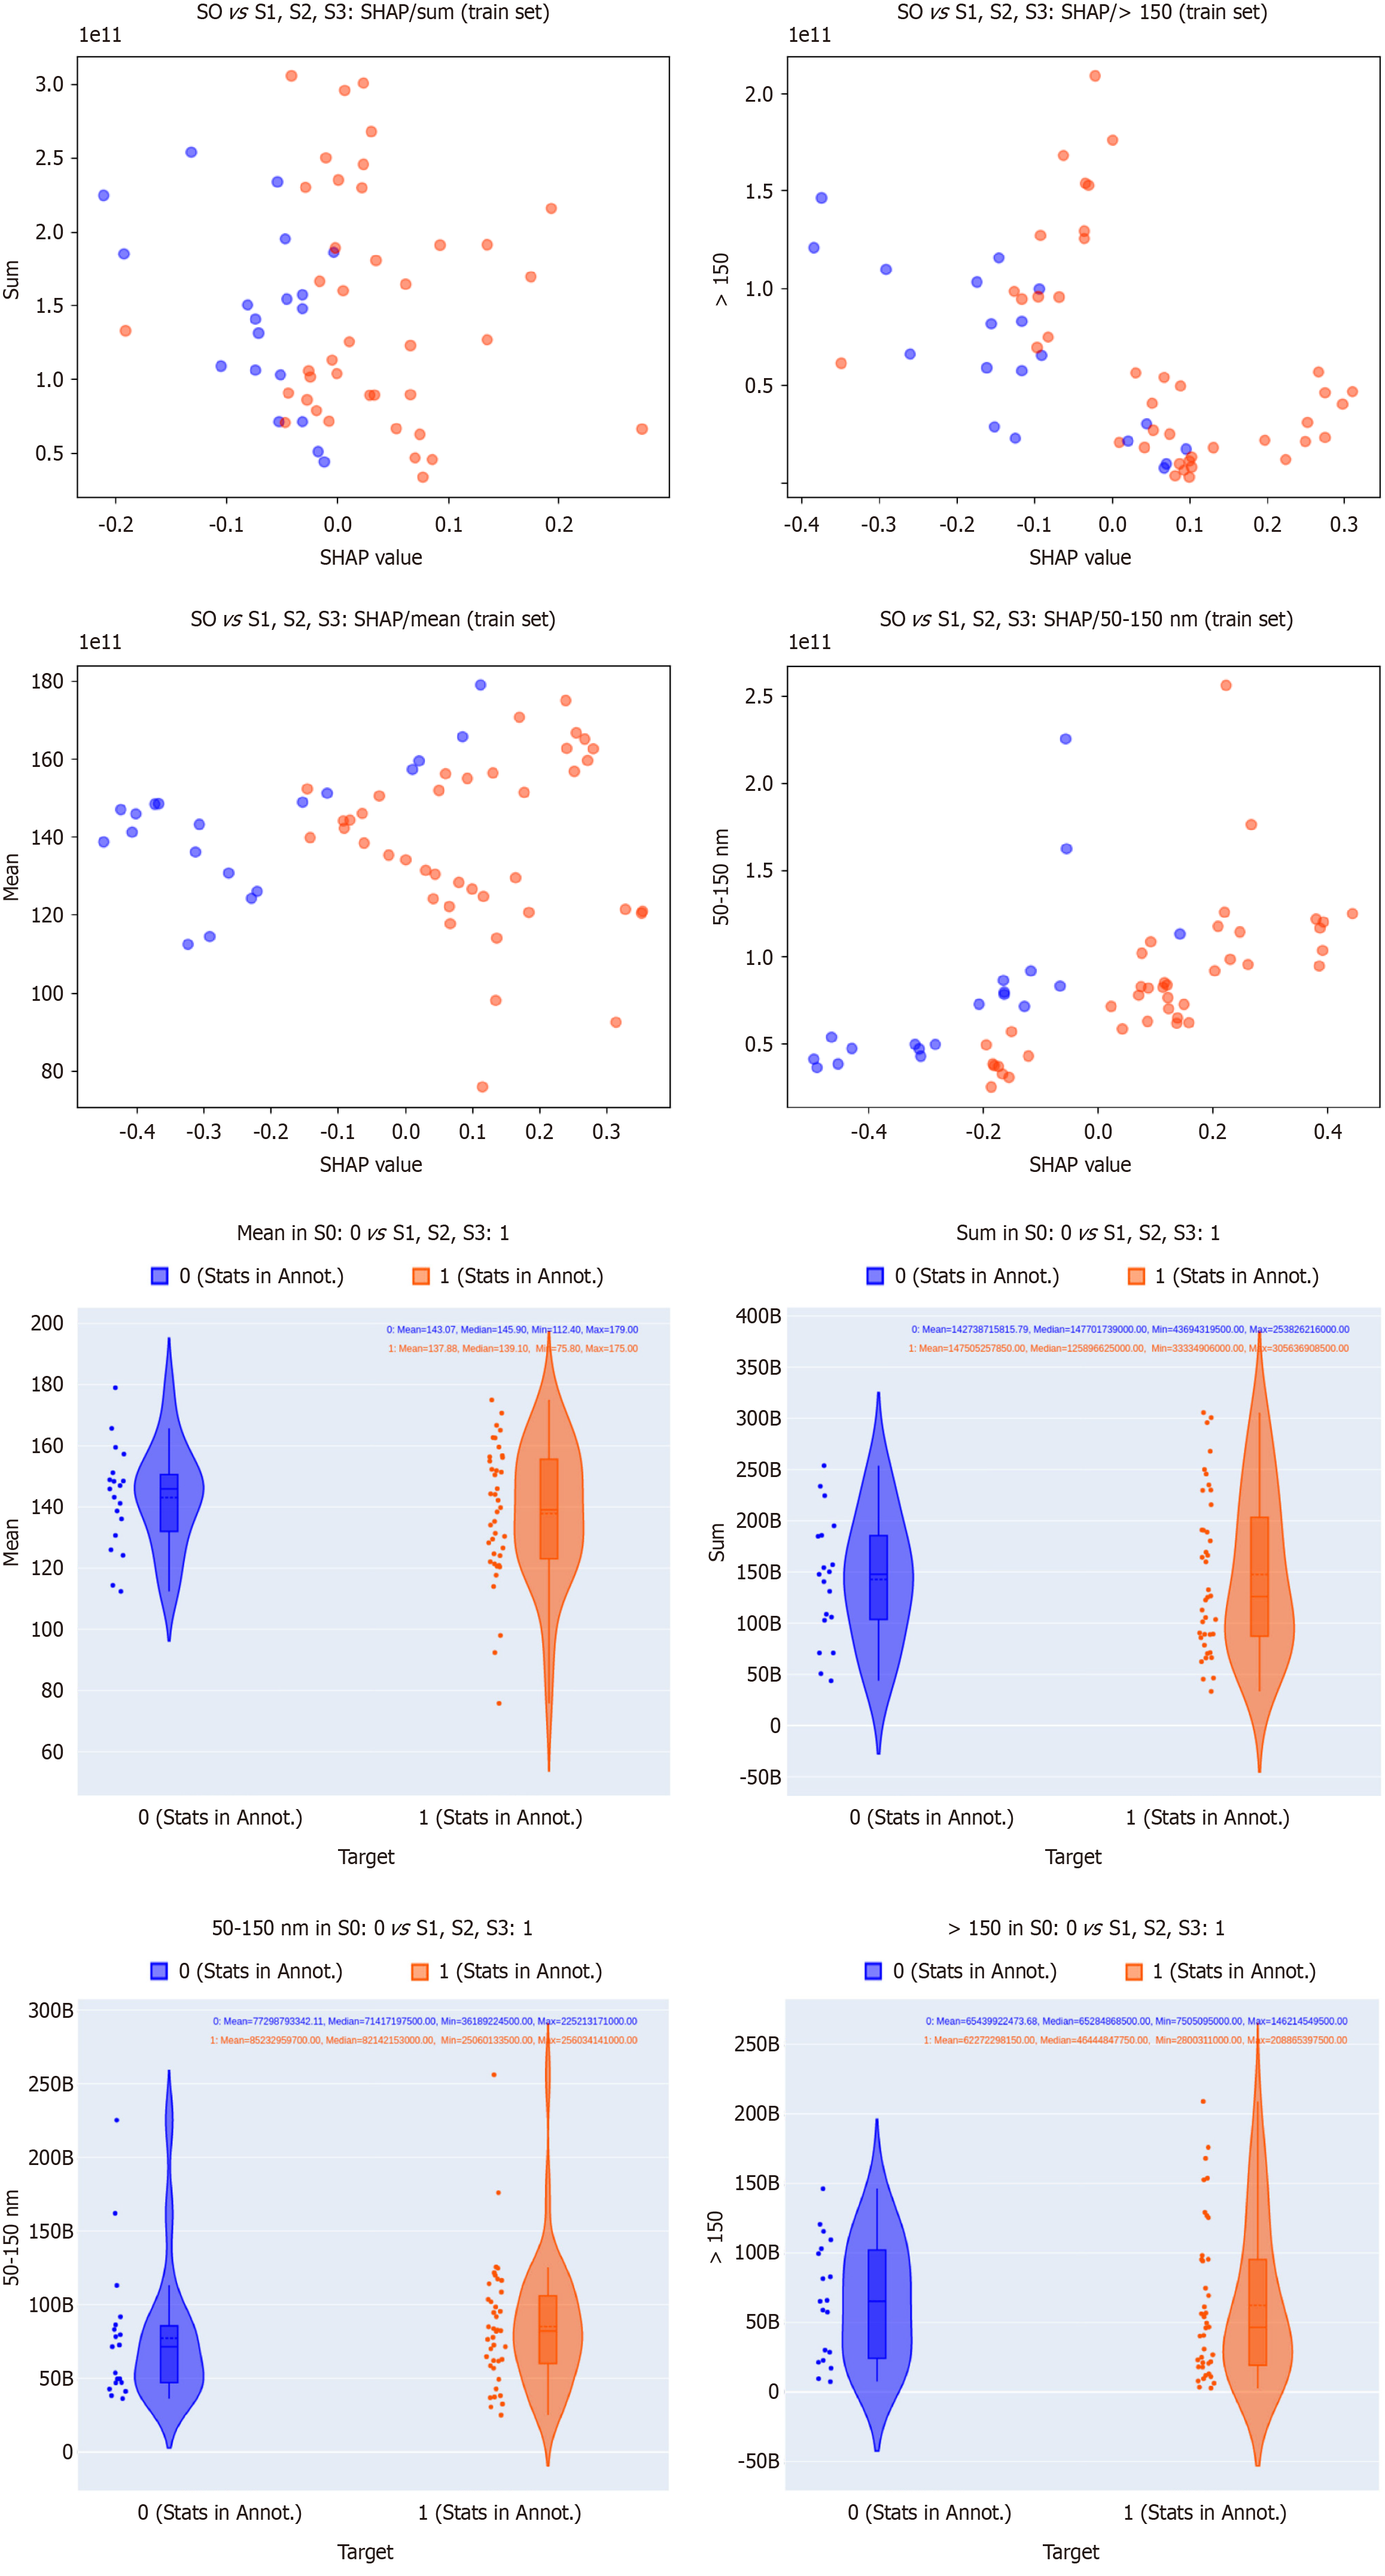
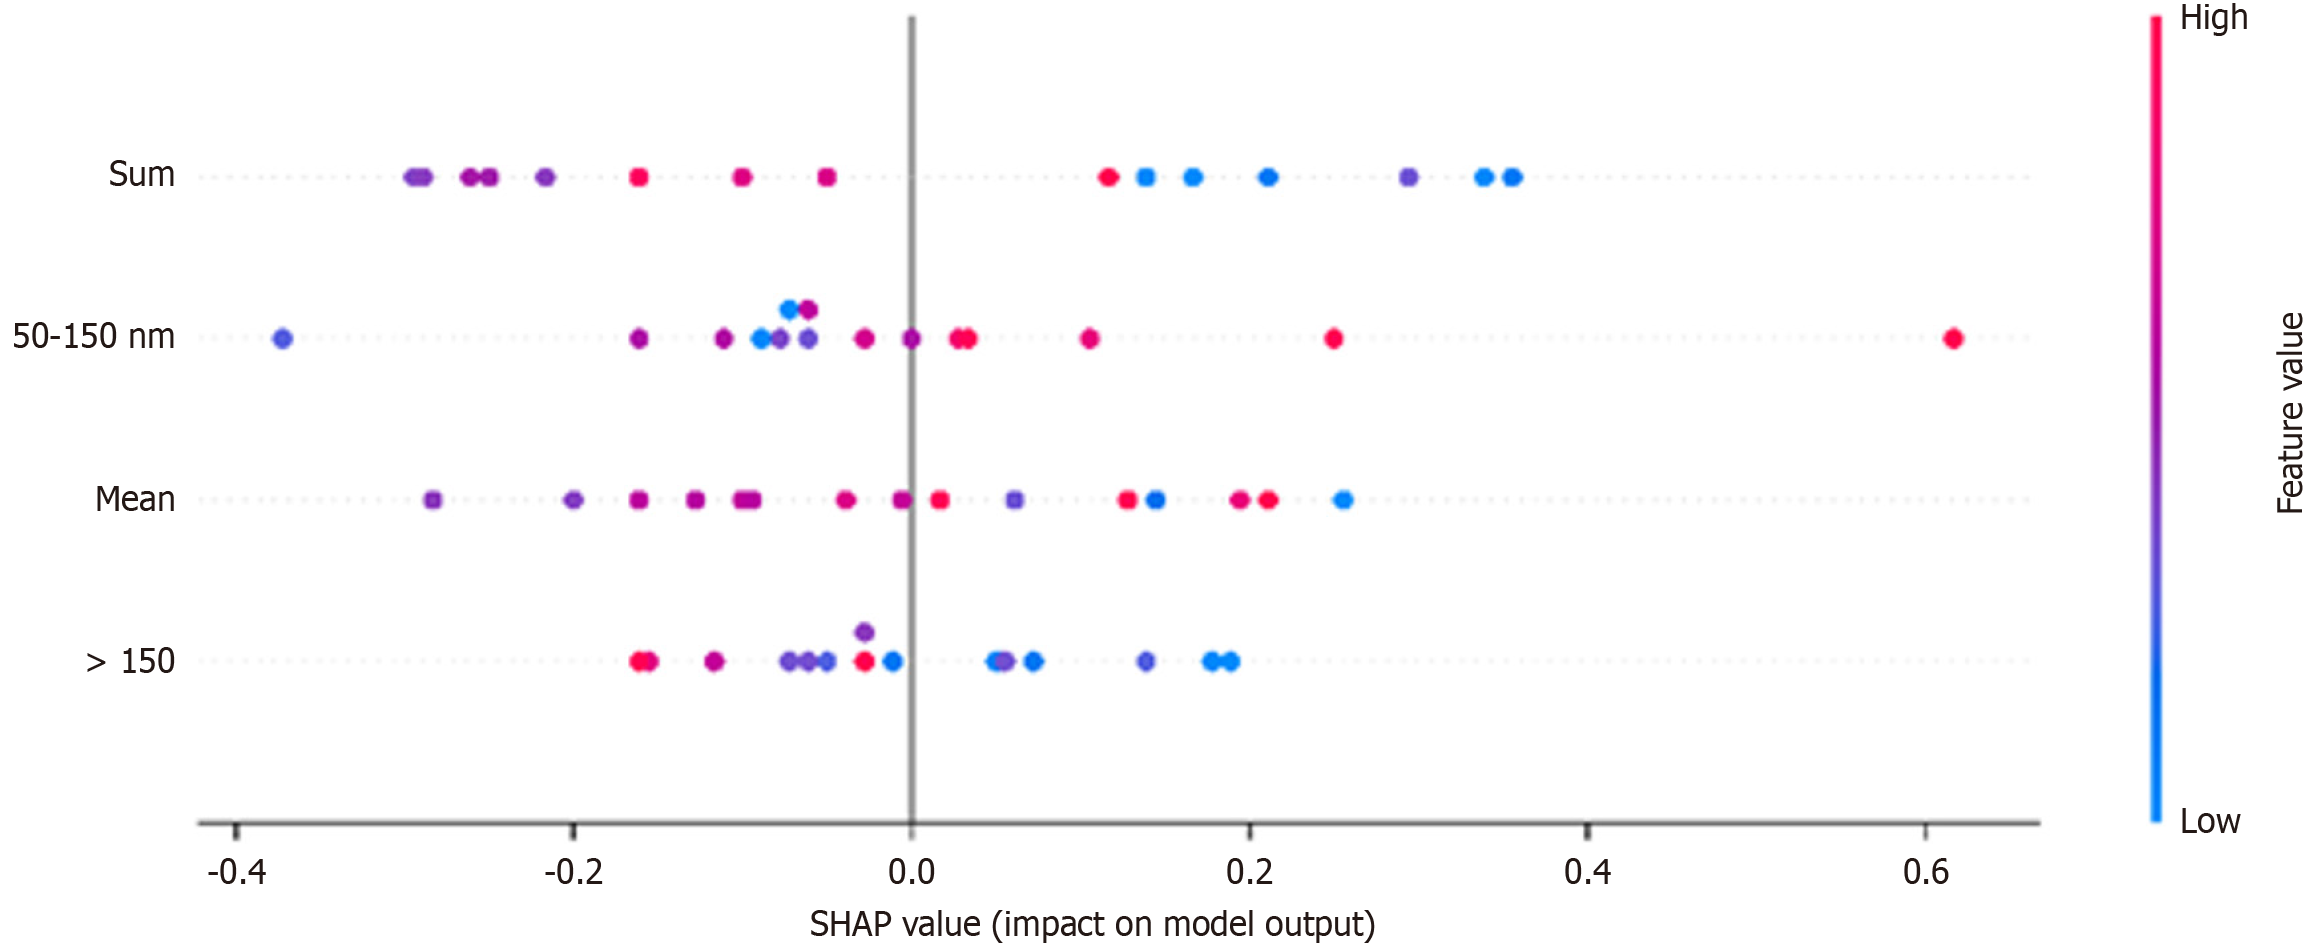
Figure 4 Explainable artificial intelligence SHapley Additive exPlanations for case 1.
Plots of SHapley Additive exPlanations scatter plots and extracellular vesicle distribution for the train set of the machine learning CB-C1a model. SHAP: SHapley Additive exPlanations.
Figure 5 Each dot represents an individual data point, with the x-axis denoting the SHapley Additive exPlanations value (impact on model output) and the color gradient indicating feature values (blue for low values, red for high values).
The Sum feature showed the strongest influence, with higher values correlating with positive SHapley Additive exPlanations values, indicating its critical role in predicting steatosis stages. The beeswarm distribution highlights the non-linear and complex relationships between features and predictions, emphasizing the importance of explainable artificial intelligence in interpreting the contributions of extracellular vesicle characteristics in diagnosing metabolic dysfunction-associated steatotic liver disease. SHAP: SHapley Additive exPlanations.
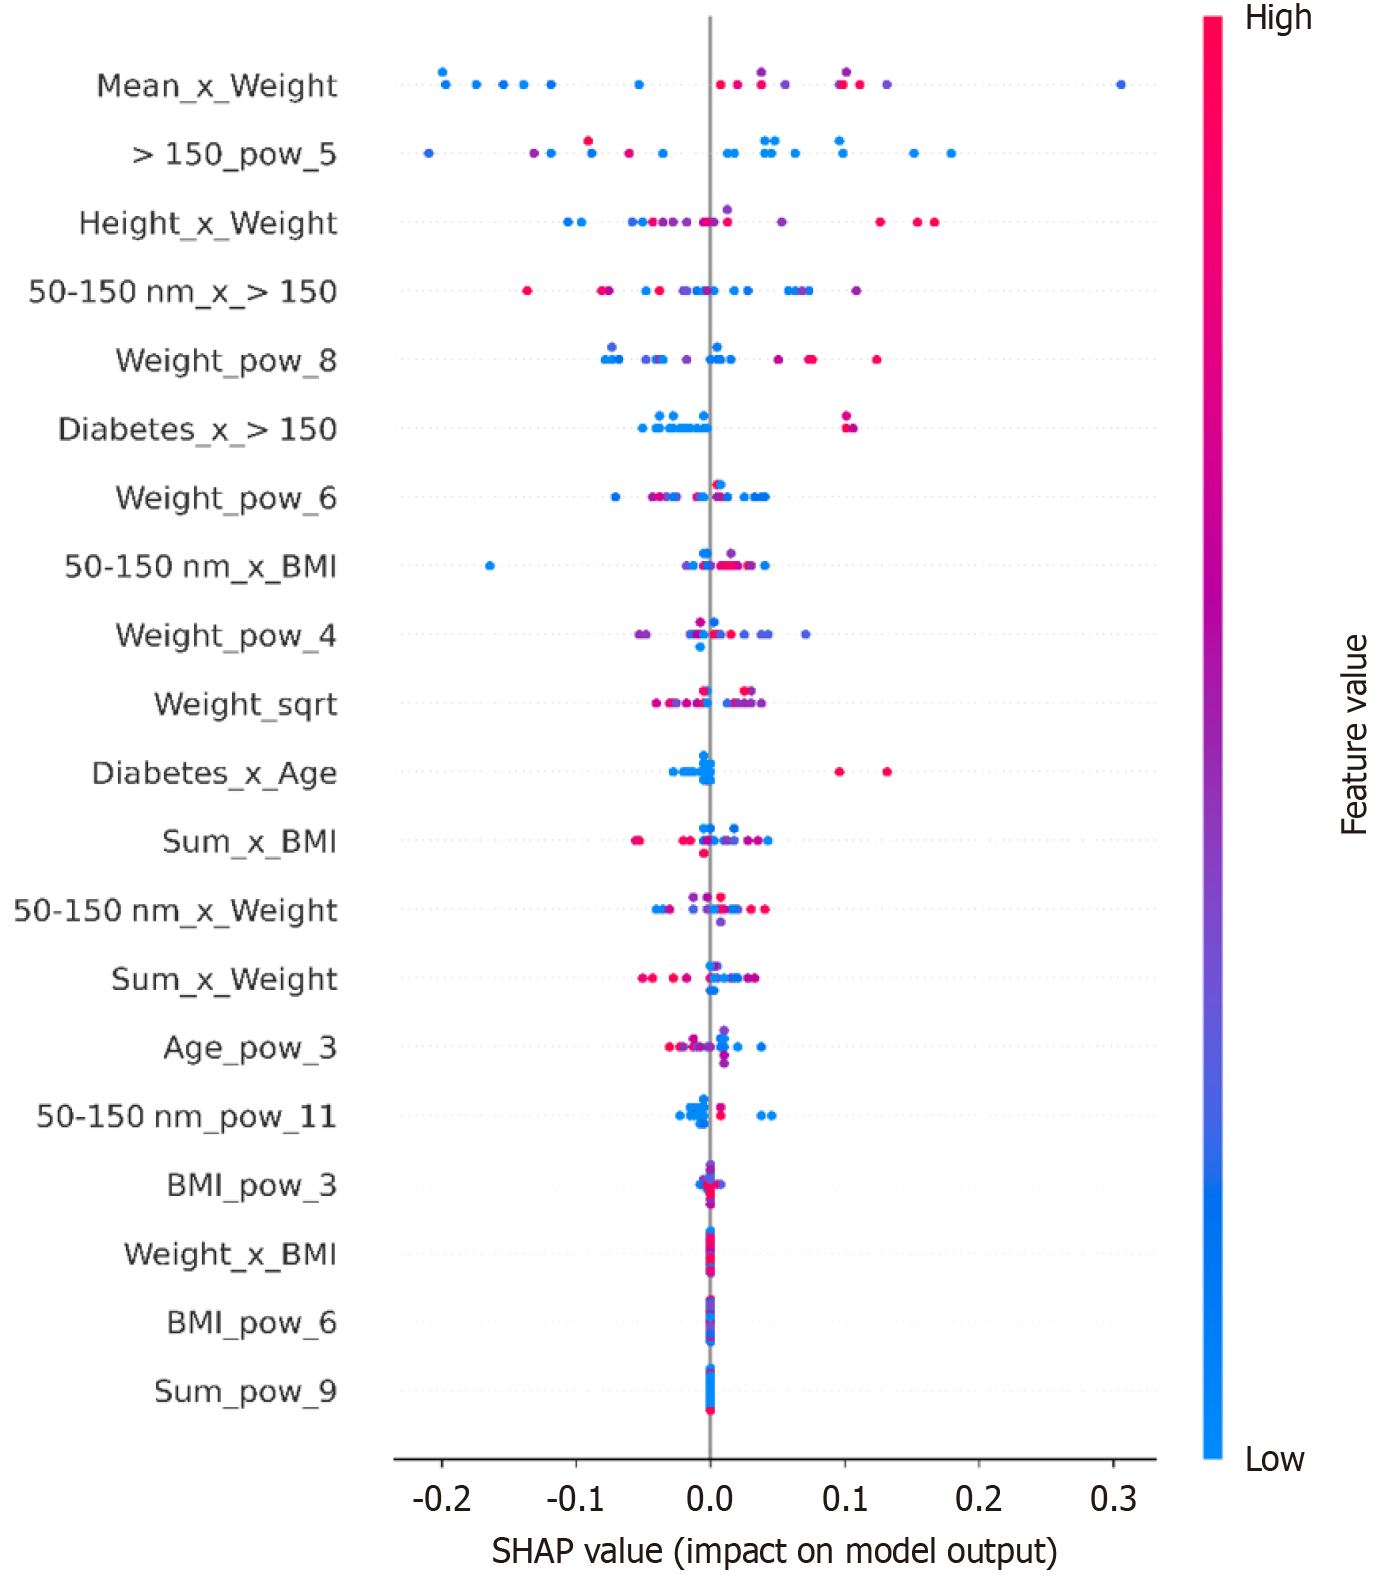
Figure 6 Each dot represents an individual prediction, with the X-axis denoting the SHapley Additive exPlanations value (impact on model output), while the color gradient indicates the feature value (blue for low values, red for high values).
Features such as > 150_pow_5, Height_x_Weight, and Sum_x_BMI also significantly contribute to the predictive capability of the model, showcasing complex interactions between anthropometric, clinical, and extracellular vesicle features. In Supplementary Table 2 we demonstrate the information regarding all the machine learning models of C2 and in Table 3 performances on the CB-C1a and CB-C2h-21, using ten times iterative 5CV and 3CV for C1 and C2, respectively. SHAP: SHapley Additive exPlanations; BMI: Body mass index.
Figure 7 Explainable artificial intelligence SHapley Additive exPlanations C2.
A: Plots of SHapley Additive exPlanations scatter plots; B: Extracellular vesicle distribution for the training set of the machine learning CB-C2h-21 model. SHAP: SHapley Additive exPlanations; BMI: Body mass index.
- Citation: Trifylli EM, Angelakis A, Kriebardis AG, Papadopoulos N, Fortis SP, Pantazatou V, Koskinas J, Kranidioti H, Koustas E, Sarantis P, Manolakopoulos S, Deutsch M. Extracellular vesicles as biomarkers for metabolic dysfunction-associated steatotic liver disease staging using explainable artificial intelligence. World J Gastroenterol 2025; 31(22): 106937
- URL: https://www.wjgnet.com/1007-9327/full/v31/i22/106937.htm
- DOI: https://dx.doi.org/10.3748/wjg.v31.i22.106937


