Copyright
©The Author(s) 2025.
World J Gastroenterol. Jun 14, 2025; 31(22): 106937
Published online Jun 14, 2025. doi: 10.3748/wjg.v31.i22.106937
Published online Jun 14, 2025. doi: 10.3748/wjg.v31.i22.106937
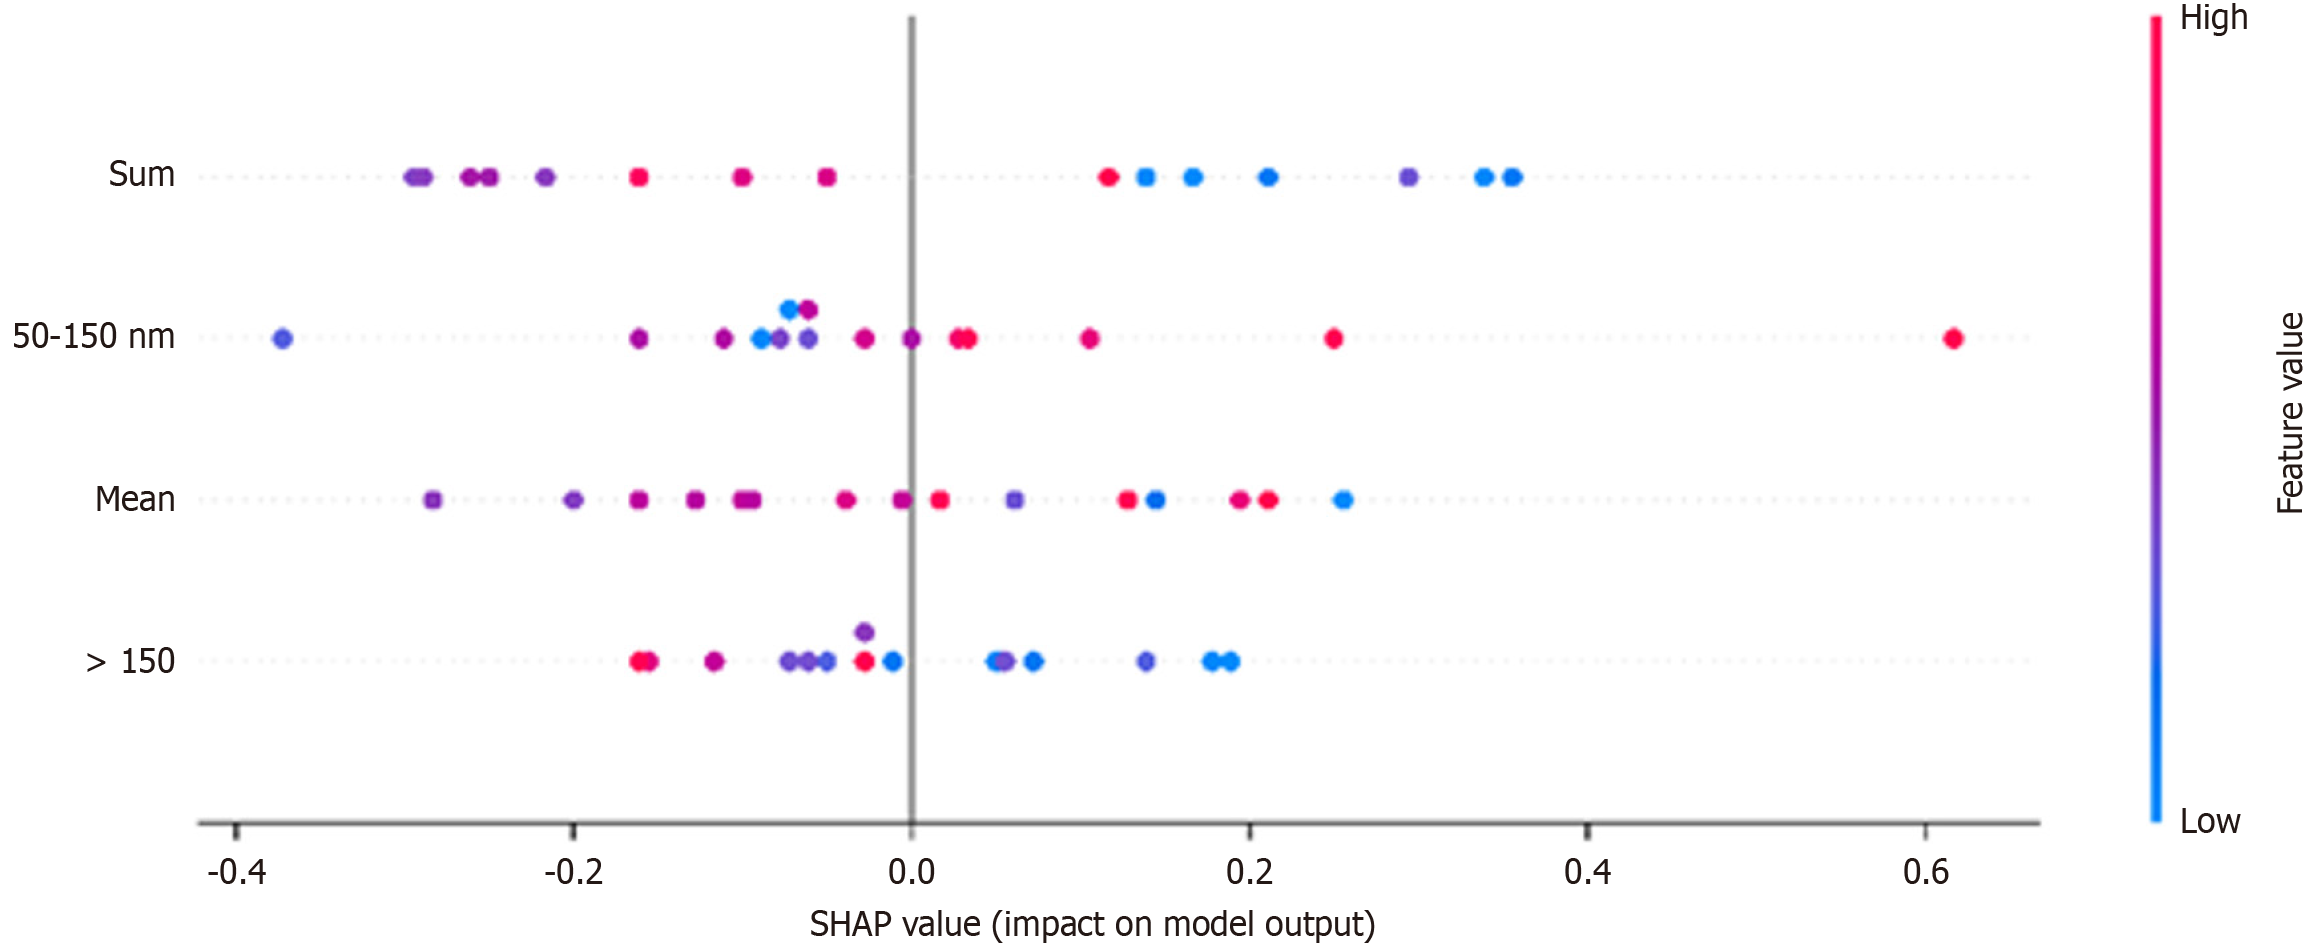
Figure 5 Each dot represents an individual data point, with the x-axis denoting the SHapley Additive exPlanations value (impact on model output) and the color gradient indicating feature values (blue for low values, red for high values).
The Sum feature showed the strongest influence, with higher values correlating with positive SHapley Additive exPlanations values, indicating its critical role in predicting steatosis stages. The beeswarm distribution highlights the non-linear and complex relationships between features and predictions, emphasizing the importance of explainable artificial intelligence in interpreting the contributions of extracellular vesicle characteristics in diagnosing metabolic dysfunction-associated steatotic liver disease. SHAP: SHapley Additive exPlanations.
- Citation: Trifylli EM, Angelakis A, Kriebardis AG, Papadopoulos N, Fortis SP, Pantazatou V, Koskinas J, Kranidioti H, Koustas E, Sarantis P, Manolakopoulos S, Deutsch M. Extracellular vesicles as biomarkers for metabolic dysfunction-associated steatotic liver disease staging using explainable artificial intelligence. World J Gastroenterol 2025; 31(22): 106937
- URL: https://www.wjgnet.com/1007-9327/full/v31/i22/106937.htm
- DOI: https://dx.doi.org/10.3748/wjg.v31.i22.106937


