Copyright
©The Author(s) 2025.
World J Gastroenterol. Jun 7, 2025; 31(21): 107029
Published online Jun 7, 2025. doi: 10.3748/wjg.v31.i21.107029
Published online Jun 7, 2025. doi: 10.3748/wjg.v31.i21.107029
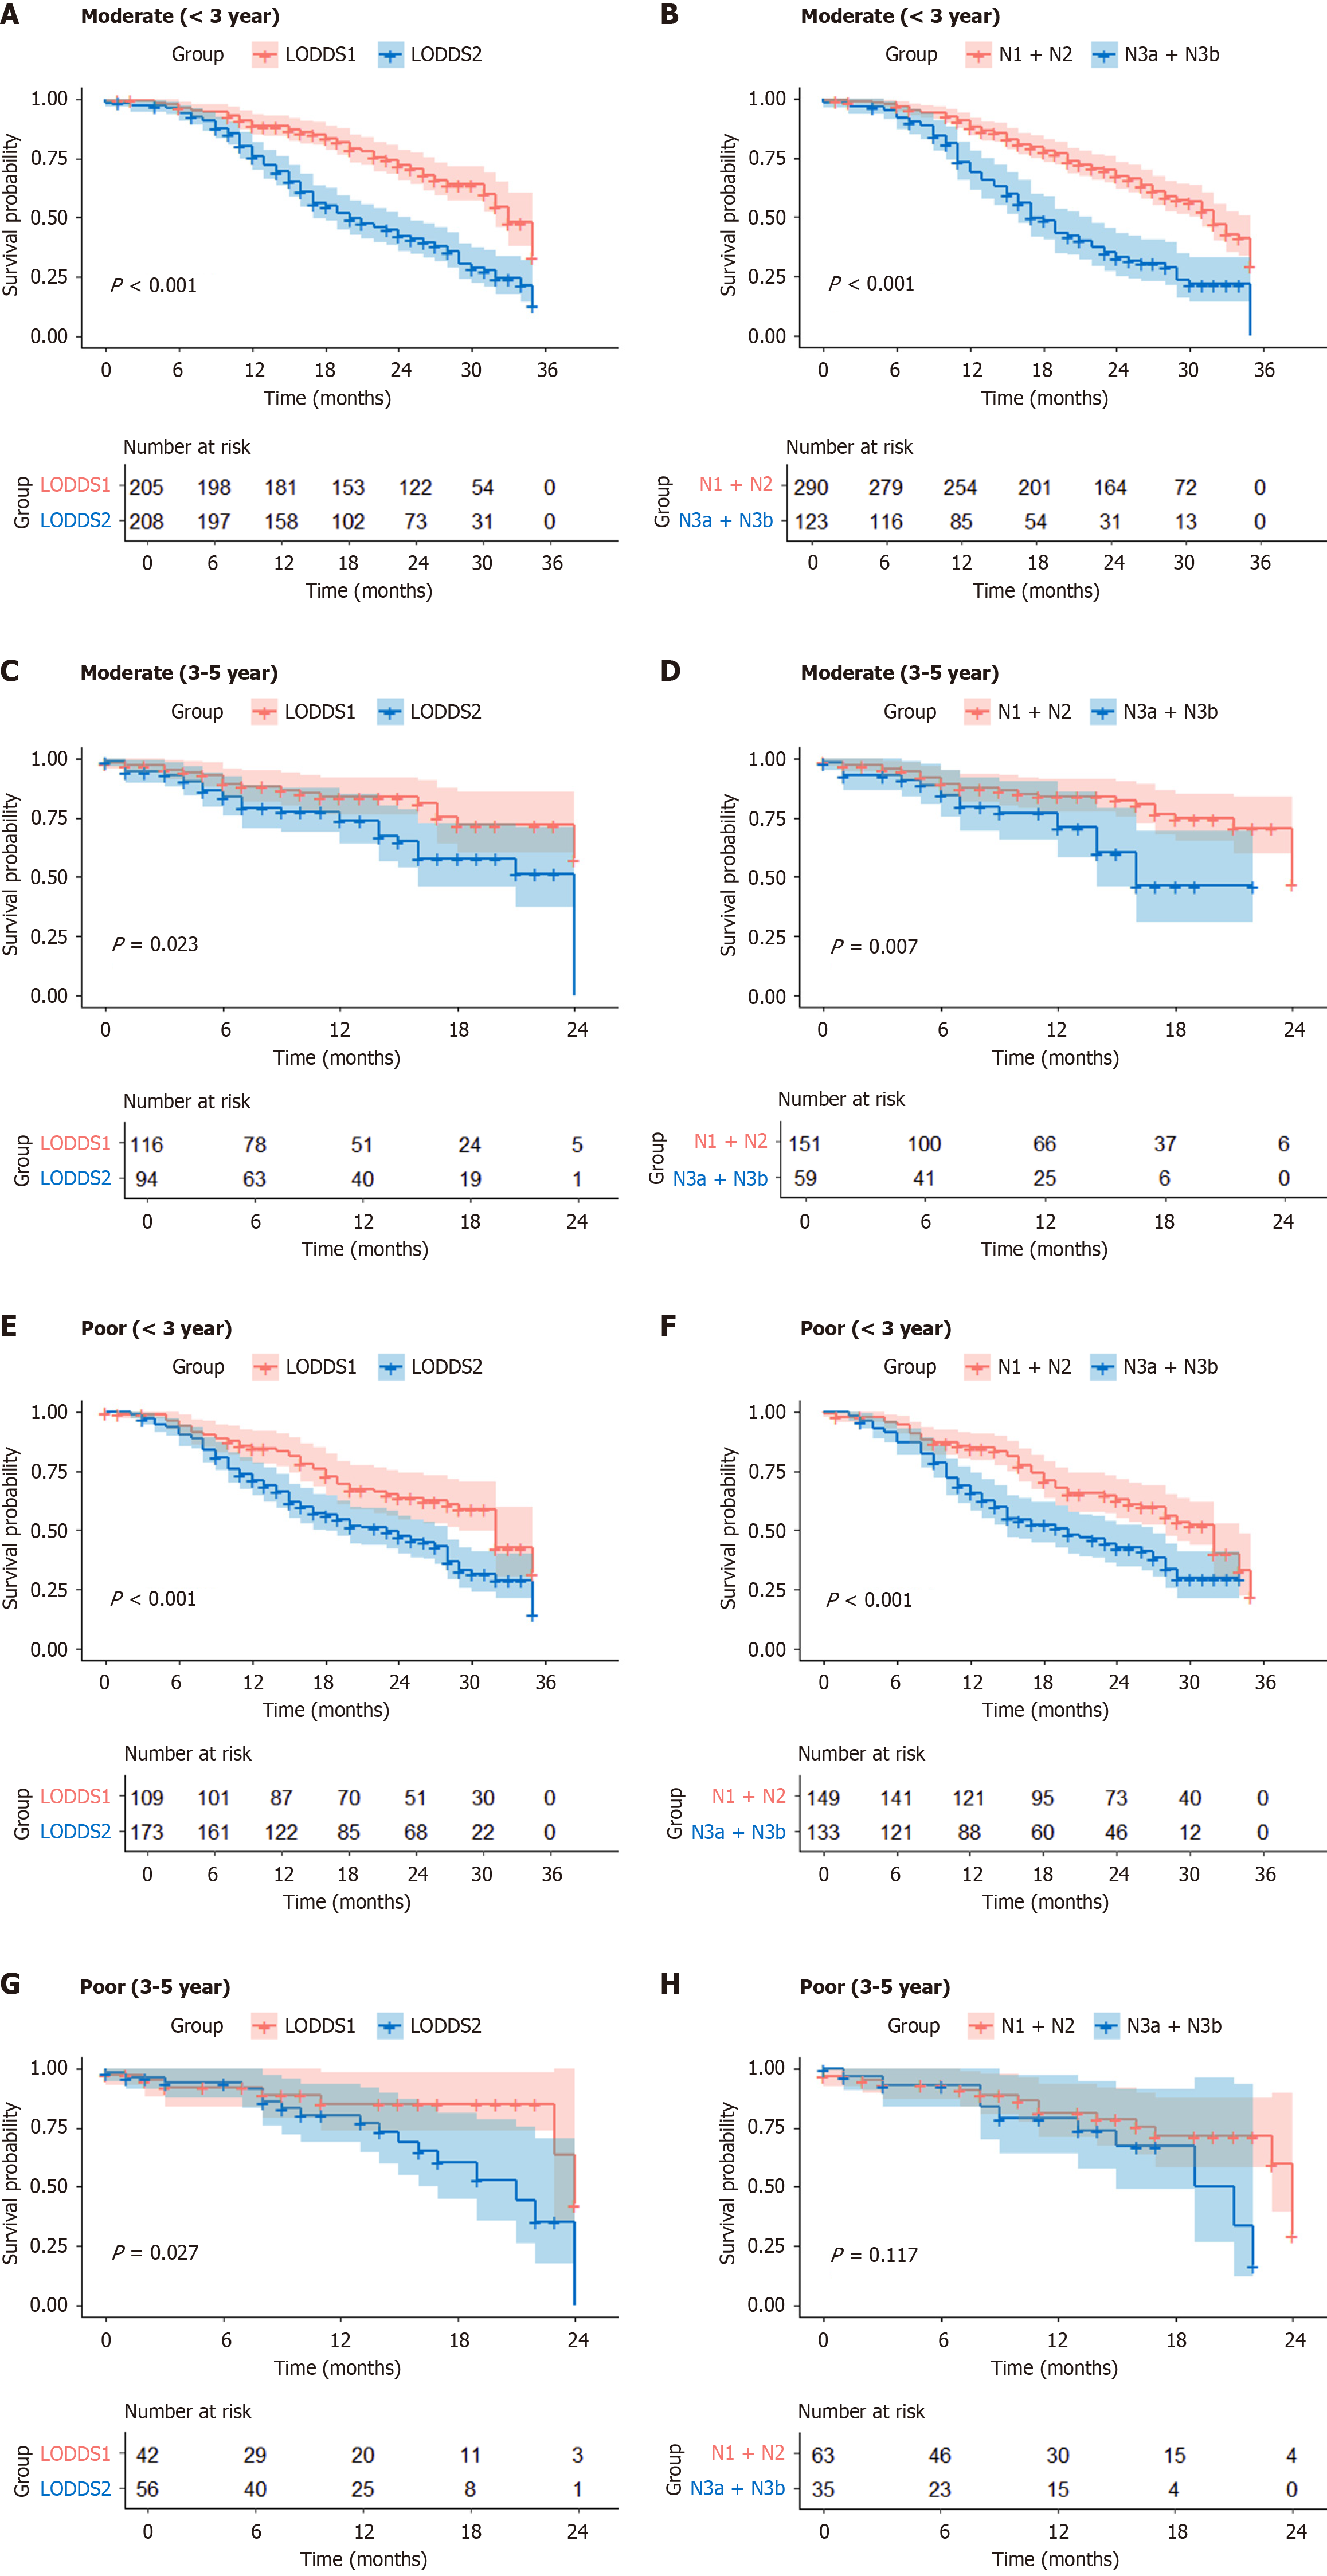
Figure 1 Kaplan–Meier survival analysis after propensity score matching.
A: Moderately differentiated gastric cancer (GC) patients 3 years postoperatively log odds of positive lymph nodes (LODDS) 1 vs LODDS2; B: Moderately differentiated GC patients 3 years postoperatively N1 + N2 vs N3a + N3b; C: Moderately differentiated GC patients 3-5 years postoperatively LODDS1 vs LODDS2; D: Moderately differentiated GC patients 3-5 years postoperatively N1 + N2 vs N3a + N3b; E: Poorly differentiated GC patients 3 years postoperatively LODDS1 vs LODDS2; F: Poorly differentiated GC patients 3 years after surgery N1 + N2 vs N3a + N3b; G: Poorly differentiated GC patients 3-5 years after surgery LODDS1 vs LODDS2; H: Poorly differentiated GC patients 3-5 years after surgery N1 + N2 vs N3a + N3b. LODDS: Log odds of positive lymph nodes.
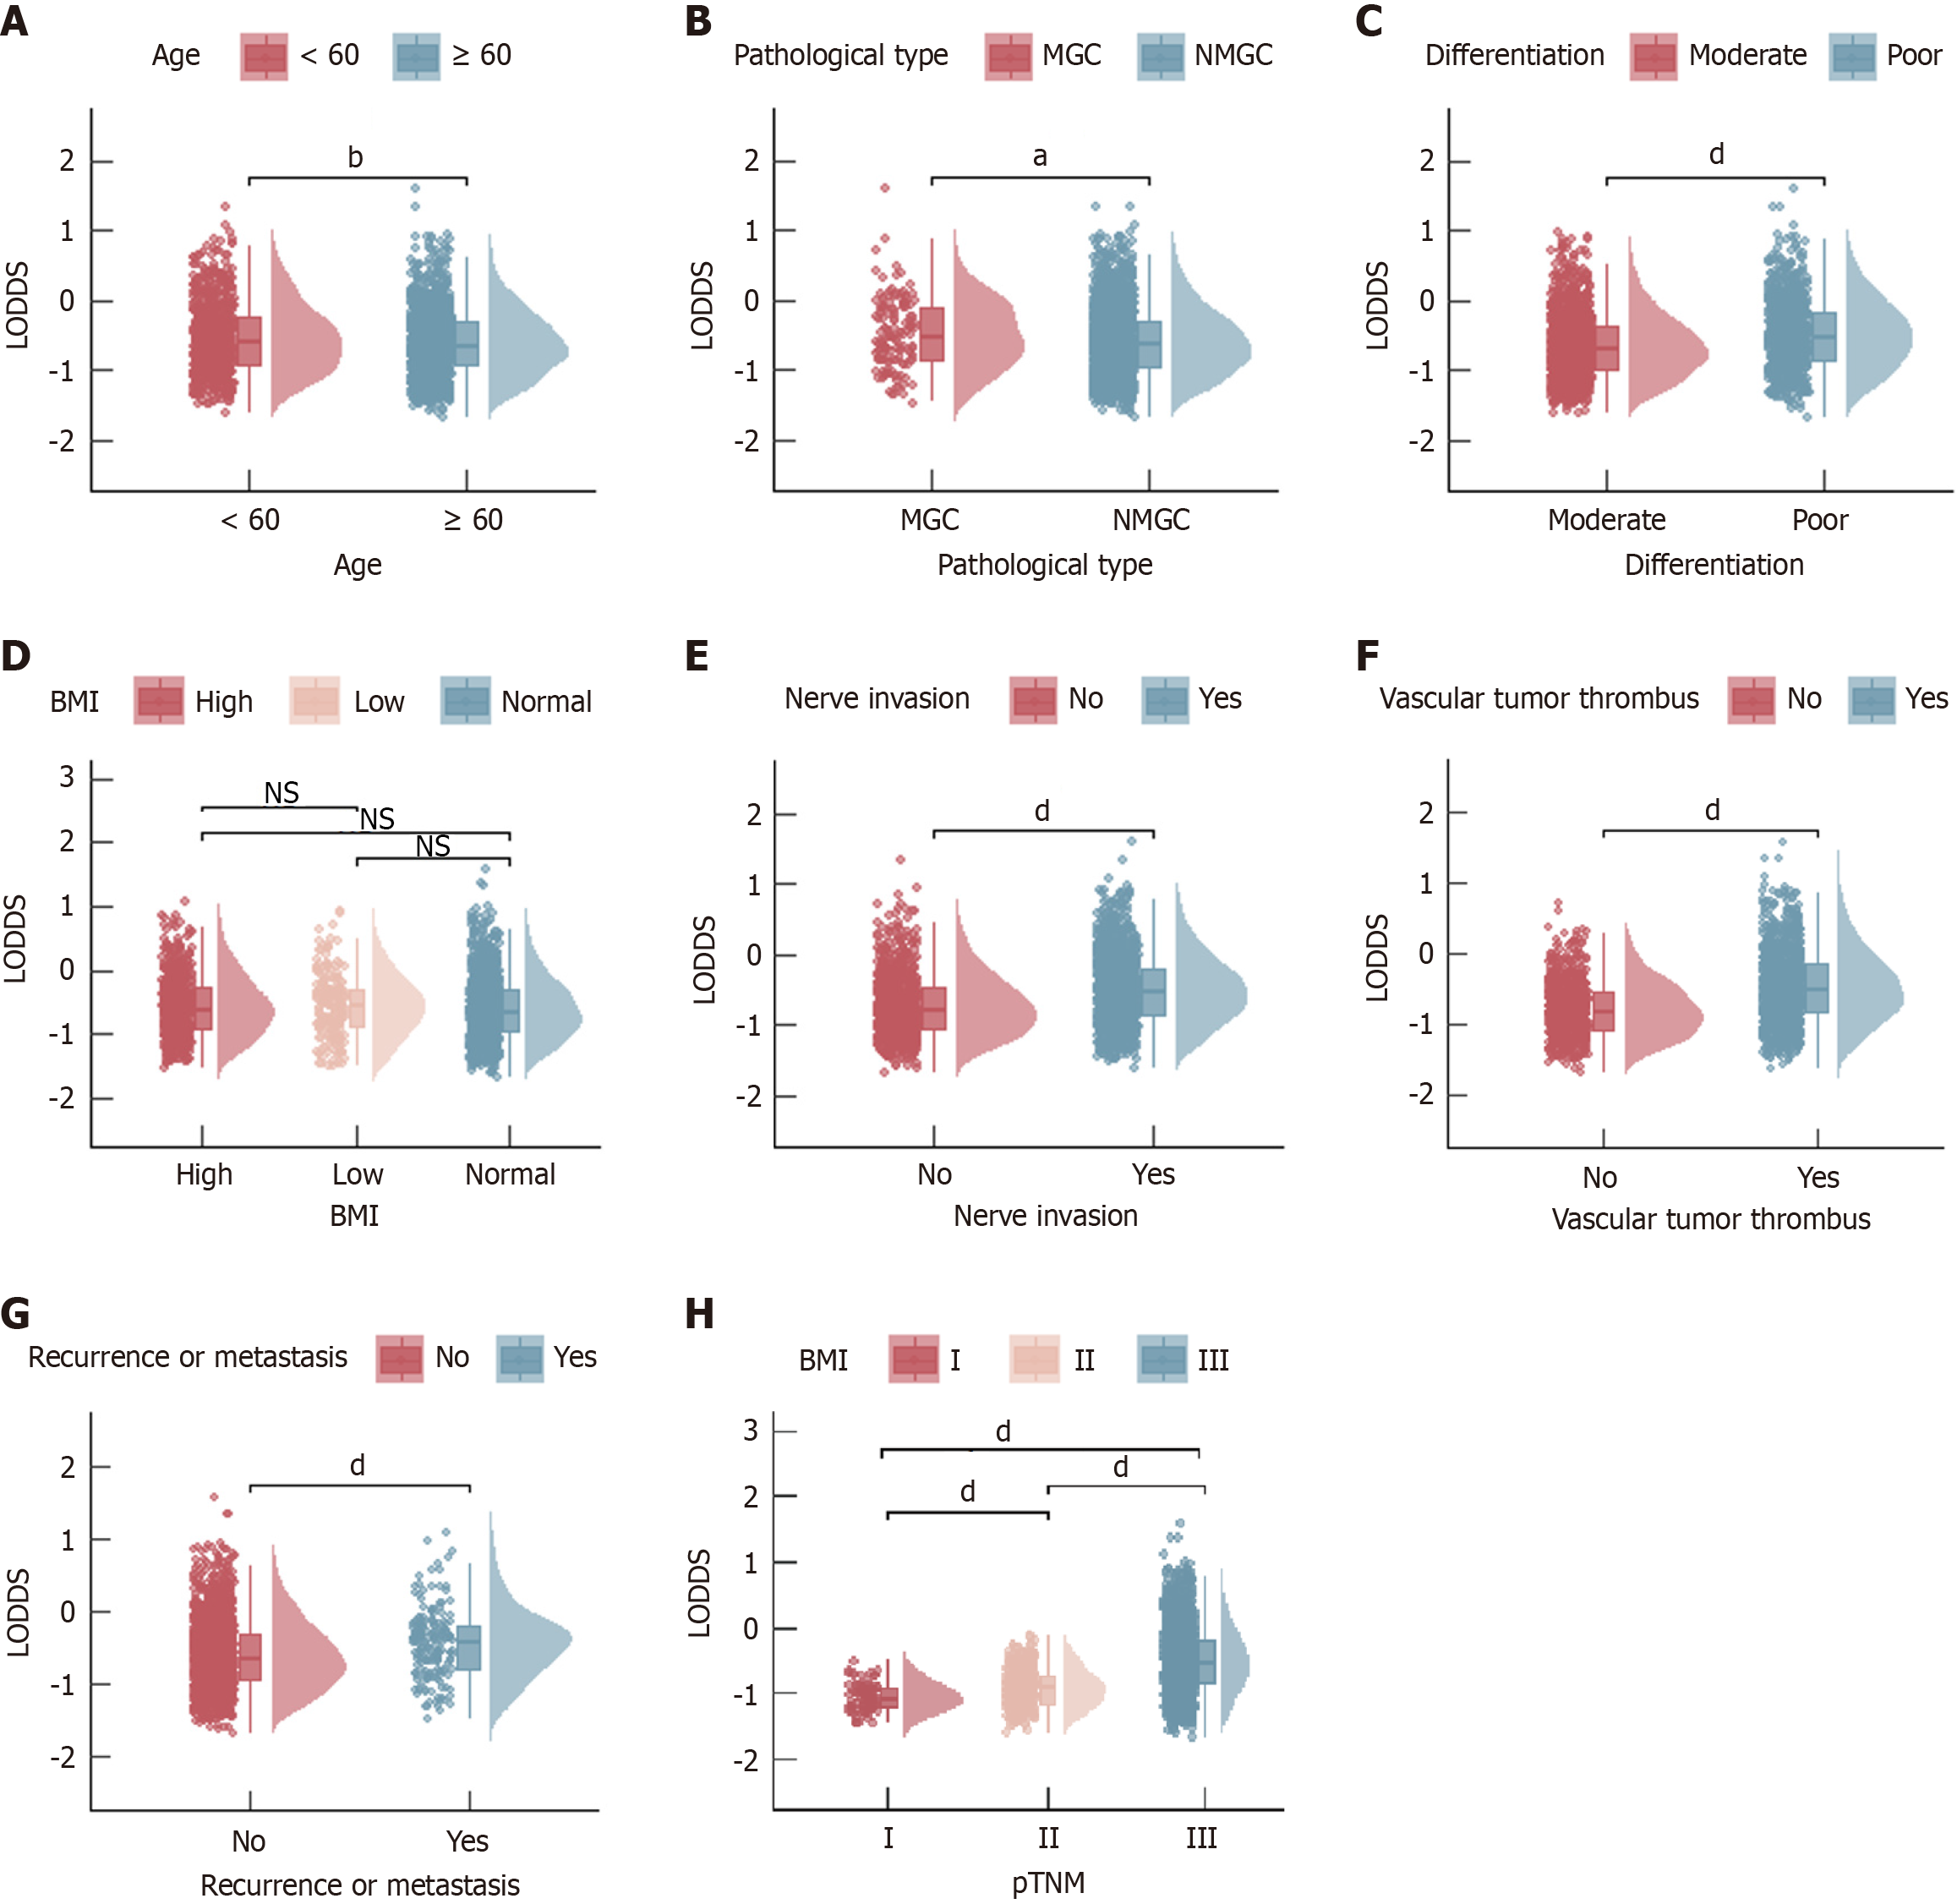
Figure 2 Box plots of the log odds of positive lymph nodes according to clinical features.
A: Age; B: Pathological type; C: Differentiation; D: Body mass index; E: Nerve invasion; F: Vascular tumor thrombus; G: Recurrence or metastasis; H: Pathological tumor-node-metastasis. aP < 0.05; bP < 0.01; cP < 0.005; dP < 0.001. LODDS: Log odds of positive lymph nodes; pTNM: Pathological tumor-node-metastasis; MGC: Mucinous gastric adenocarcinoma; NMGC: Non-mucinous gastric adenocarcinoma; BMI: Body mass index; ns: Not significant.
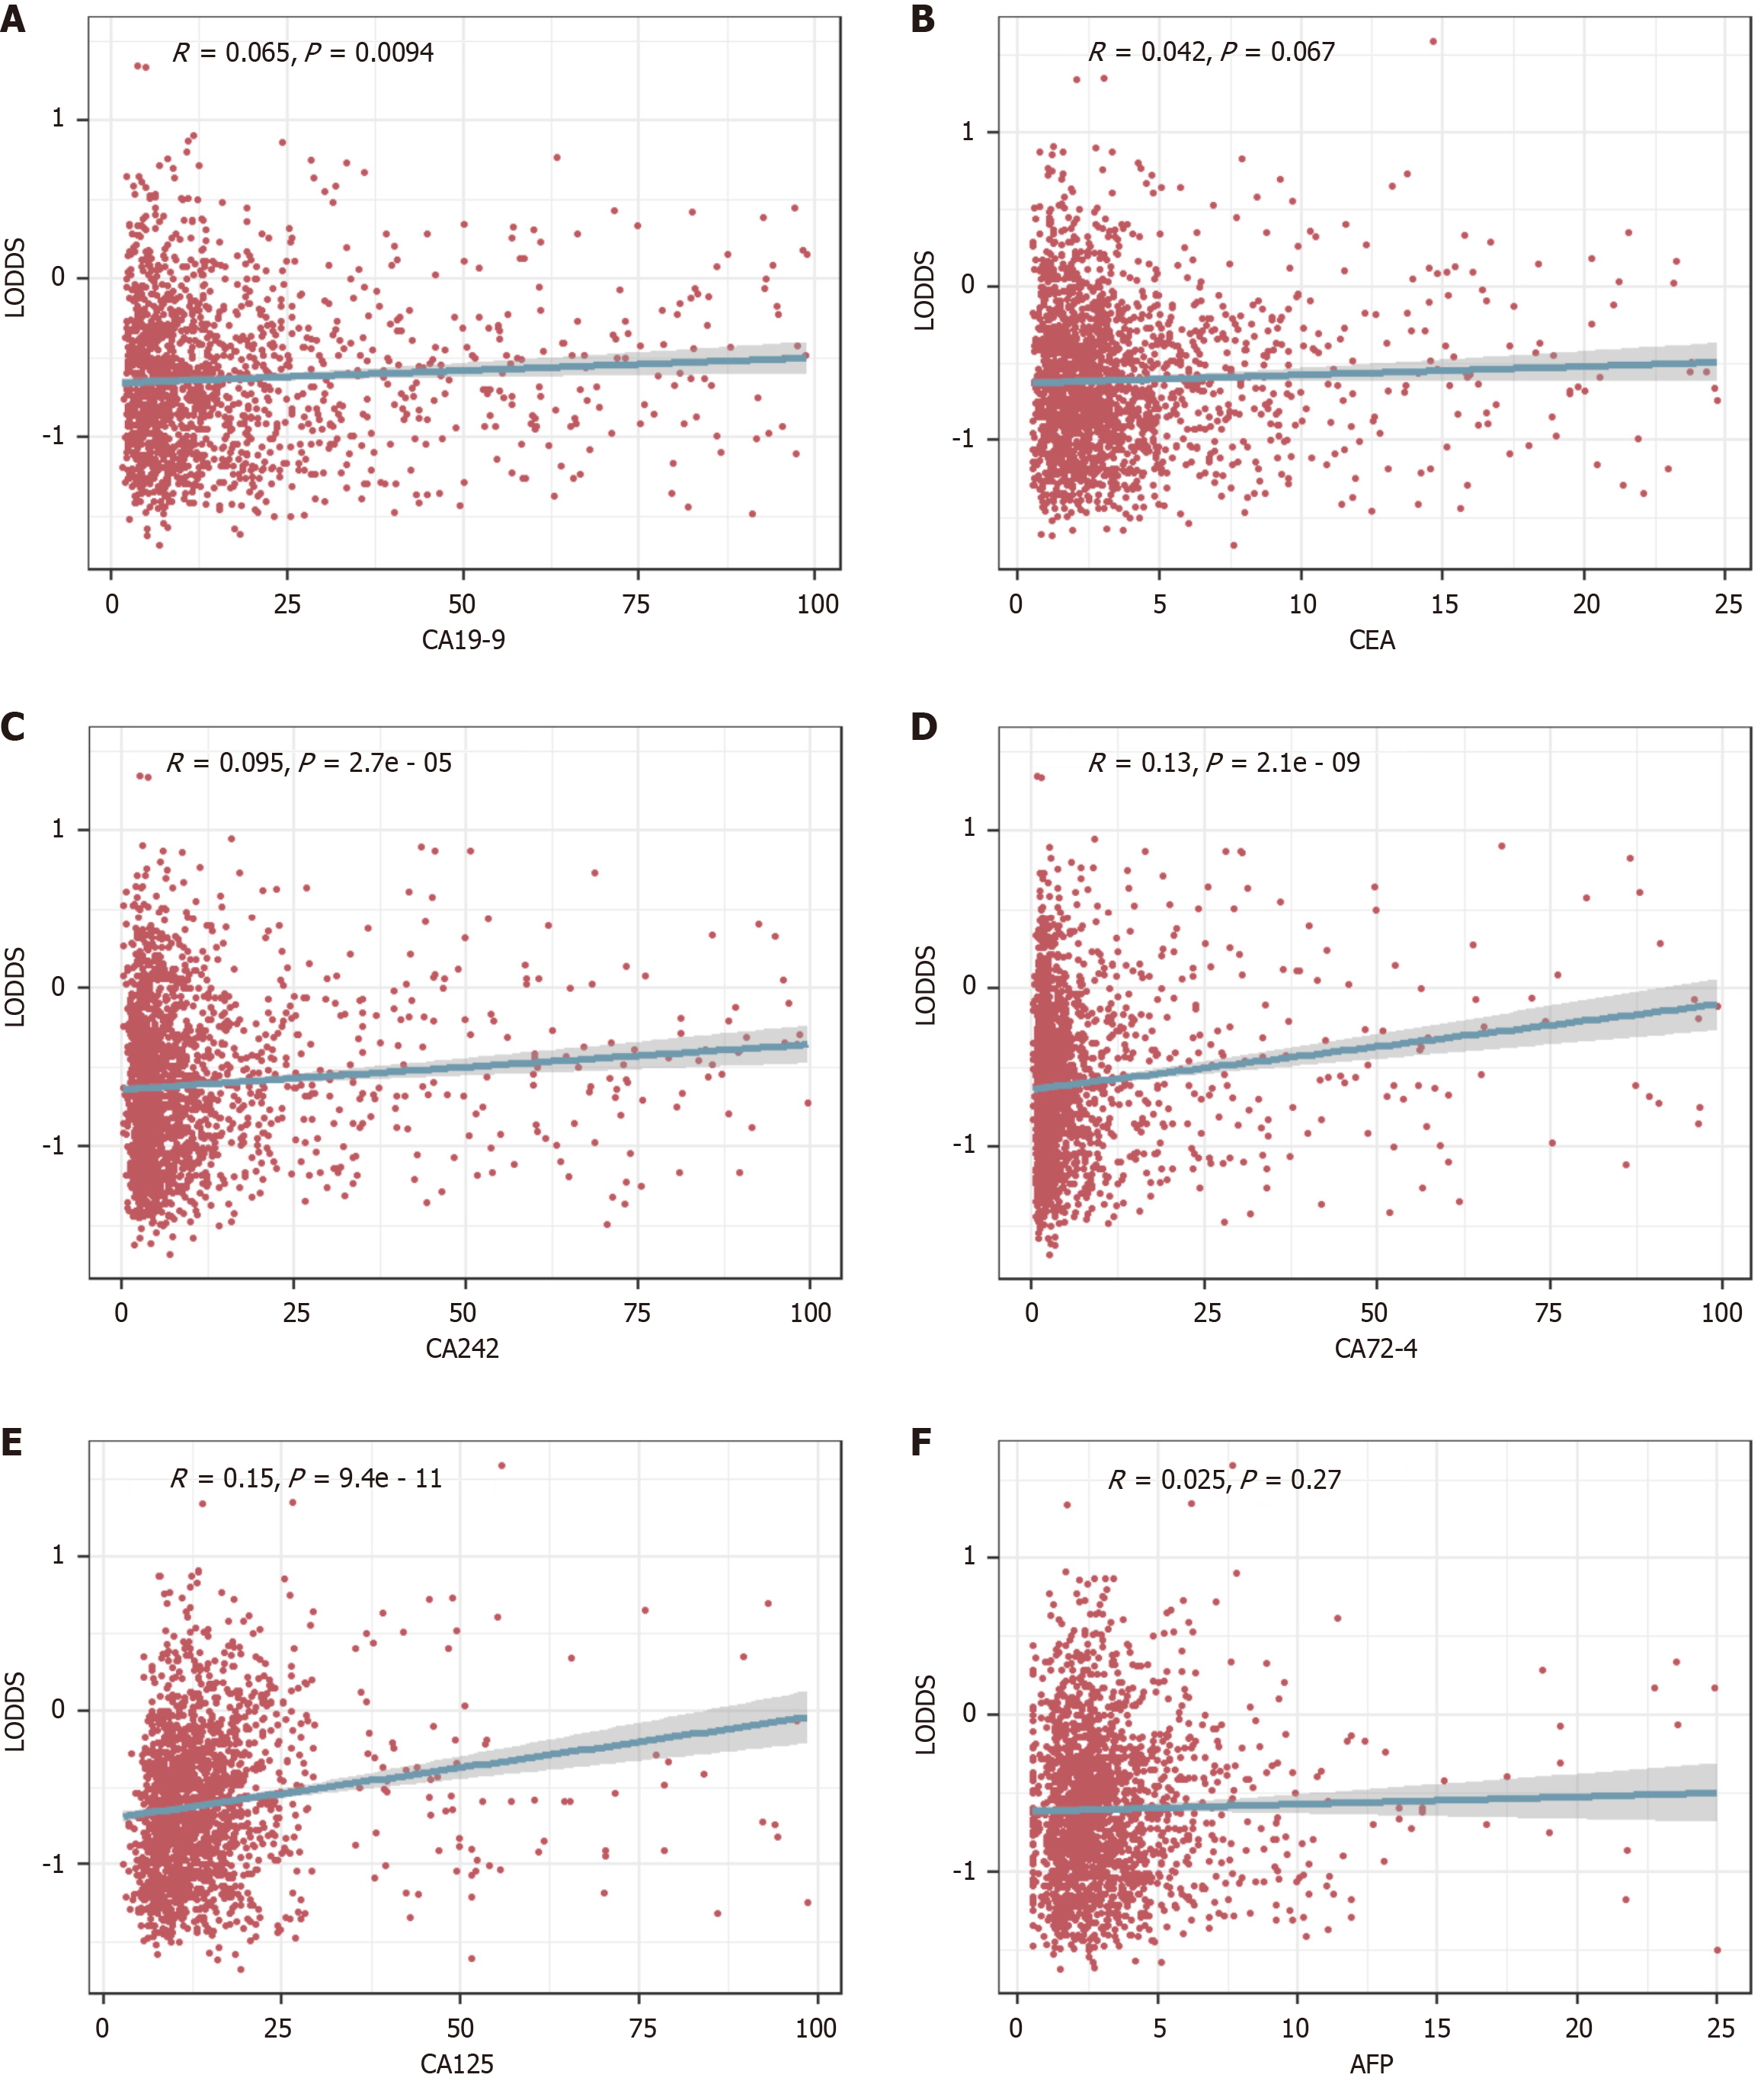
Figure 3 Scatterplot of the correlation of log odds of positive lymph nodes with tumor markers.
A: Carbohydrate antigen (CA) 19-9; B: Carcinoembryonic antigen; C: CA242; D: CA72-4; E: CA125; F: Alpha-fetoprotein. LODDS: Log odds of positive lymph nodes; CA: Carbohydrate antigen; CEA: Carcinoembryonic antigen; AFP: Alpha-fetoprotein.
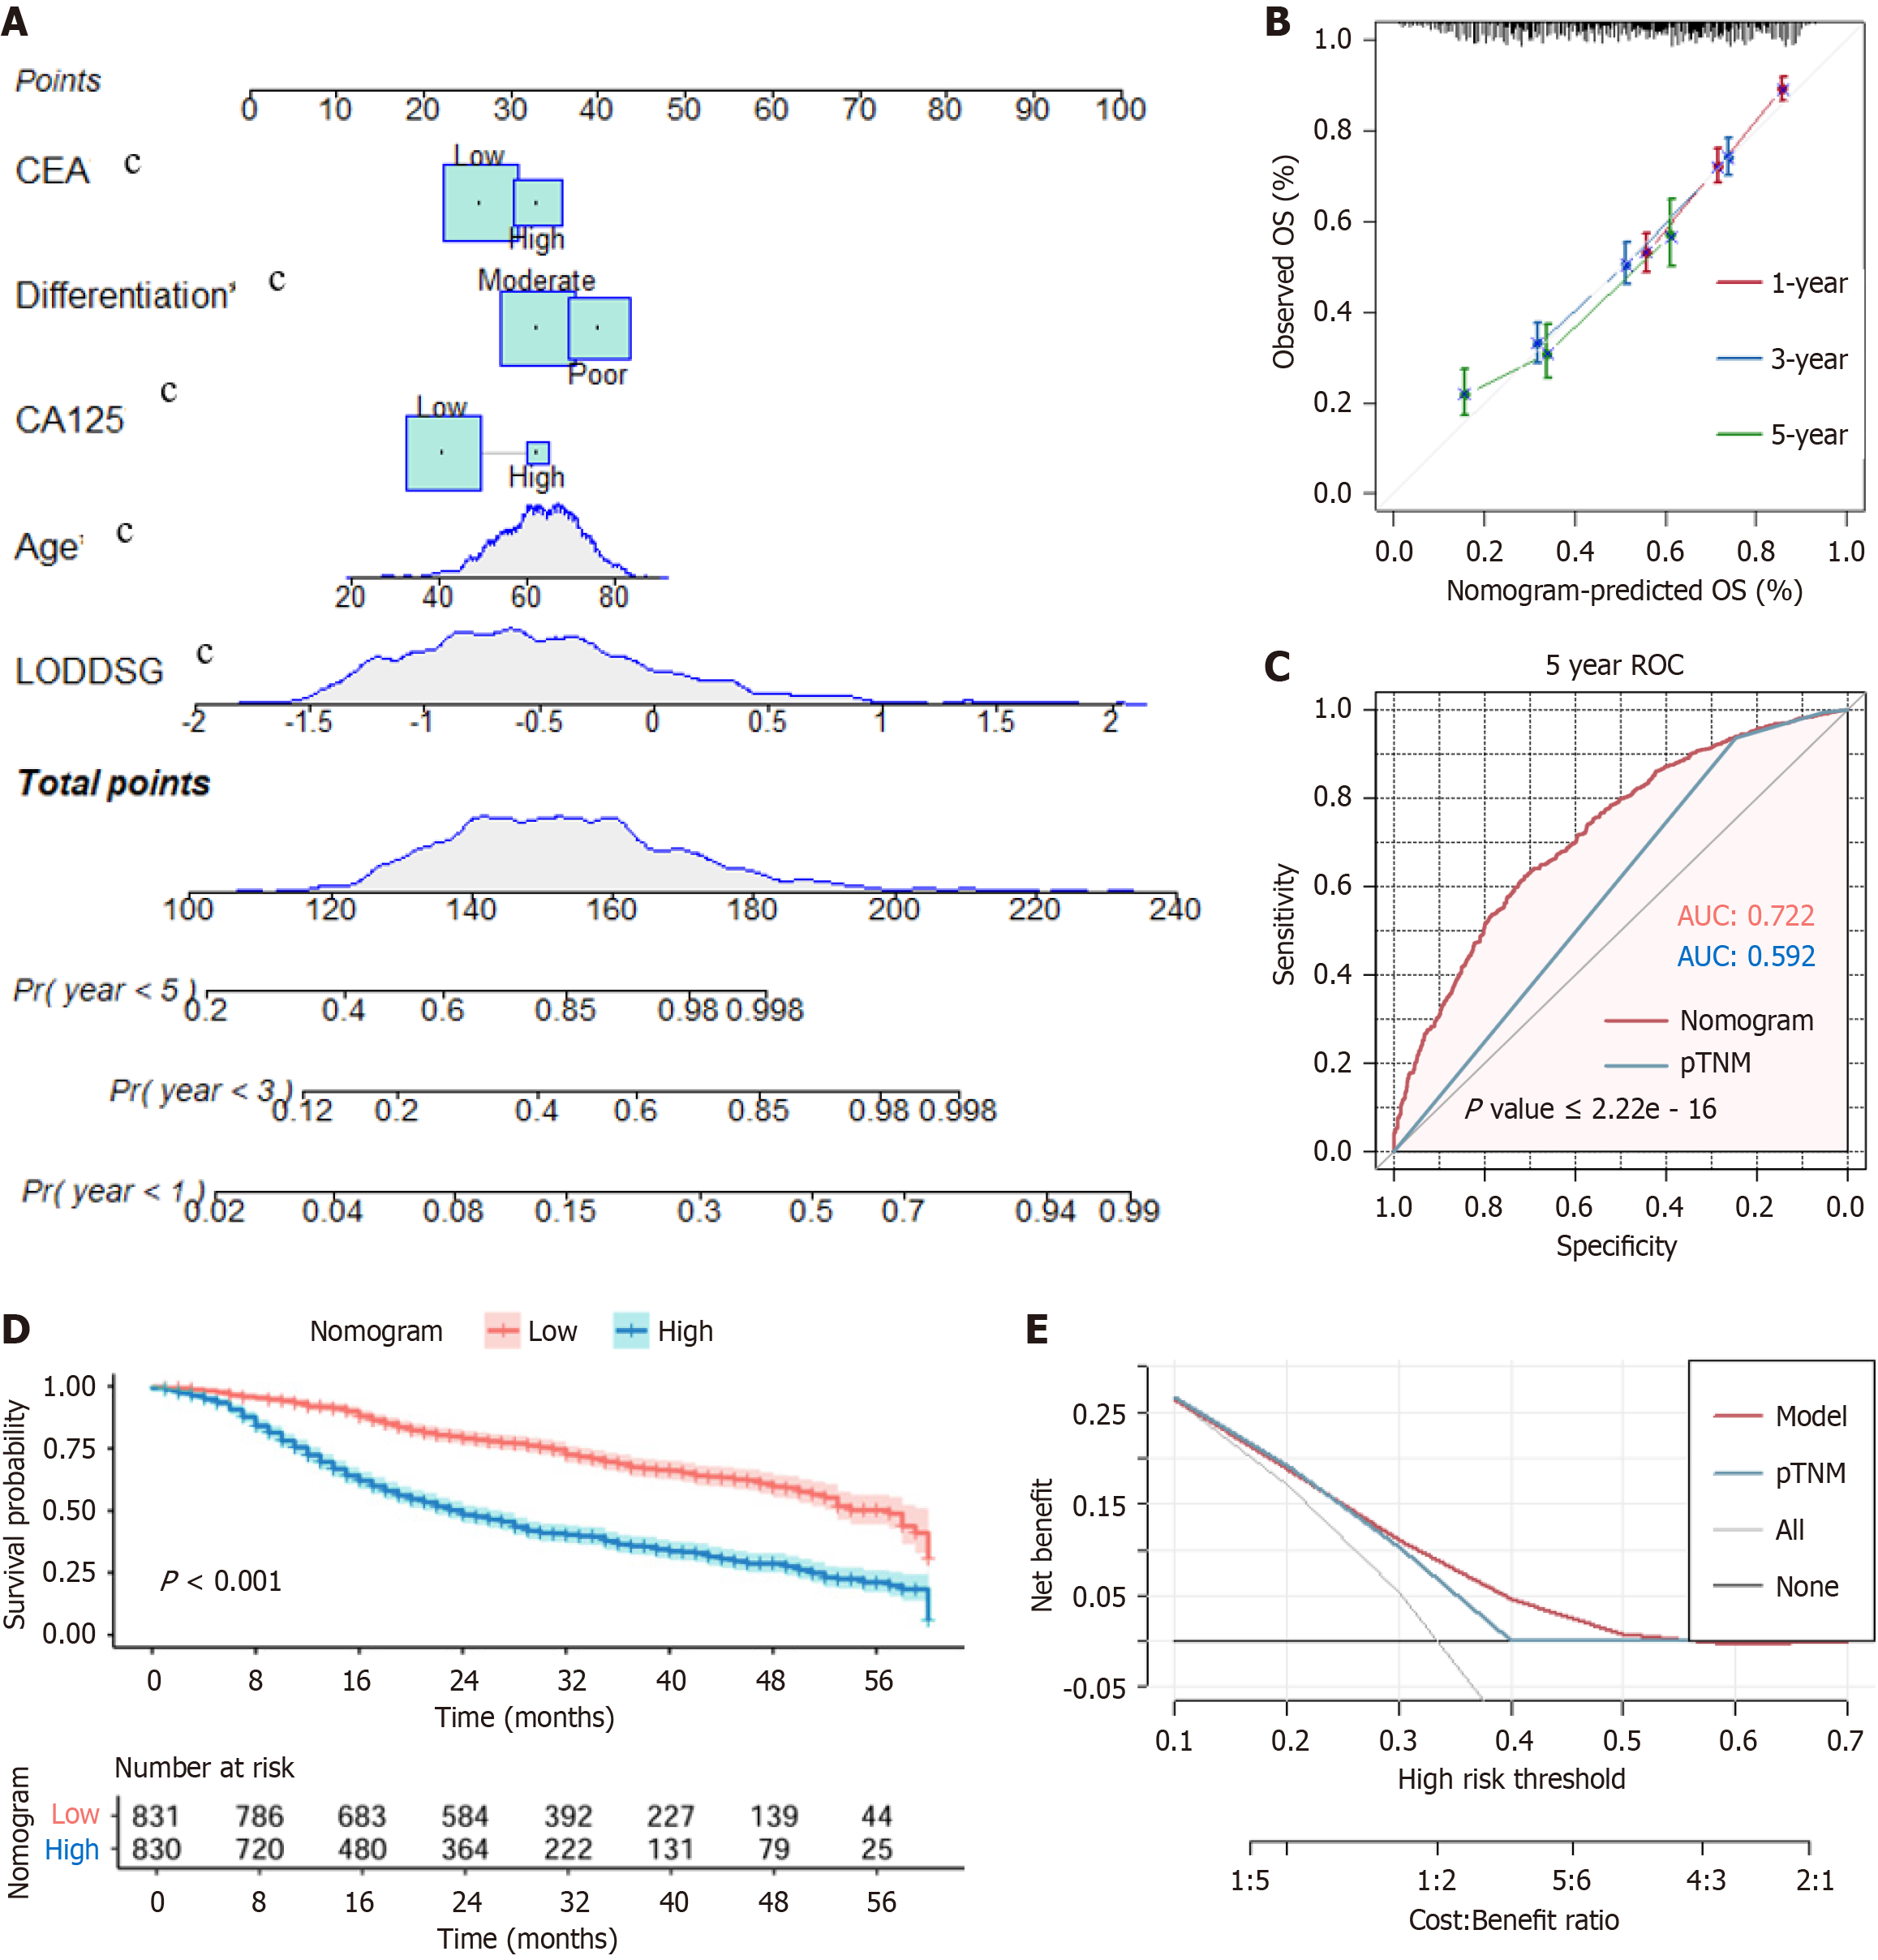
Figure 4 Construction of a nomogram model to predict the prognosis of gastric cancer patients based on log odds of positive lymph nodes, tumor differentiation, and other independent risk factors.
A: Nomogram; B: Calibration curve of the nomogram; C: Receiver operating characteristic curves for the nomogram and pathological tumor-node-metastasis staging systems; D: Kaplan–Meier curve of overall survival for the high-risk and low-risk groups based on the nomogram; E: Decision curve analysis comparing the nomogram with the pathological tumor-node-metastasis staging system. (P < 0.005). LODDS: Log odds of positive lymph nodes; CA: Carbohydrate antigen; CEA: Carcinoembryonic antigen; pTNM: Pathological tumor-node-metastasis; OS: Overall survival; ROC: Receiver operating characteristic; AUC: Area under the curve.
- Citation: Deng MC, Chen K, Bao QM, Huang YX, Zhang CK, Zhong YK, He HY, Zu D, Liang C, Liu HD, Hu YC, Liu GX, He YH, Wu WX, Zhou JN, Teng YS, Jing J, Shi Y, Chung CYS, Yu CH, Du YA, Ye Z, Cheng XD. Evaluating log odds of positive lymph nodes as a prognostic tool in differentiated gastric cancer: A retrospective study. World J Gastroenterol 2025; 31(21): 107029
- URL: https://www.wjgnet.com/1007-9327/full/v31/i21/107029.htm
- DOI: https://dx.doi.org/10.3748/wjg.v31.i21.107029


