Copyright
©The Author(s) 2025.
World J Gastroenterol. Jun 7, 2025; 31(21): 107029
Published online Jun 7, 2025. doi: 10.3748/wjg.v31.i21.107029
Published online Jun 7, 2025. doi: 10.3748/wjg.v31.i21.107029
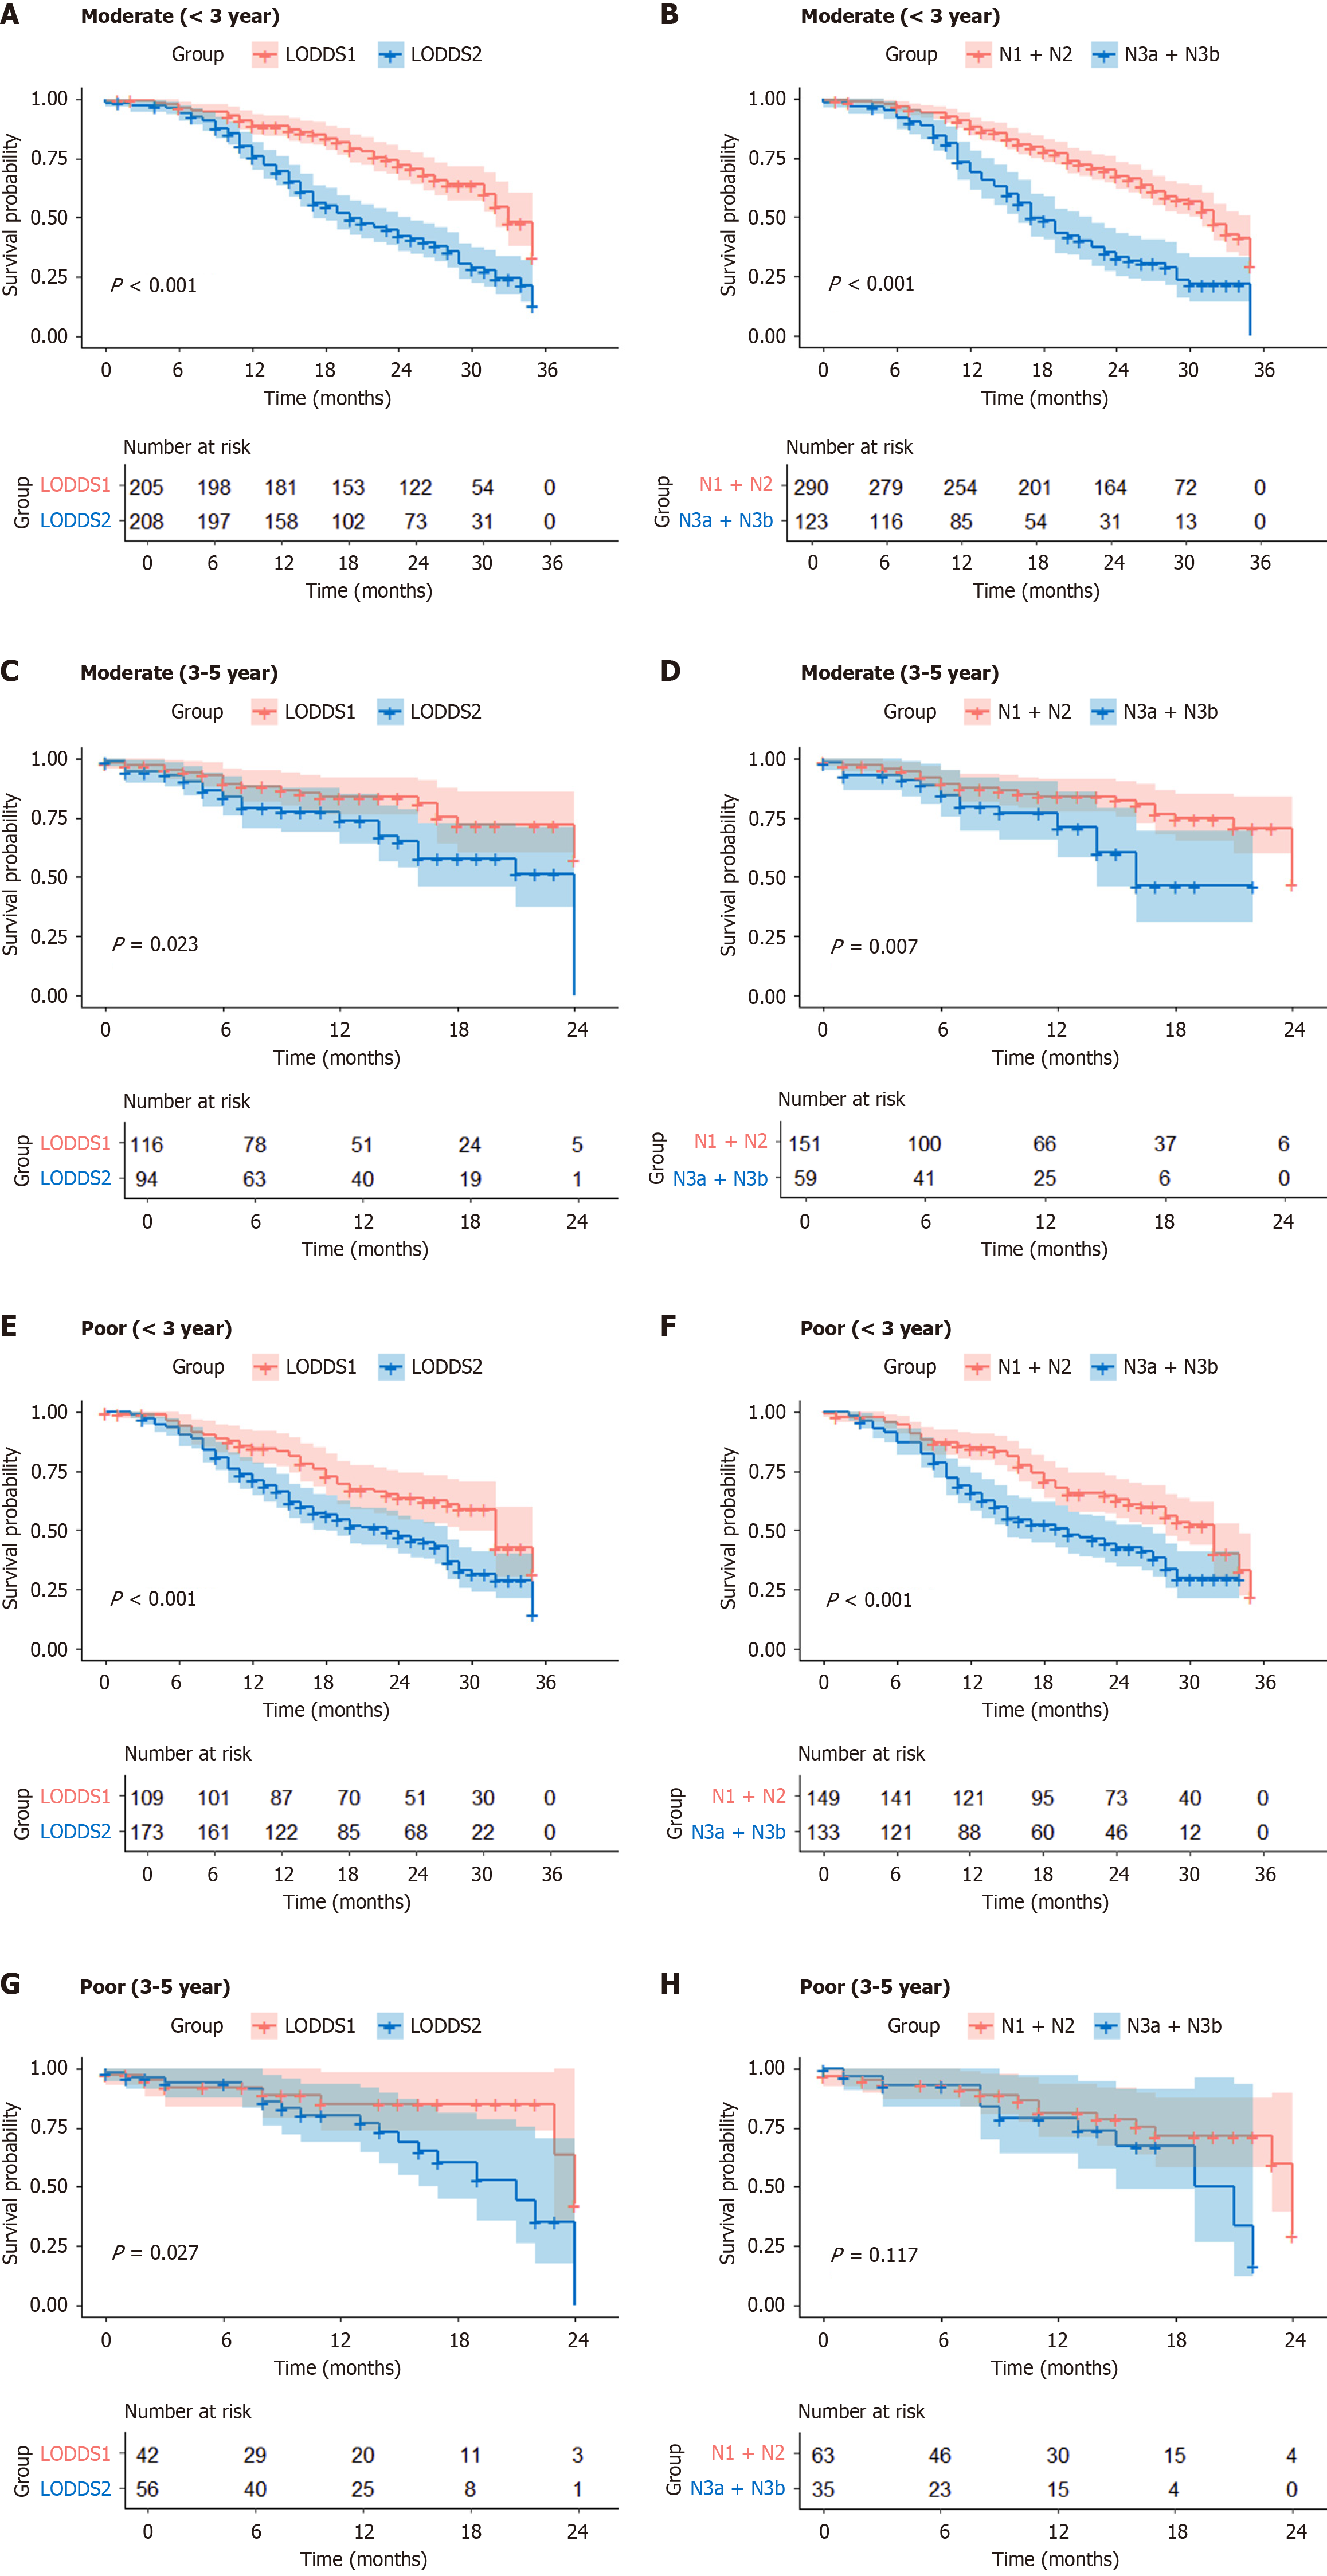
Figure 1 Kaplan–Meier survival analysis after propensity score matching.
A: Moderately differentiated gastric cancer (GC) patients 3 years postoperatively log odds of positive lymph nodes (LODDS) 1 vs LODDS2; B: Moderately differentiated GC patients 3 years postoperatively N1 + N2 vs N3a + N3b; C: Moderately differentiated GC patients 3-5 years postoperatively LODDS1 vs LODDS2; D: Moderately differentiated GC patients 3-5 years postoperatively N1 + N2 vs N3a + N3b; E: Poorly differentiated GC patients 3 years postoperatively LODDS1 vs LODDS2; F: Poorly differentiated GC patients 3 years after surgery N1 + N2 vs N3a + N3b; G: Poorly differentiated GC patients 3-5 years after surgery LODDS1 vs LODDS2; H: Poorly differentiated GC patients 3-5 years after surgery N1 + N2 vs N3a + N3b. LODDS: Log odds of positive lymph nodes.
- Citation: Deng MC, Chen K, Bao QM, Huang YX, Zhang CK, Zhong YK, He HY, Zu D, Liang C, Liu HD, Hu YC, Liu GX, He YH, Wu WX, Zhou JN, Teng YS, Jing J, Shi Y, Chung CYS, Yu CH, Du YA, Ye Z, Cheng XD. Evaluating log odds of positive lymph nodes as a prognostic tool in differentiated gastric cancer: A retrospective study. World J Gastroenterol 2025; 31(21): 107029
- URL: https://www.wjgnet.com/1007-9327/full/v31/i21/107029.htm
- DOI: https://dx.doi.org/10.3748/wjg.v31.i21.107029


