Copyright
©The Author(s) 2023.
World J Gastroenterol. Jan 21, 2023; 29(3): 561-578
Published online Jan 21, 2023. doi: 10.3748/wjg.v29.i3.561
Published online Jan 21, 2023. doi: 10.3748/wjg.v29.i3.561
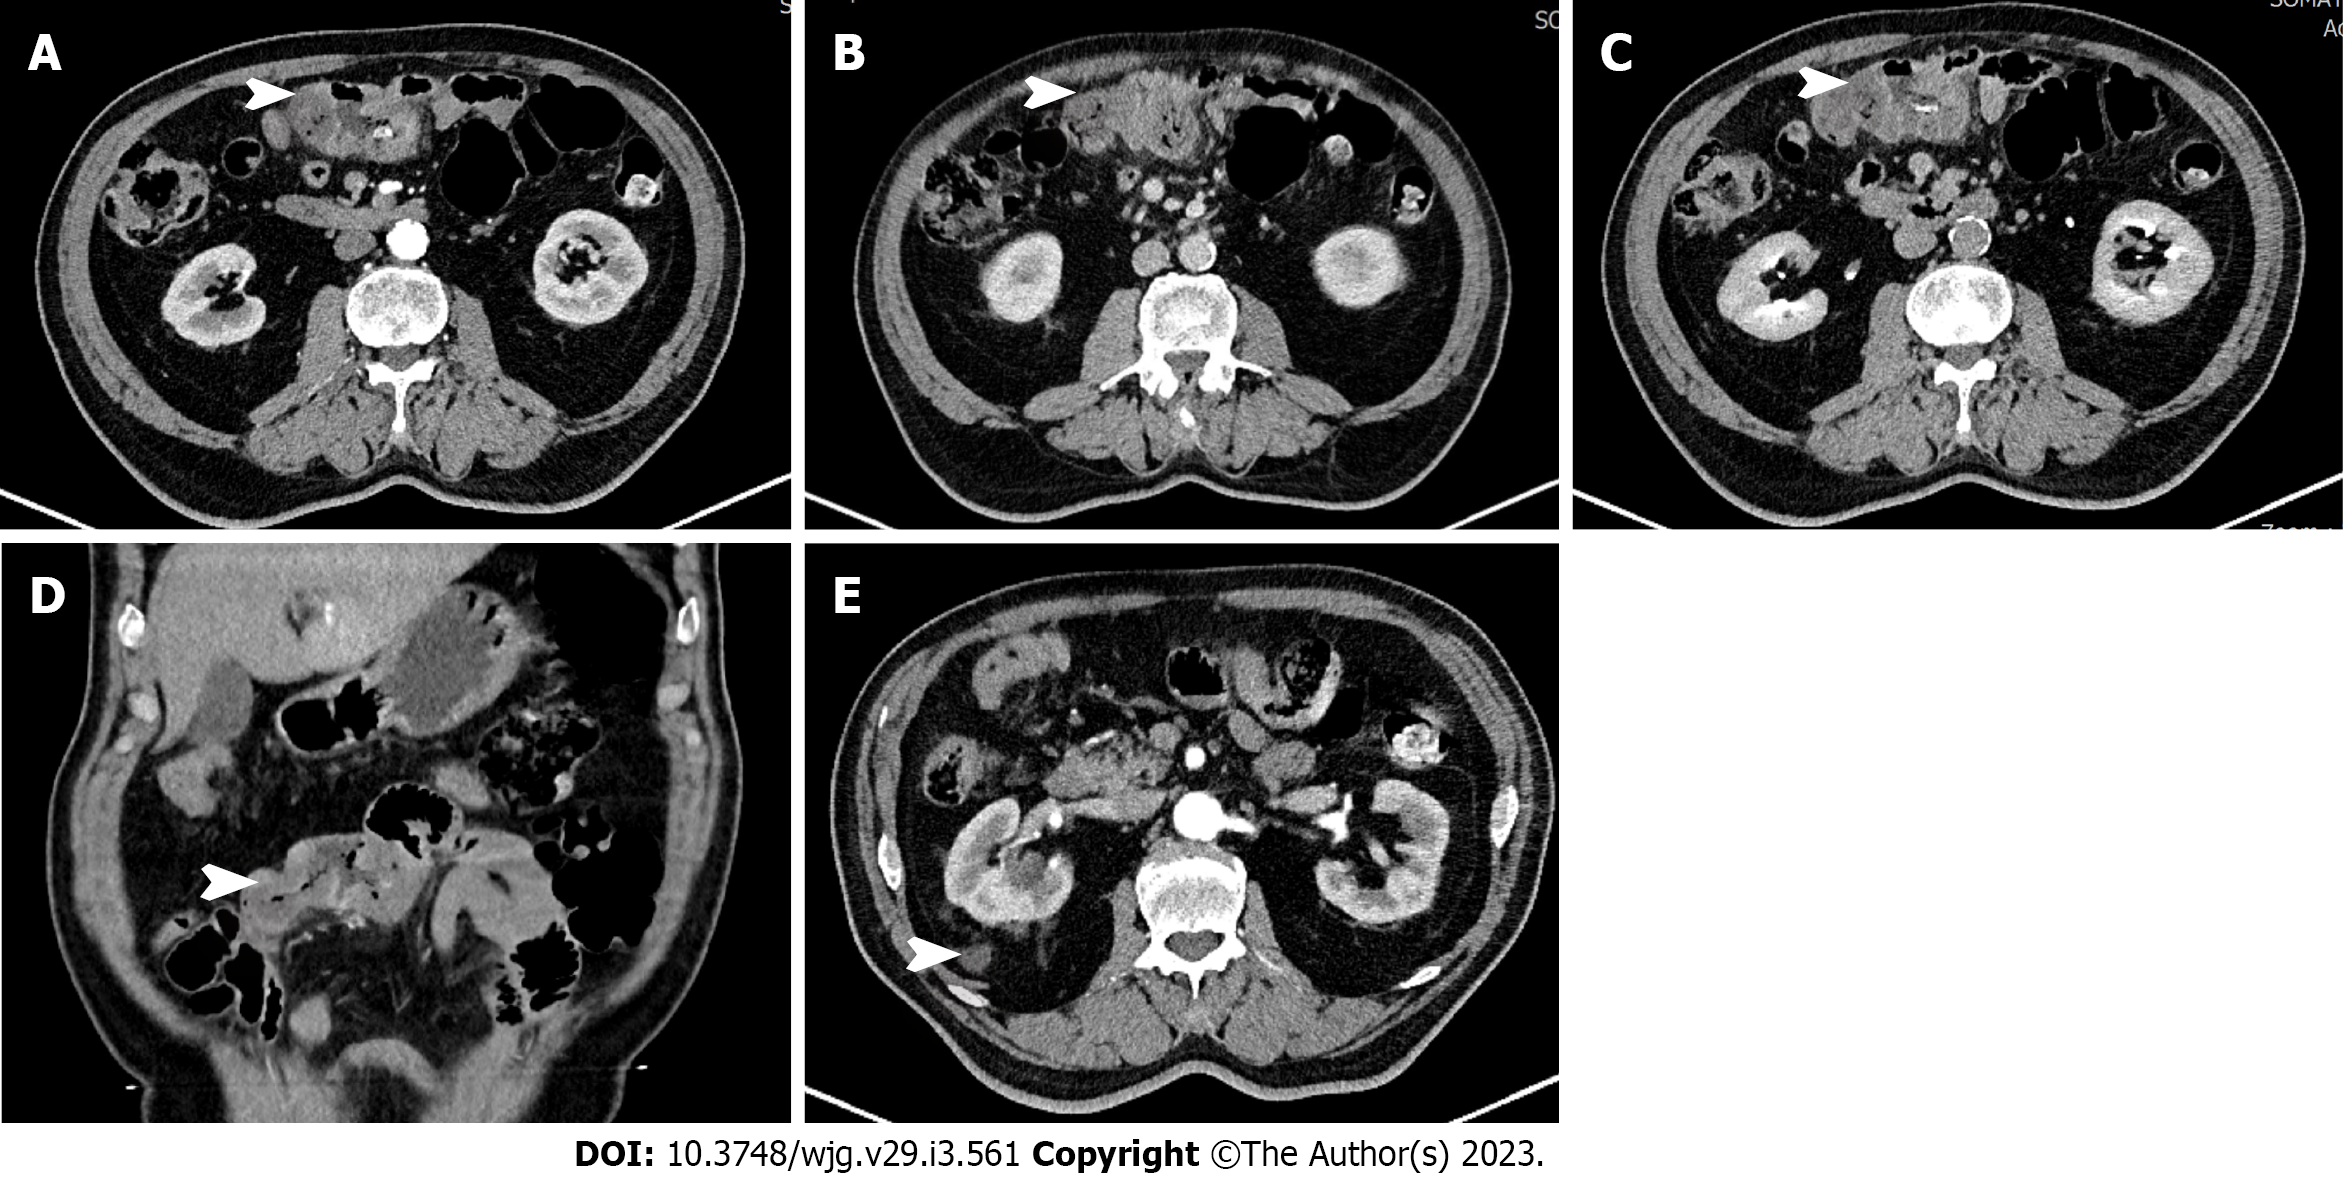
Figure 1 Computed tomography showed segmental thickening of the small intestine (white arrow), with lesion enhancement in the arterial phase.
A: Arterial phase; B: Venous phase; C: Balanced phase; D: Coronal plane; E: Adrenal masses.
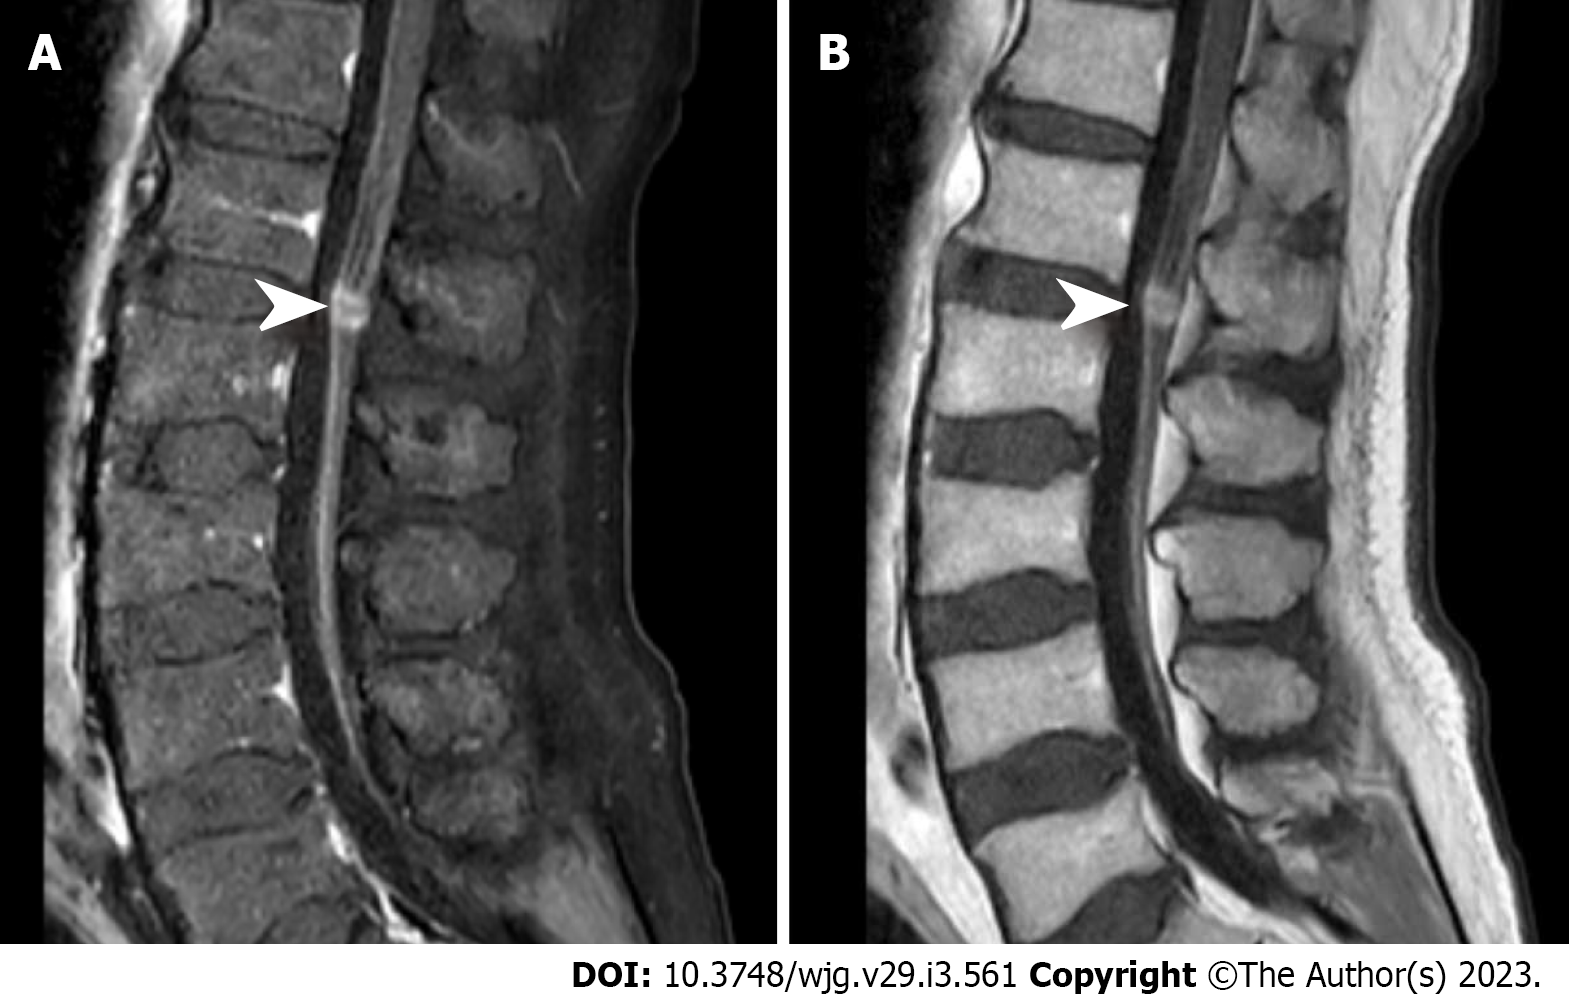
Figure 2 Magnetic resonance imaging showed local abnormally enhanced nodules (white arrow) at the L1/L2 Level in the cauda equina.
A: T1 phase; B: T2 phase.
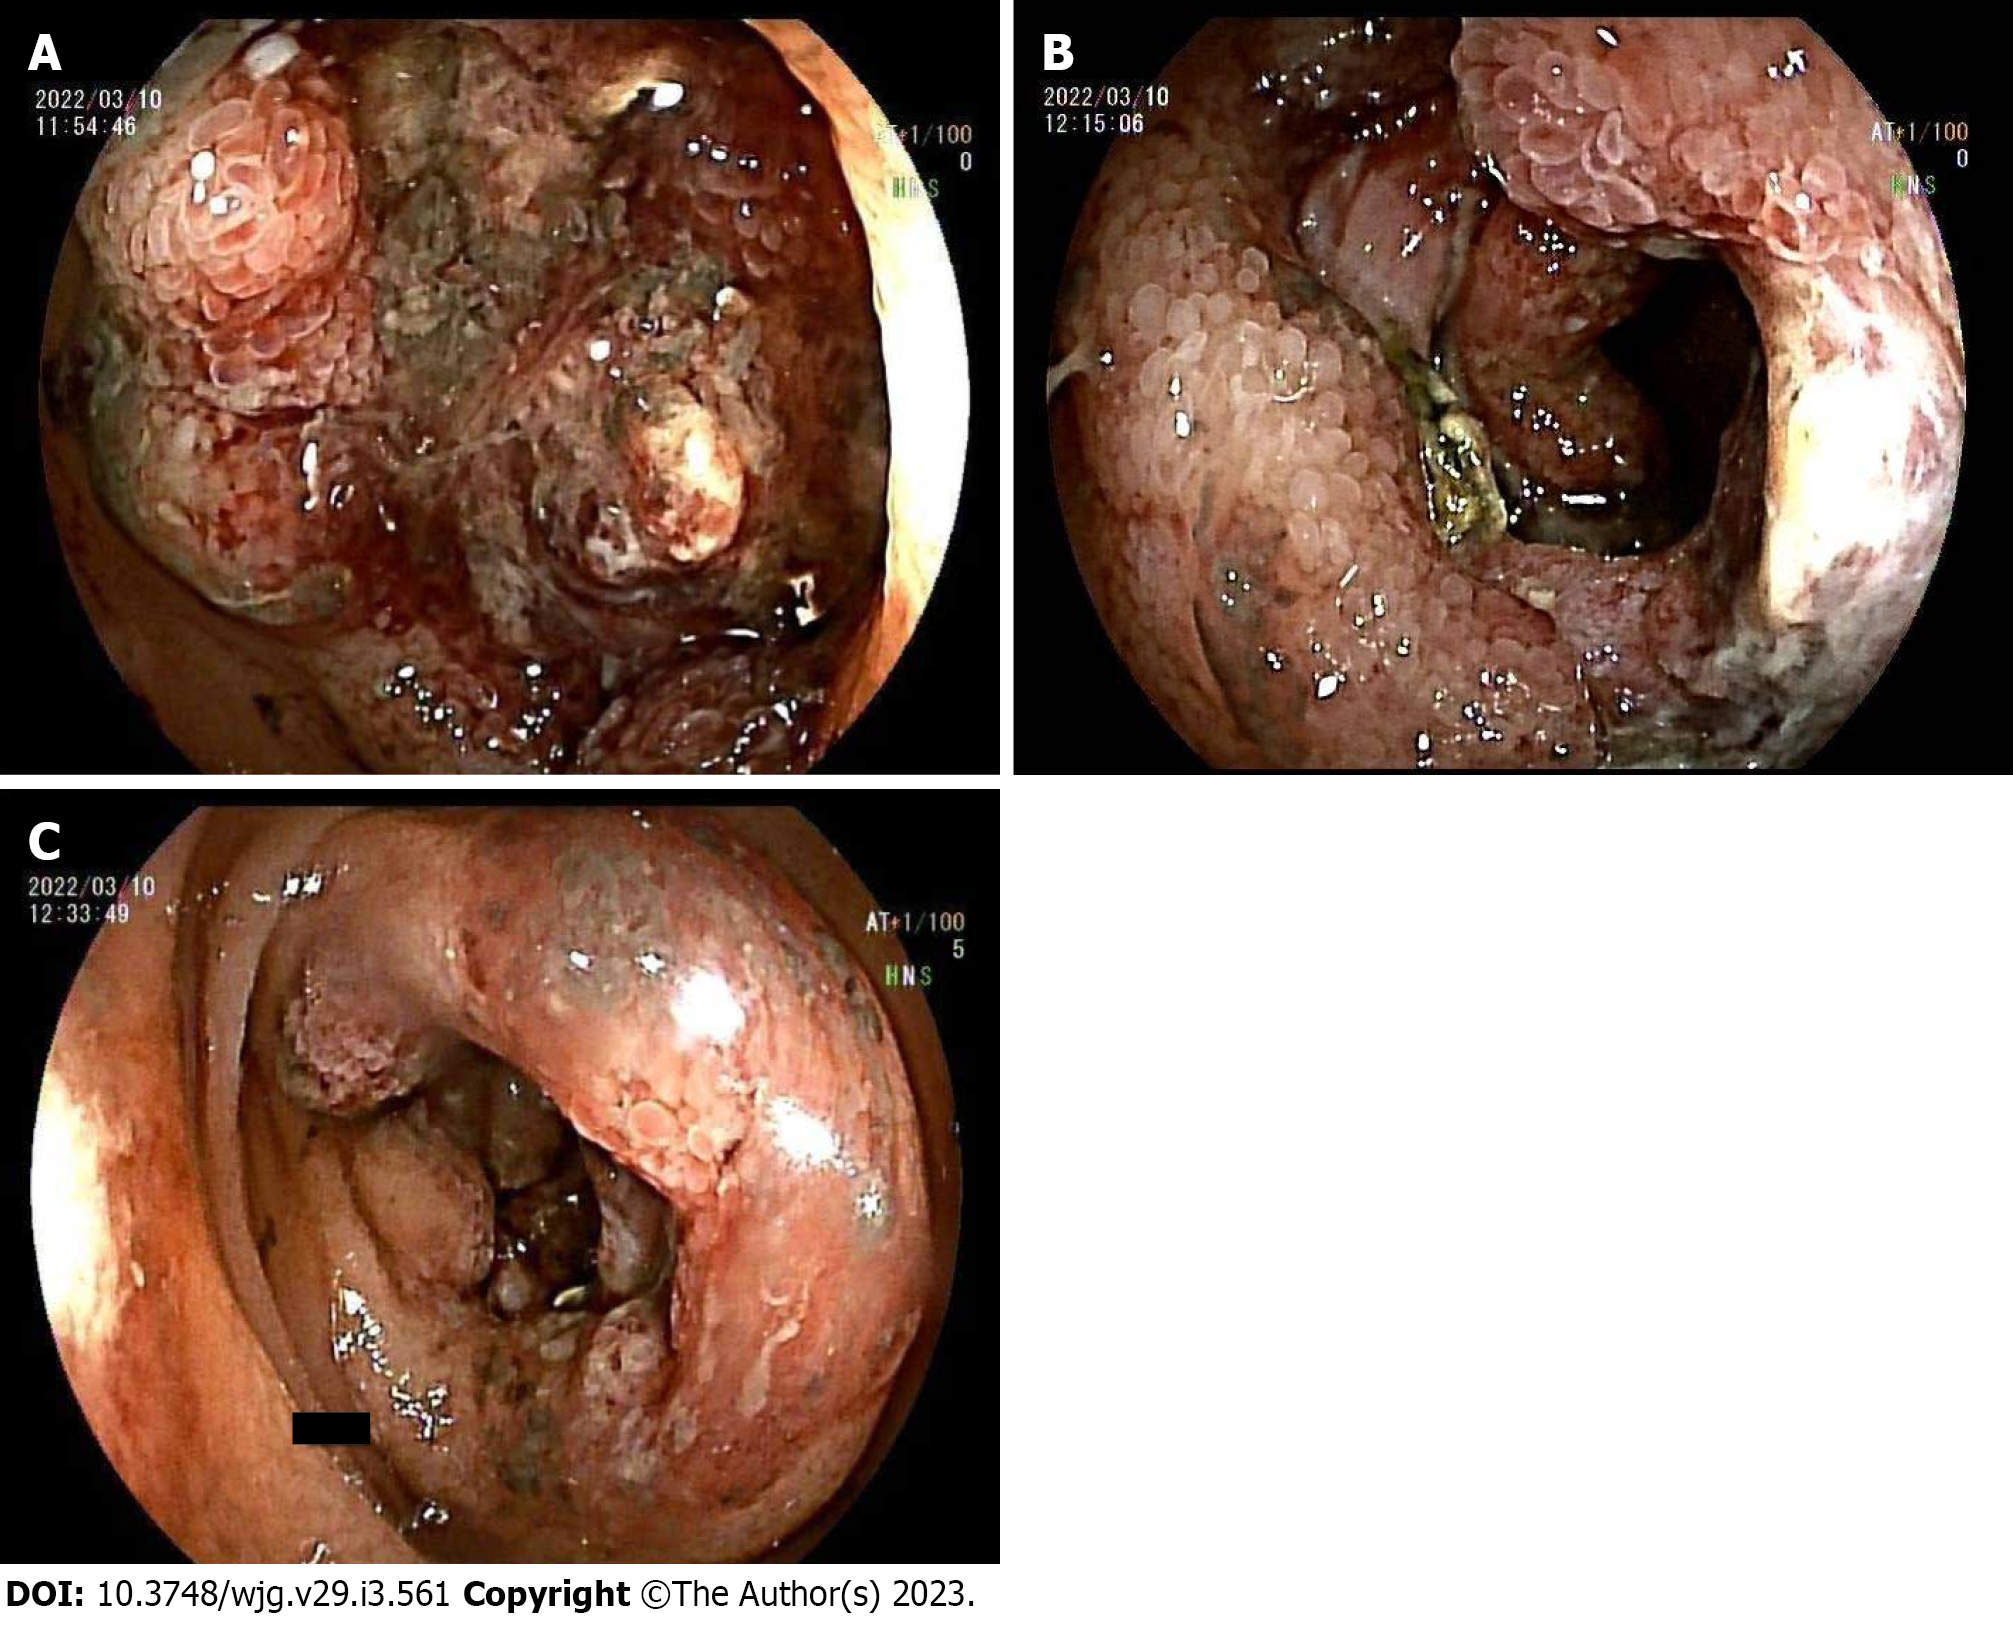
Figure 3 Electronic double-balloon enteroscopy.
A-C: Electronic double-balloon enteroscopy showed continuous periannulus ulcers 2.4-2.5 m above the ileocecal valve, covered with mucous moss.
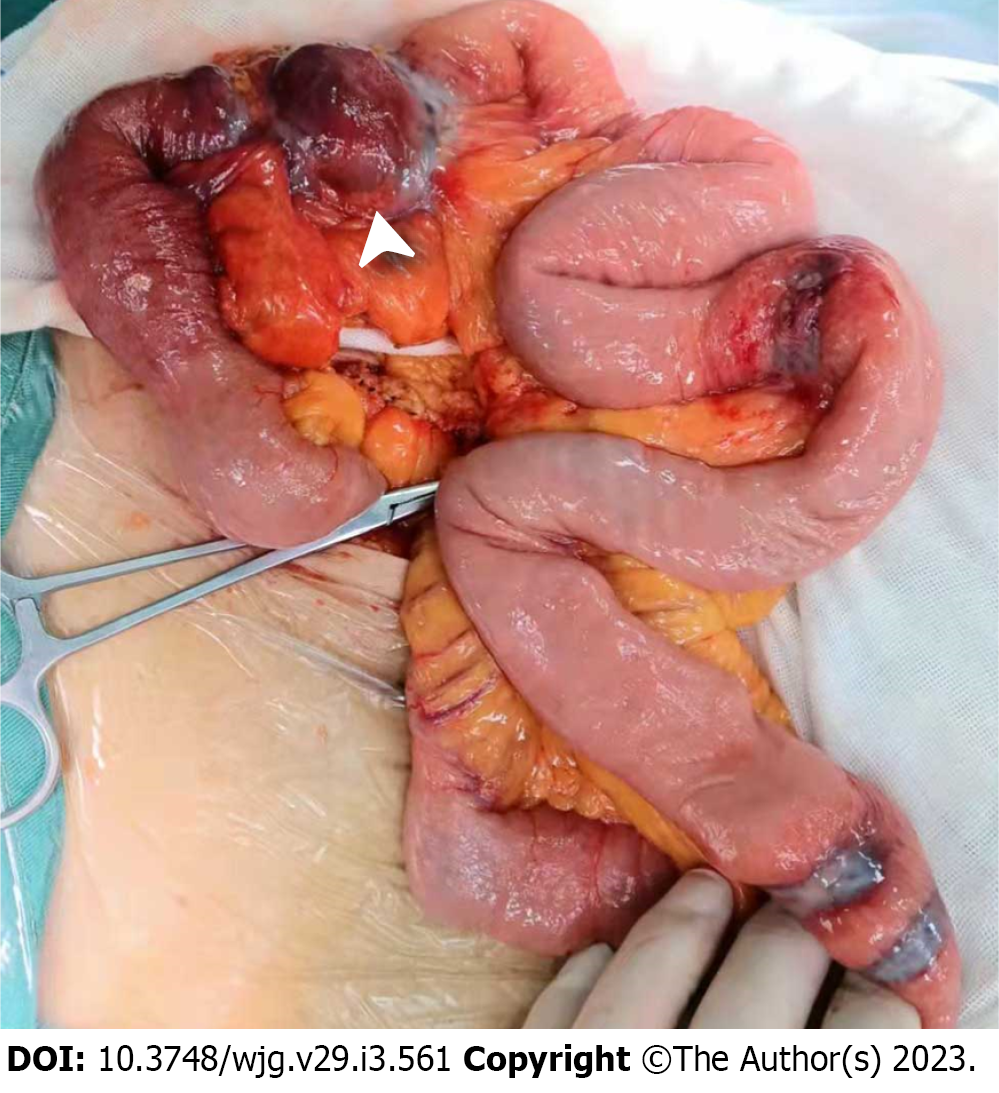
Figure 4 During the operation, multiple grey-red ulcerative tumors were observed in the ileum mucosa covered with moss.
In addition, an 8 cm × 6 cm ulcerative mass (white arrow) resulted in intestinal obstruction.
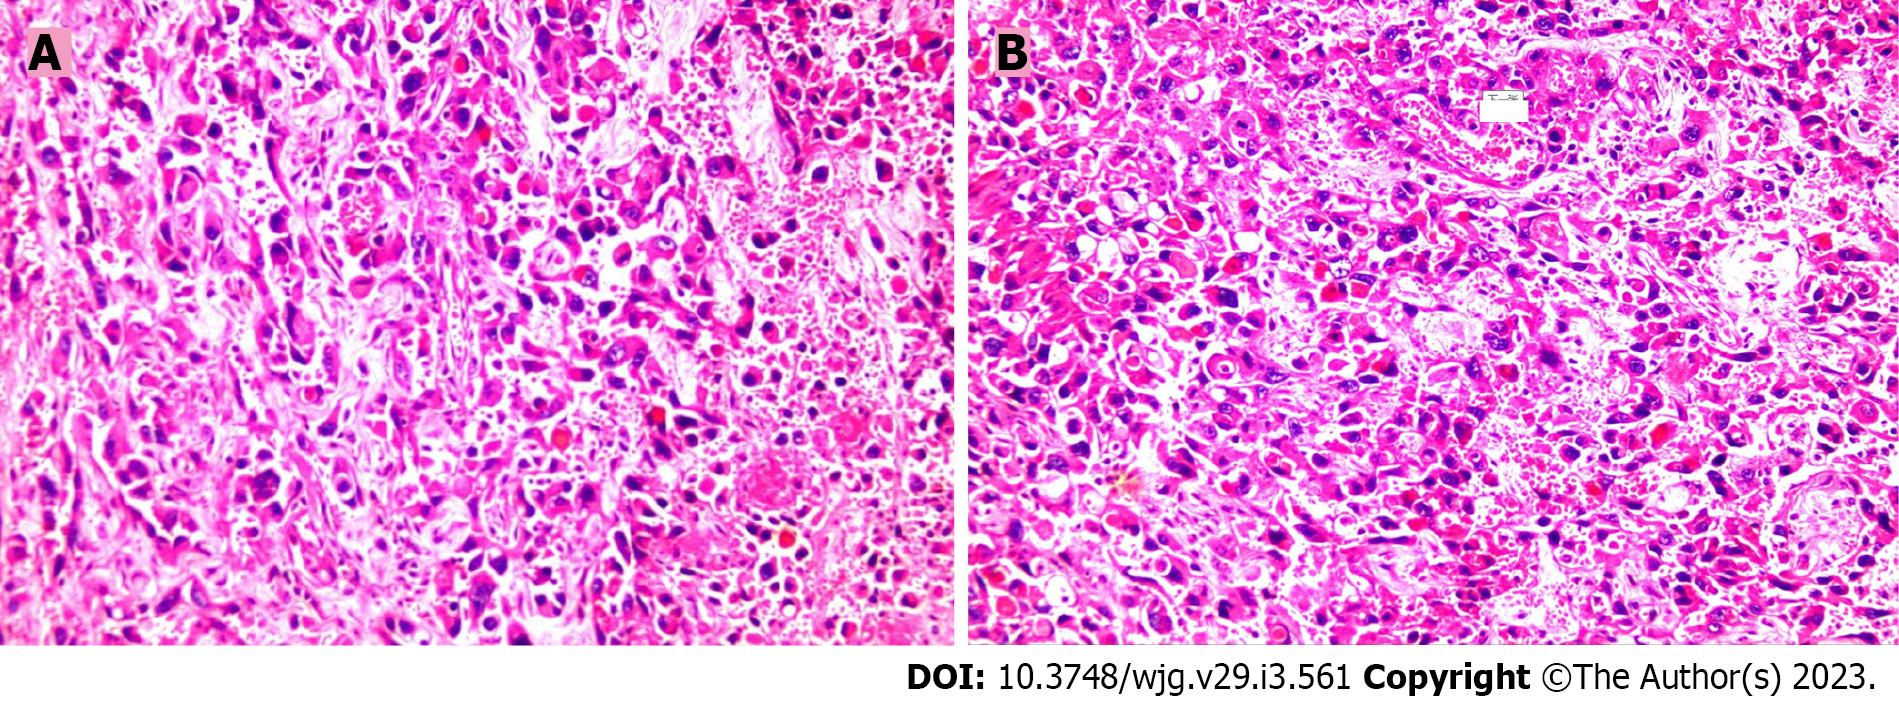
Figure 5 Pathologic findings.
A and B: Microscopically, spindle cell infiltration was observed with round or spindle-shaped nuclei. In some areas, tumor cells formed vascular channels with red blood cells in the middle (× 100).
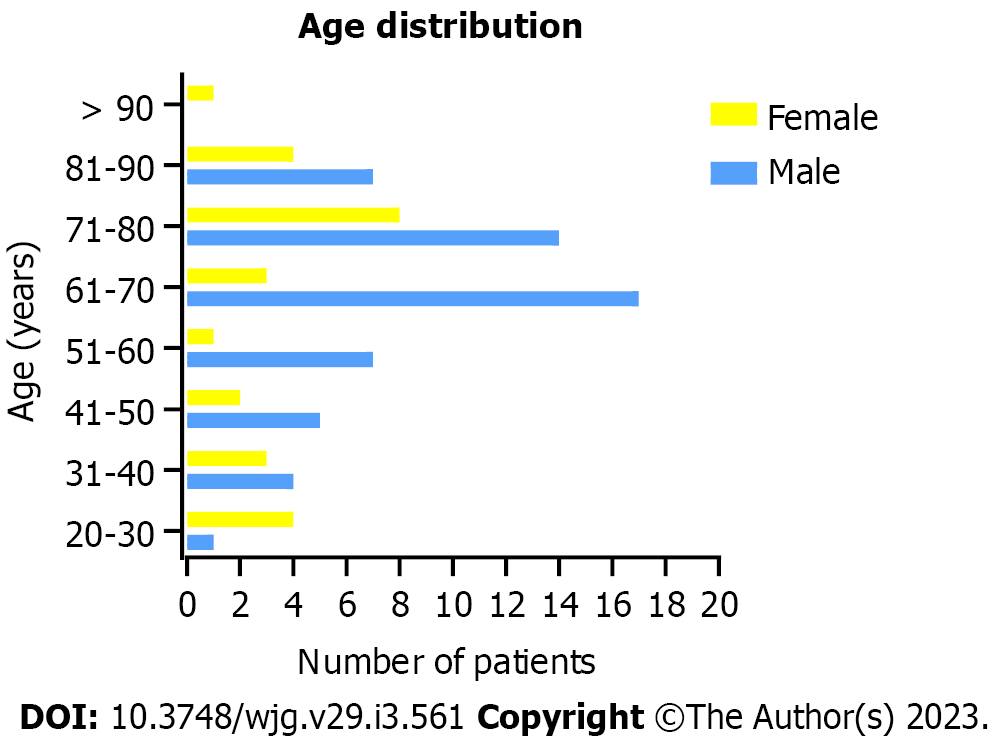
Figure 6 Age distribution of male and female patients.
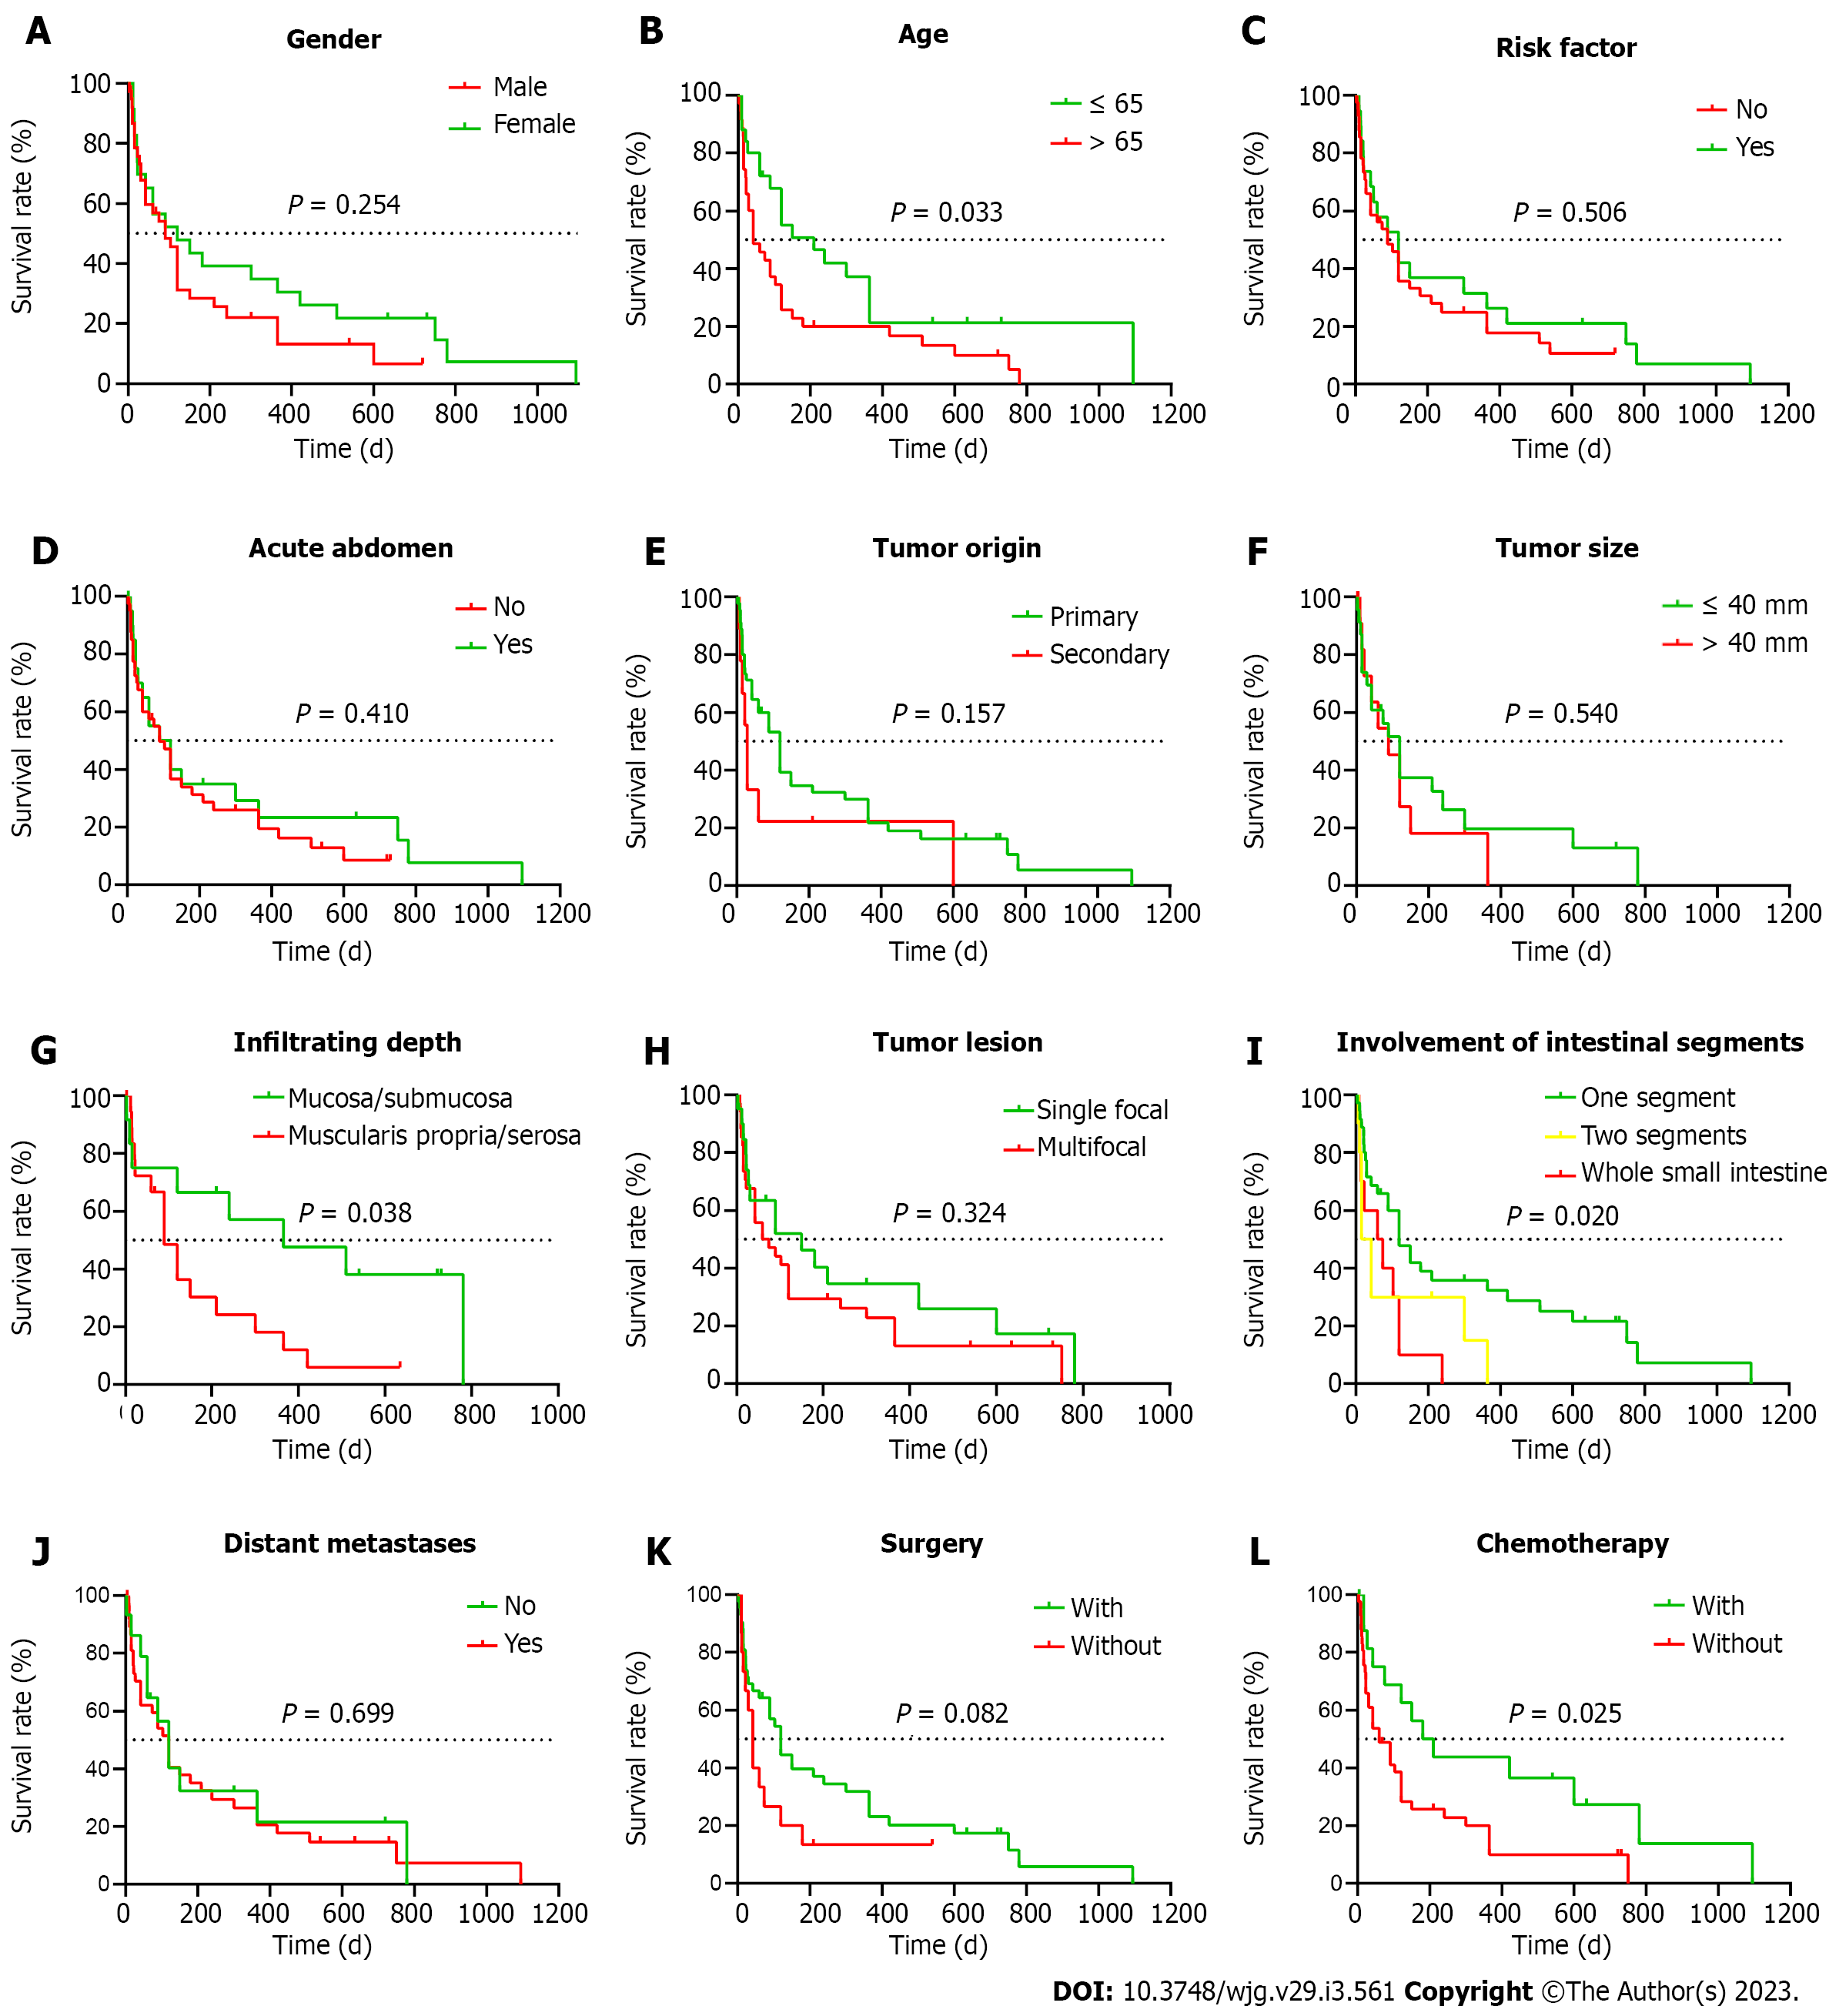
Figure 7 Kaplan-Meier survival analysis.
A: Sex; B: Age; C: Risk factor; D: Acute abdomen; E: Tumor origin; F: Tumor size; G: Infiltrating depth; H: Number of tumor lesions; I: Intestinal segments involvement; J: Distant metastases; K: Surgery; L: Chemotherapy.
- Citation: Ma XM, Yang BS, Yang Y, Wu GZ, Li YW, Yu X, Ma XL, Wang YP, Hou XD, Guo QH. Small intestinal angiosarcoma on clinical presentation, diagnosis, management and prognosis: A case report and review of the literature. World J Gastroenterol 2023; 29(3): 561-578
- URL: https://www.wjgnet.com/1007-9327/full/v29/i3/561.htm
- DOI: https://dx.doi.org/10.3748/wjg.v29.i3.561


