Copyright
©The Author(s) 2022.
World J Gastroenterol. Aug 14, 2022; 28(30): 4089-4101
Published online Aug 14, 2022. doi: 10.3748/wjg.v28.i30.4089
Published online Aug 14, 2022. doi: 10.3748/wjg.v28.i30.4089
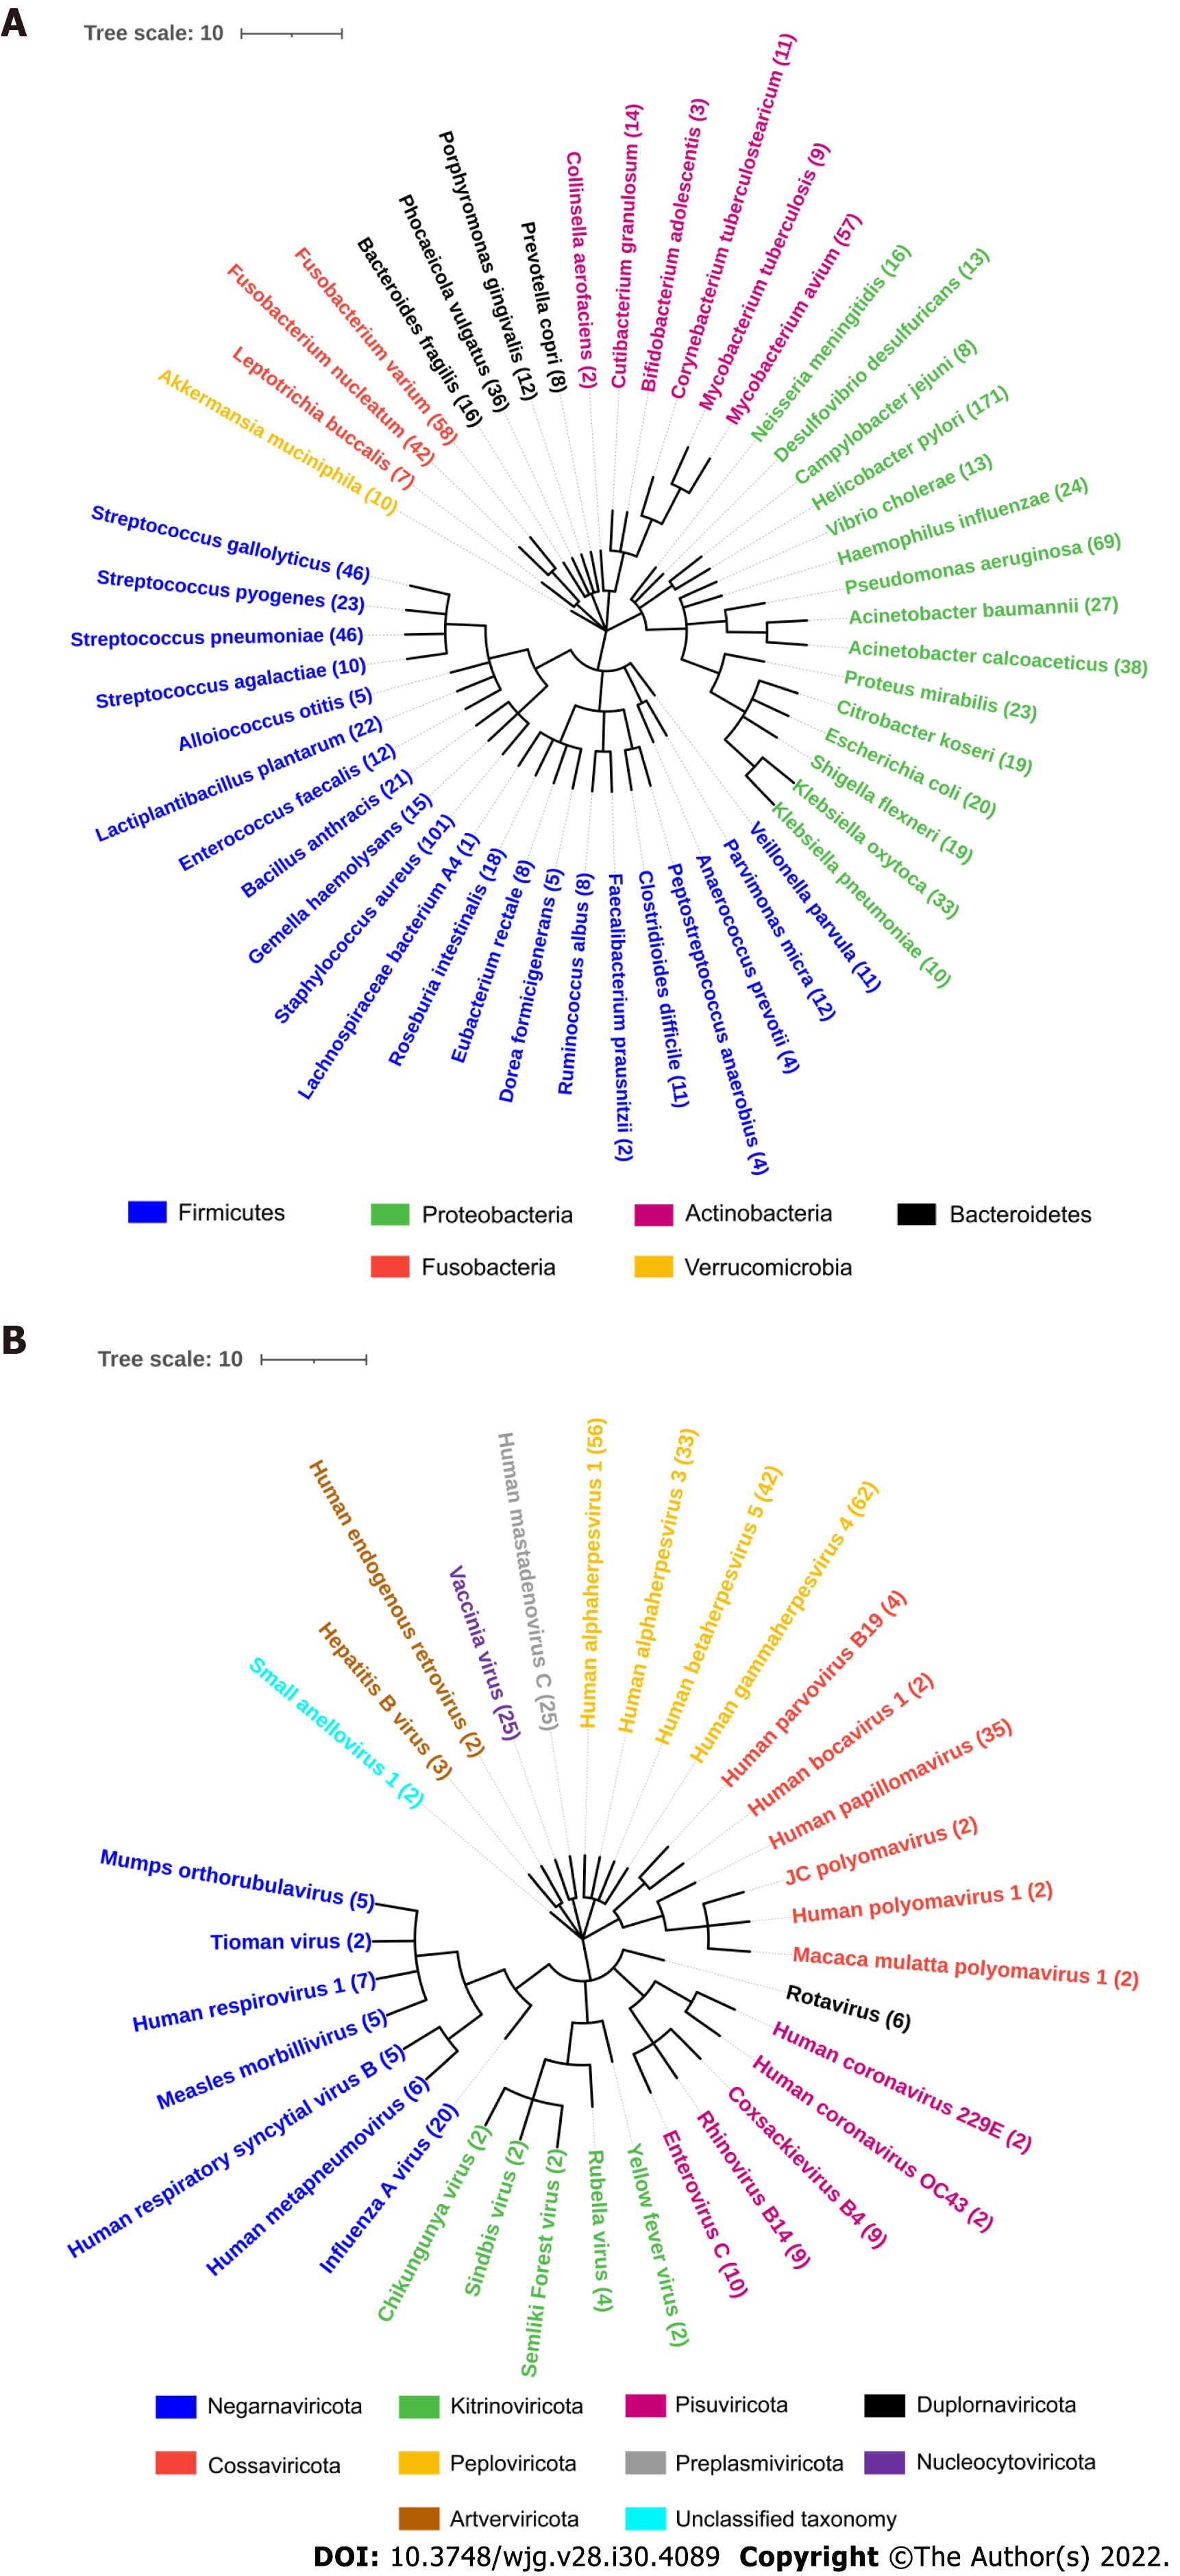
Figure 1 Phylogenetic tree of microbes studied with their corresponding number of proteins analyzed.
A: Fifty species of bacteria with 1173 proteins were segregated into 6 phyla; B: Thirty-three species of viruses with 397 proteins were segregated into 10 phyla.
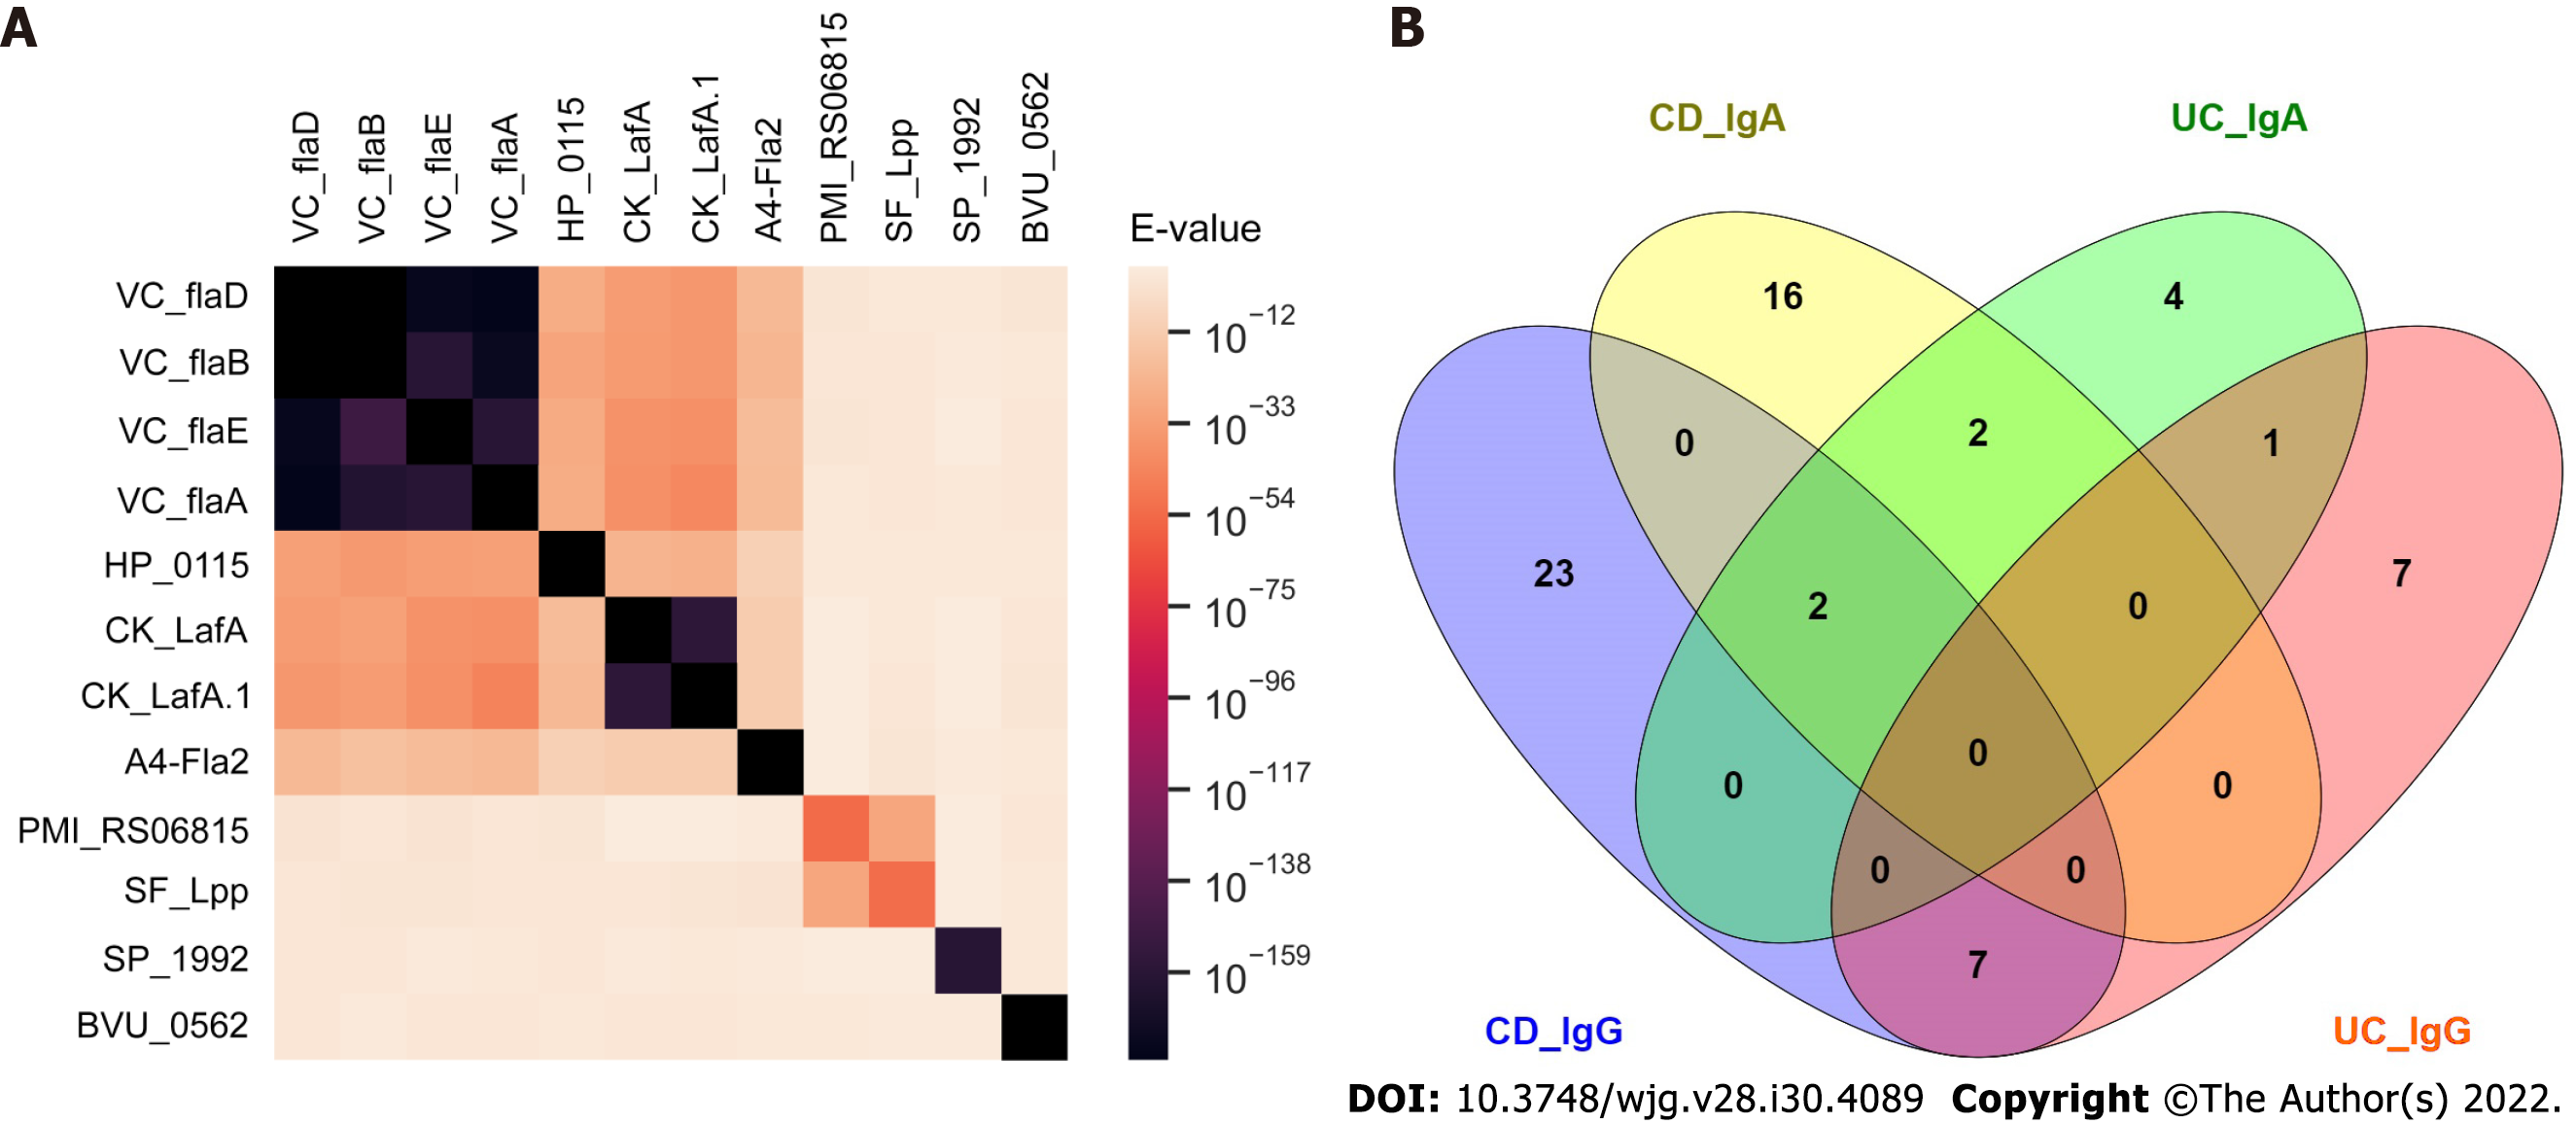
Figure 2 Sequence homology of target antigens of validated antibodies and overlap of antibodies among Crohn’s disease and ulcerative colitis.
A: Heatmap showing sequence homology among target antigens for antibodies with validated performance of ≥ 14% sensitivity at 96% specificity comparing Crohn’s disease (CD) patients with healthy controls; B: CD_IgG, ulcerative colitis (UC)_IgG, CD_IgA and UC_IgG represent the overlap of anti-microbial antibodies of IgG and IgA isotypes in CD and UC patients with ≥ 14% sensitivity at 96% specificity against healthy controls in the discovery set. CD: Crohn’s disease; UC: Ulcerative colitis.
Figure 3 Receiver operating characteristic curves to discriminate Crohn’s disease, ulcerative colitis, and healthy controls.
A: Receiver operating characteristic (ROC) curve for Crohn’s disease (CD) vs healthy controls. Area under the curve (AUC) values of novel anti-flagellin antibodies (HP_0115, CK_LafA, CK_LafA.1, VC_flaD, VC_flaB, VC_flaE, VC_flaA) and anti-non-flagellin antibodies (BVU_0562, SP_1992, PMI_RS06815, SF_Lpp) was 0.73 and 0.75, respectively. The AUC value obtained with a combination of novel anti-flagellin and anti-non-flagellin antibodies was 0.81; B: ROC curve for ulcerative colitis (UC) vs healthy controls. The AUC value obtained with a combination of 7 markers was 0.87; C: ROC curve for CD vs UC. The AUC value obtained with a combination of 7 markers was 0.82.
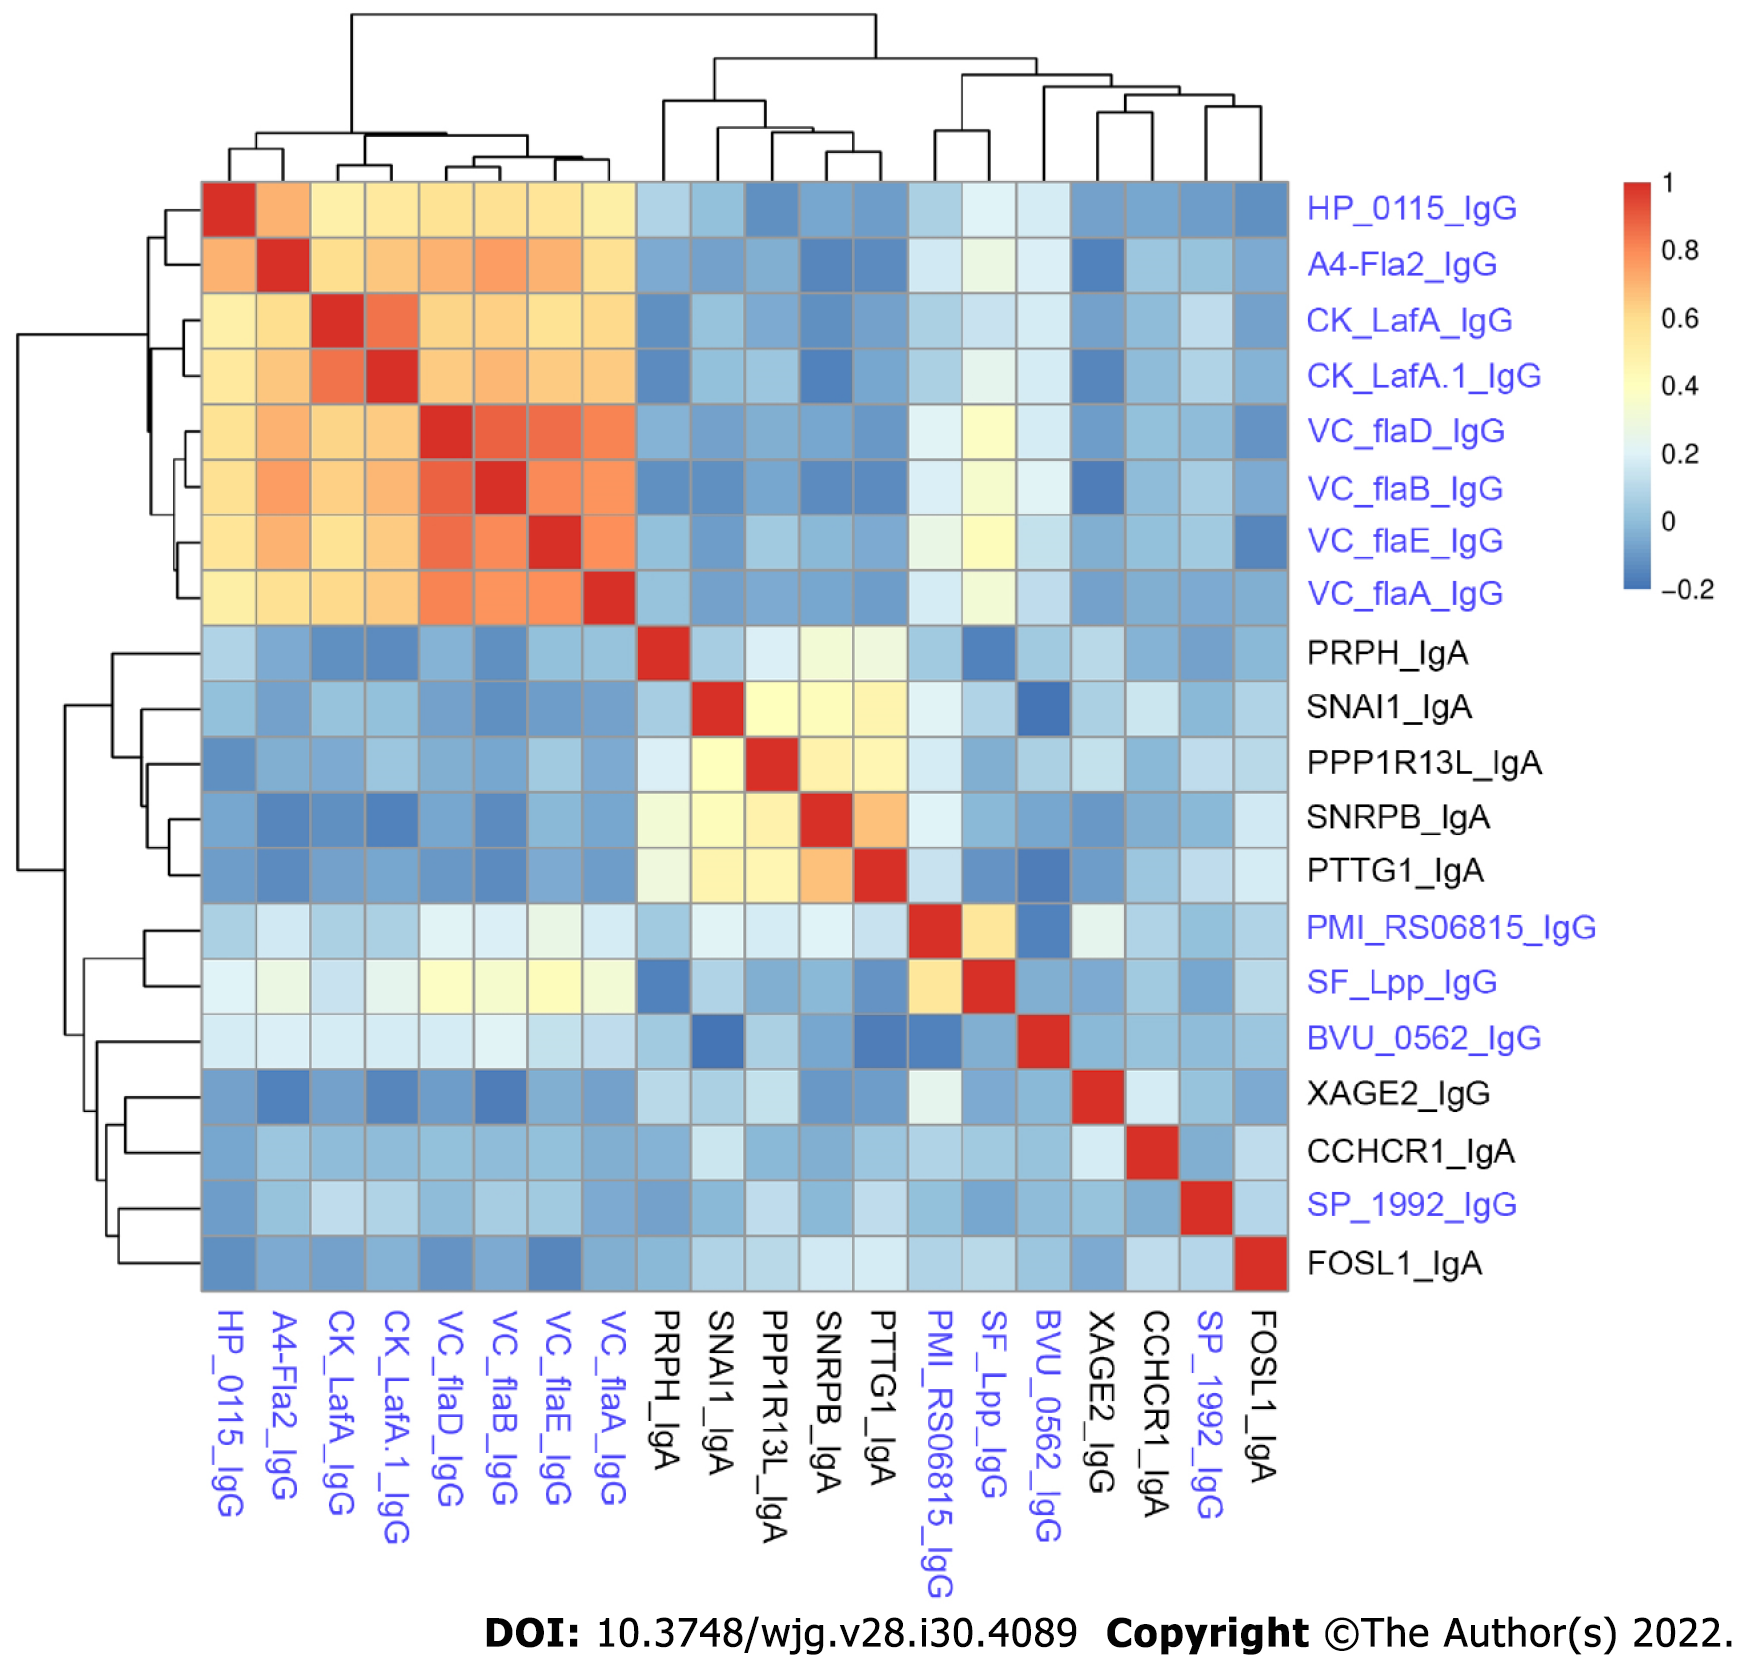
Figure 4 Spearman’s rank correlation coefficient heatmap of anti-microbial antibodies and autoantibodies in Crohn’s disease patients.
The names of anti-microbial antibodies are colored in blue while autoantibodies are colored in black.
- Citation: Shome M, Song L, Williams S, Chung Y, Murugan V, Park JG, Faubion W, Pasha SF, Leighton JA, LaBaer J, Qiu J. Serological profiling of Crohn’s disease and ulcerative colitis patients reveals anti-microbial antibody signatures. World J Gastroenterol 2022; 28(30): 4089-4101
- URL: https://www.wjgnet.com/1007-9327/full/v28/i30/4089.htm
- DOI: https://dx.doi.org/10.3748/wjg.v28.i30.4089


