Copyright
©The Author(s) 2021.
World J Gastroenterol. Nov 21, 2021; 27(43): 7546-7562
Published online Nov 21, 2021. doi: 10.3748/wjg.v27.i43.7546
Published online Nov 21, 2021. doi: 10.3748/wjg.v27.i43.7546
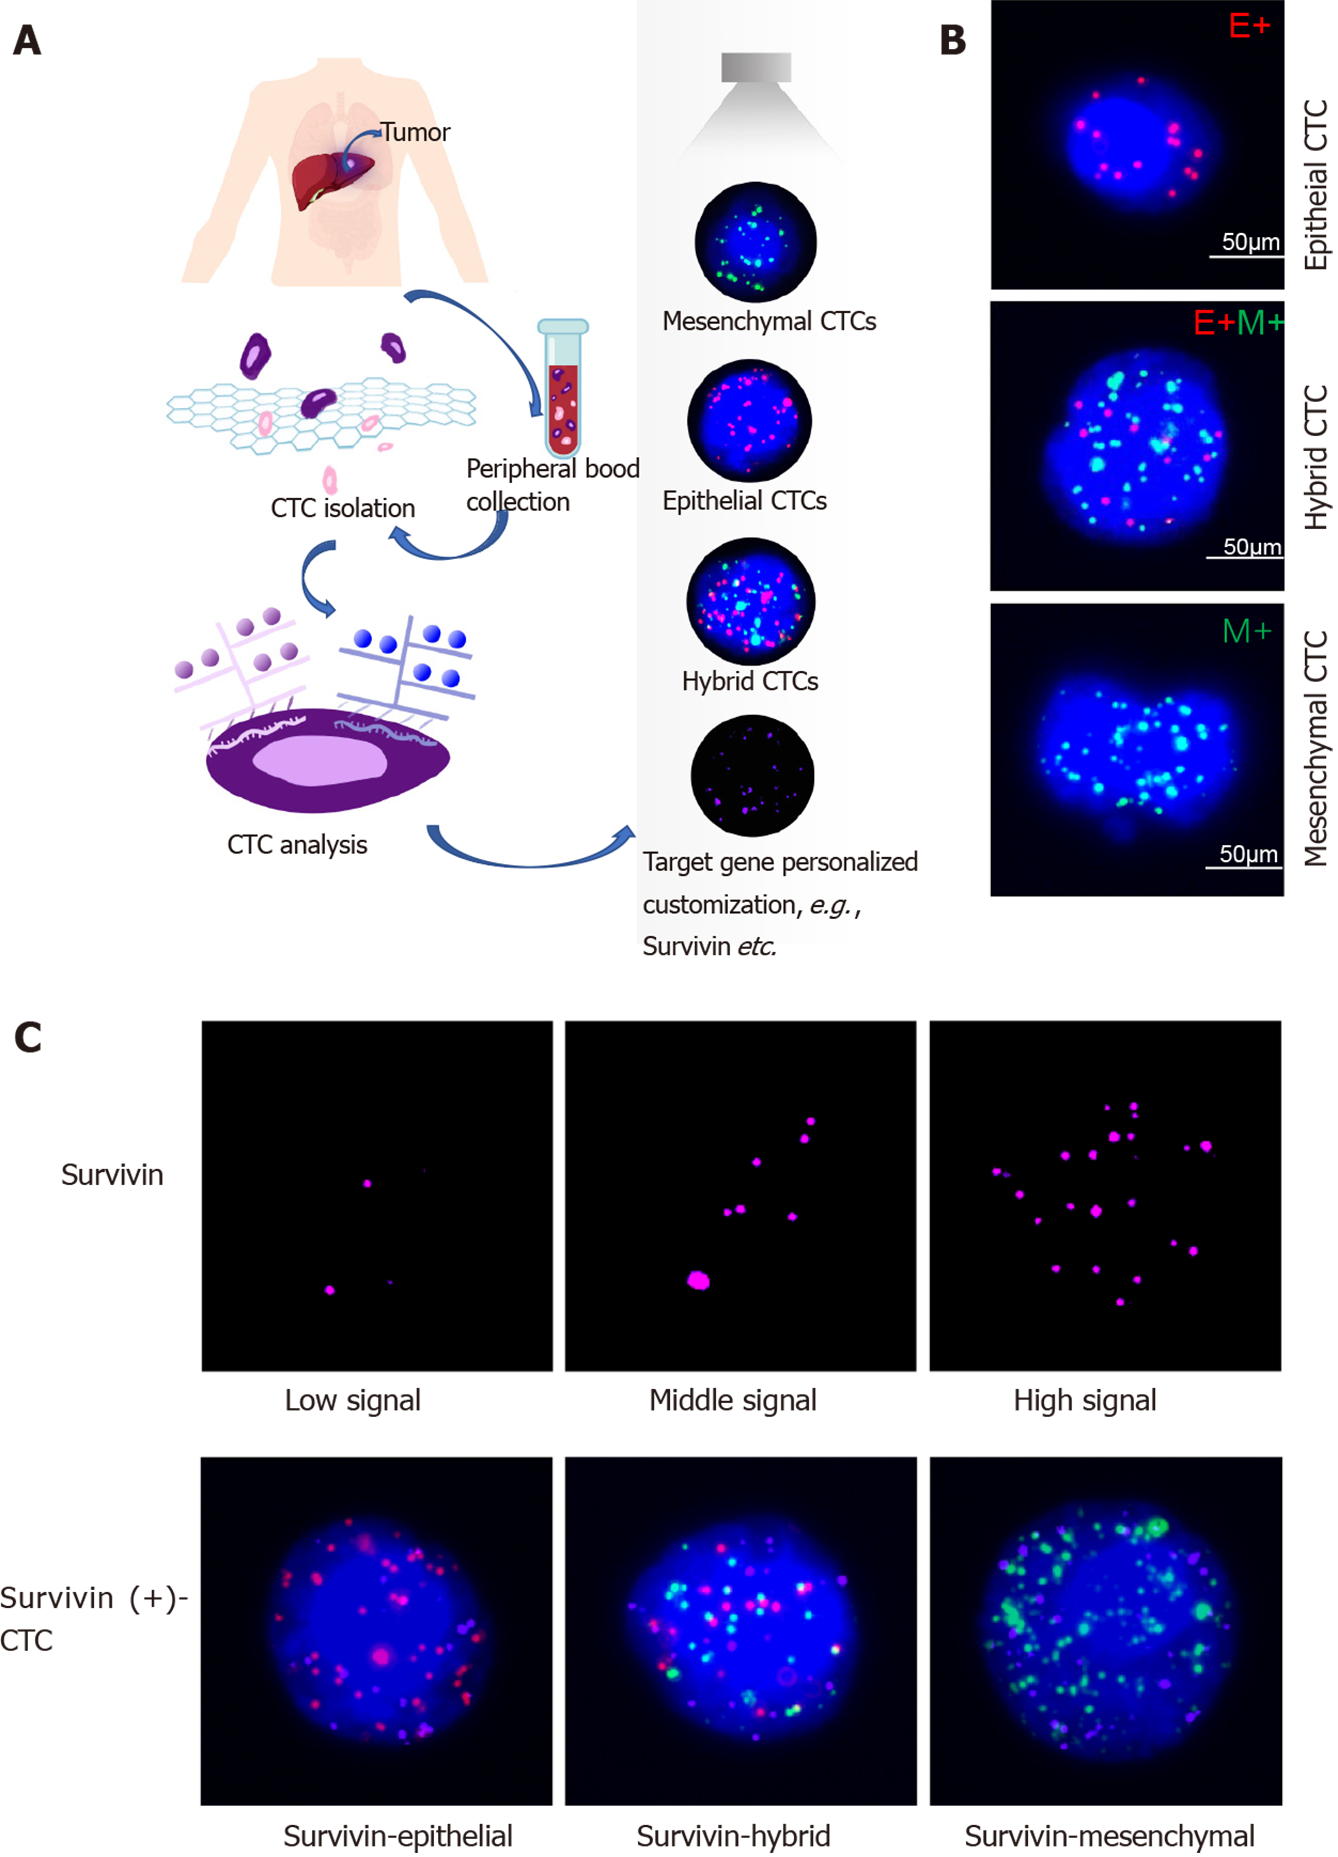
Figure 1 Circulating tumor cell classification and survivin expression in circulating tumor cells by RNA-in situ hybridization.
A: Circulating tumor cell (CTC) isolation and RNA in situ hybridization analysis of blood samples from patients and healthy controls; B: Detection and classification of CTCs using epithelial-mesenchymal transition markers. CD45 was used as a leukocyte marker, and it is indicated by white fluorescence. Epithelial biomarkers (EpCAM and CK8/18/19) were used for epithelial CTCs, which are represented by red fluorescence, and mesenchymal biomarkers (vimentin and Twist) were used for mCTCs, which are represented by green fluorescence; C: Survivin expression in CTCs is indicated by purple fluorescence (Alexa Fluor 647), with the intensity scored as low, moderate, and high (left to right images). CTC: Circulating tumor cell. CTC: Circulating tumor cell.
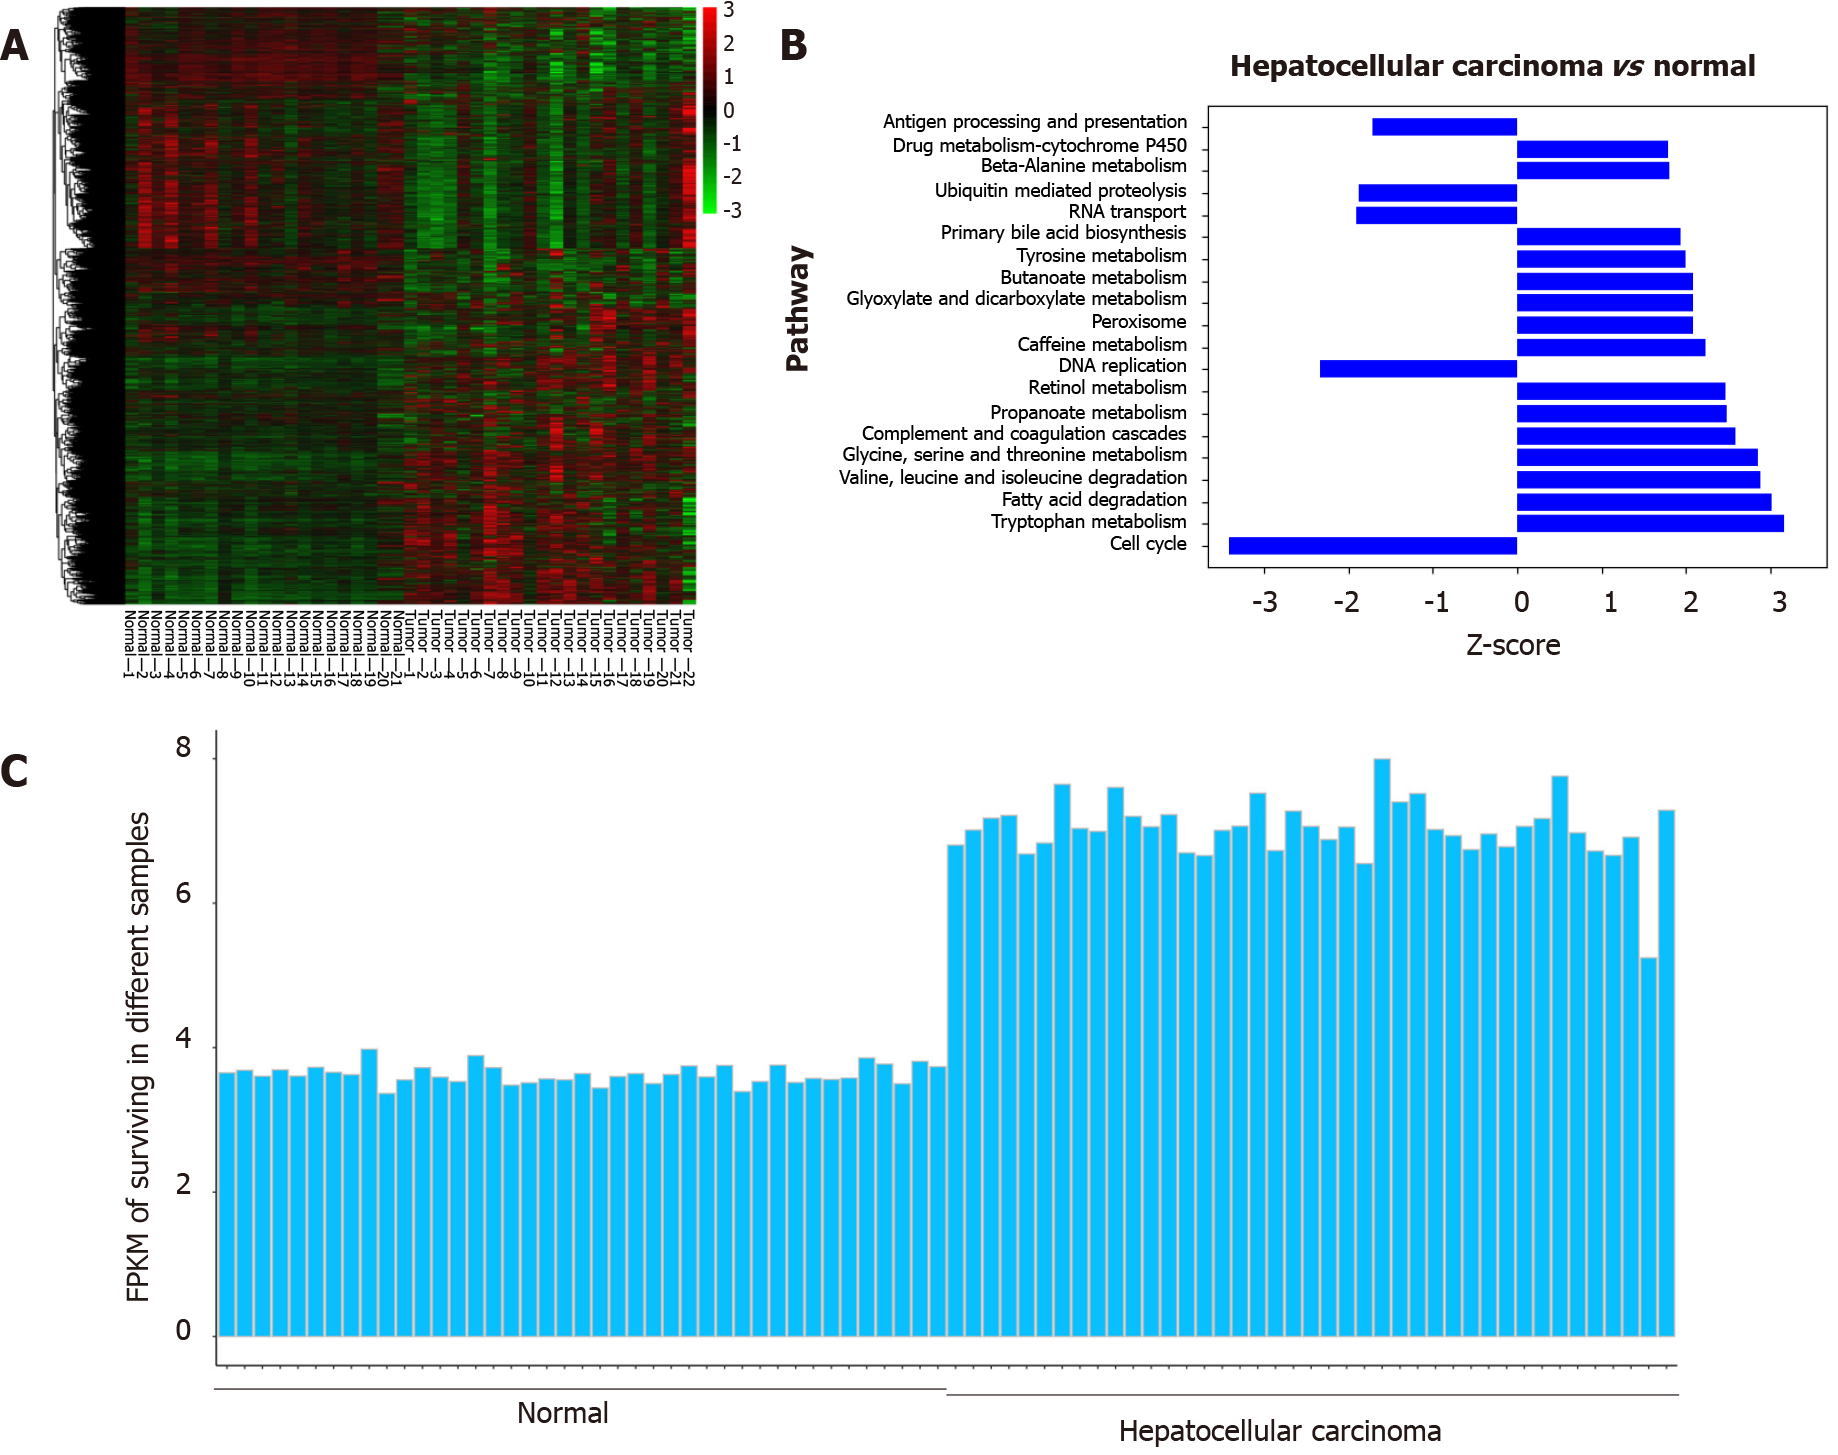
Figure 2 Analysis of survivin gene expression in normal liver tissue and hepatocellular cancer tissue from previously reported genome data.
A: The expression patterns in 21 normal tissue samples and 22 hepatocellular carcinoma samples were analyzed by hierarchical clustering; B: Ingenuity pathway analysis was used to identify the upregulated pathways (Z-score > 0) and the downregulated pathways (Z-score < 0) in the normal tissue samples and hepatocellular cancer (HCC) samples; C: The FPKM (fragments per kilobase of transcript per million fragments mapped) of survivin was determined for different samples. Compared with normal liver tissue samples, the expression of the survivin gene was upregulated in HCC samples.
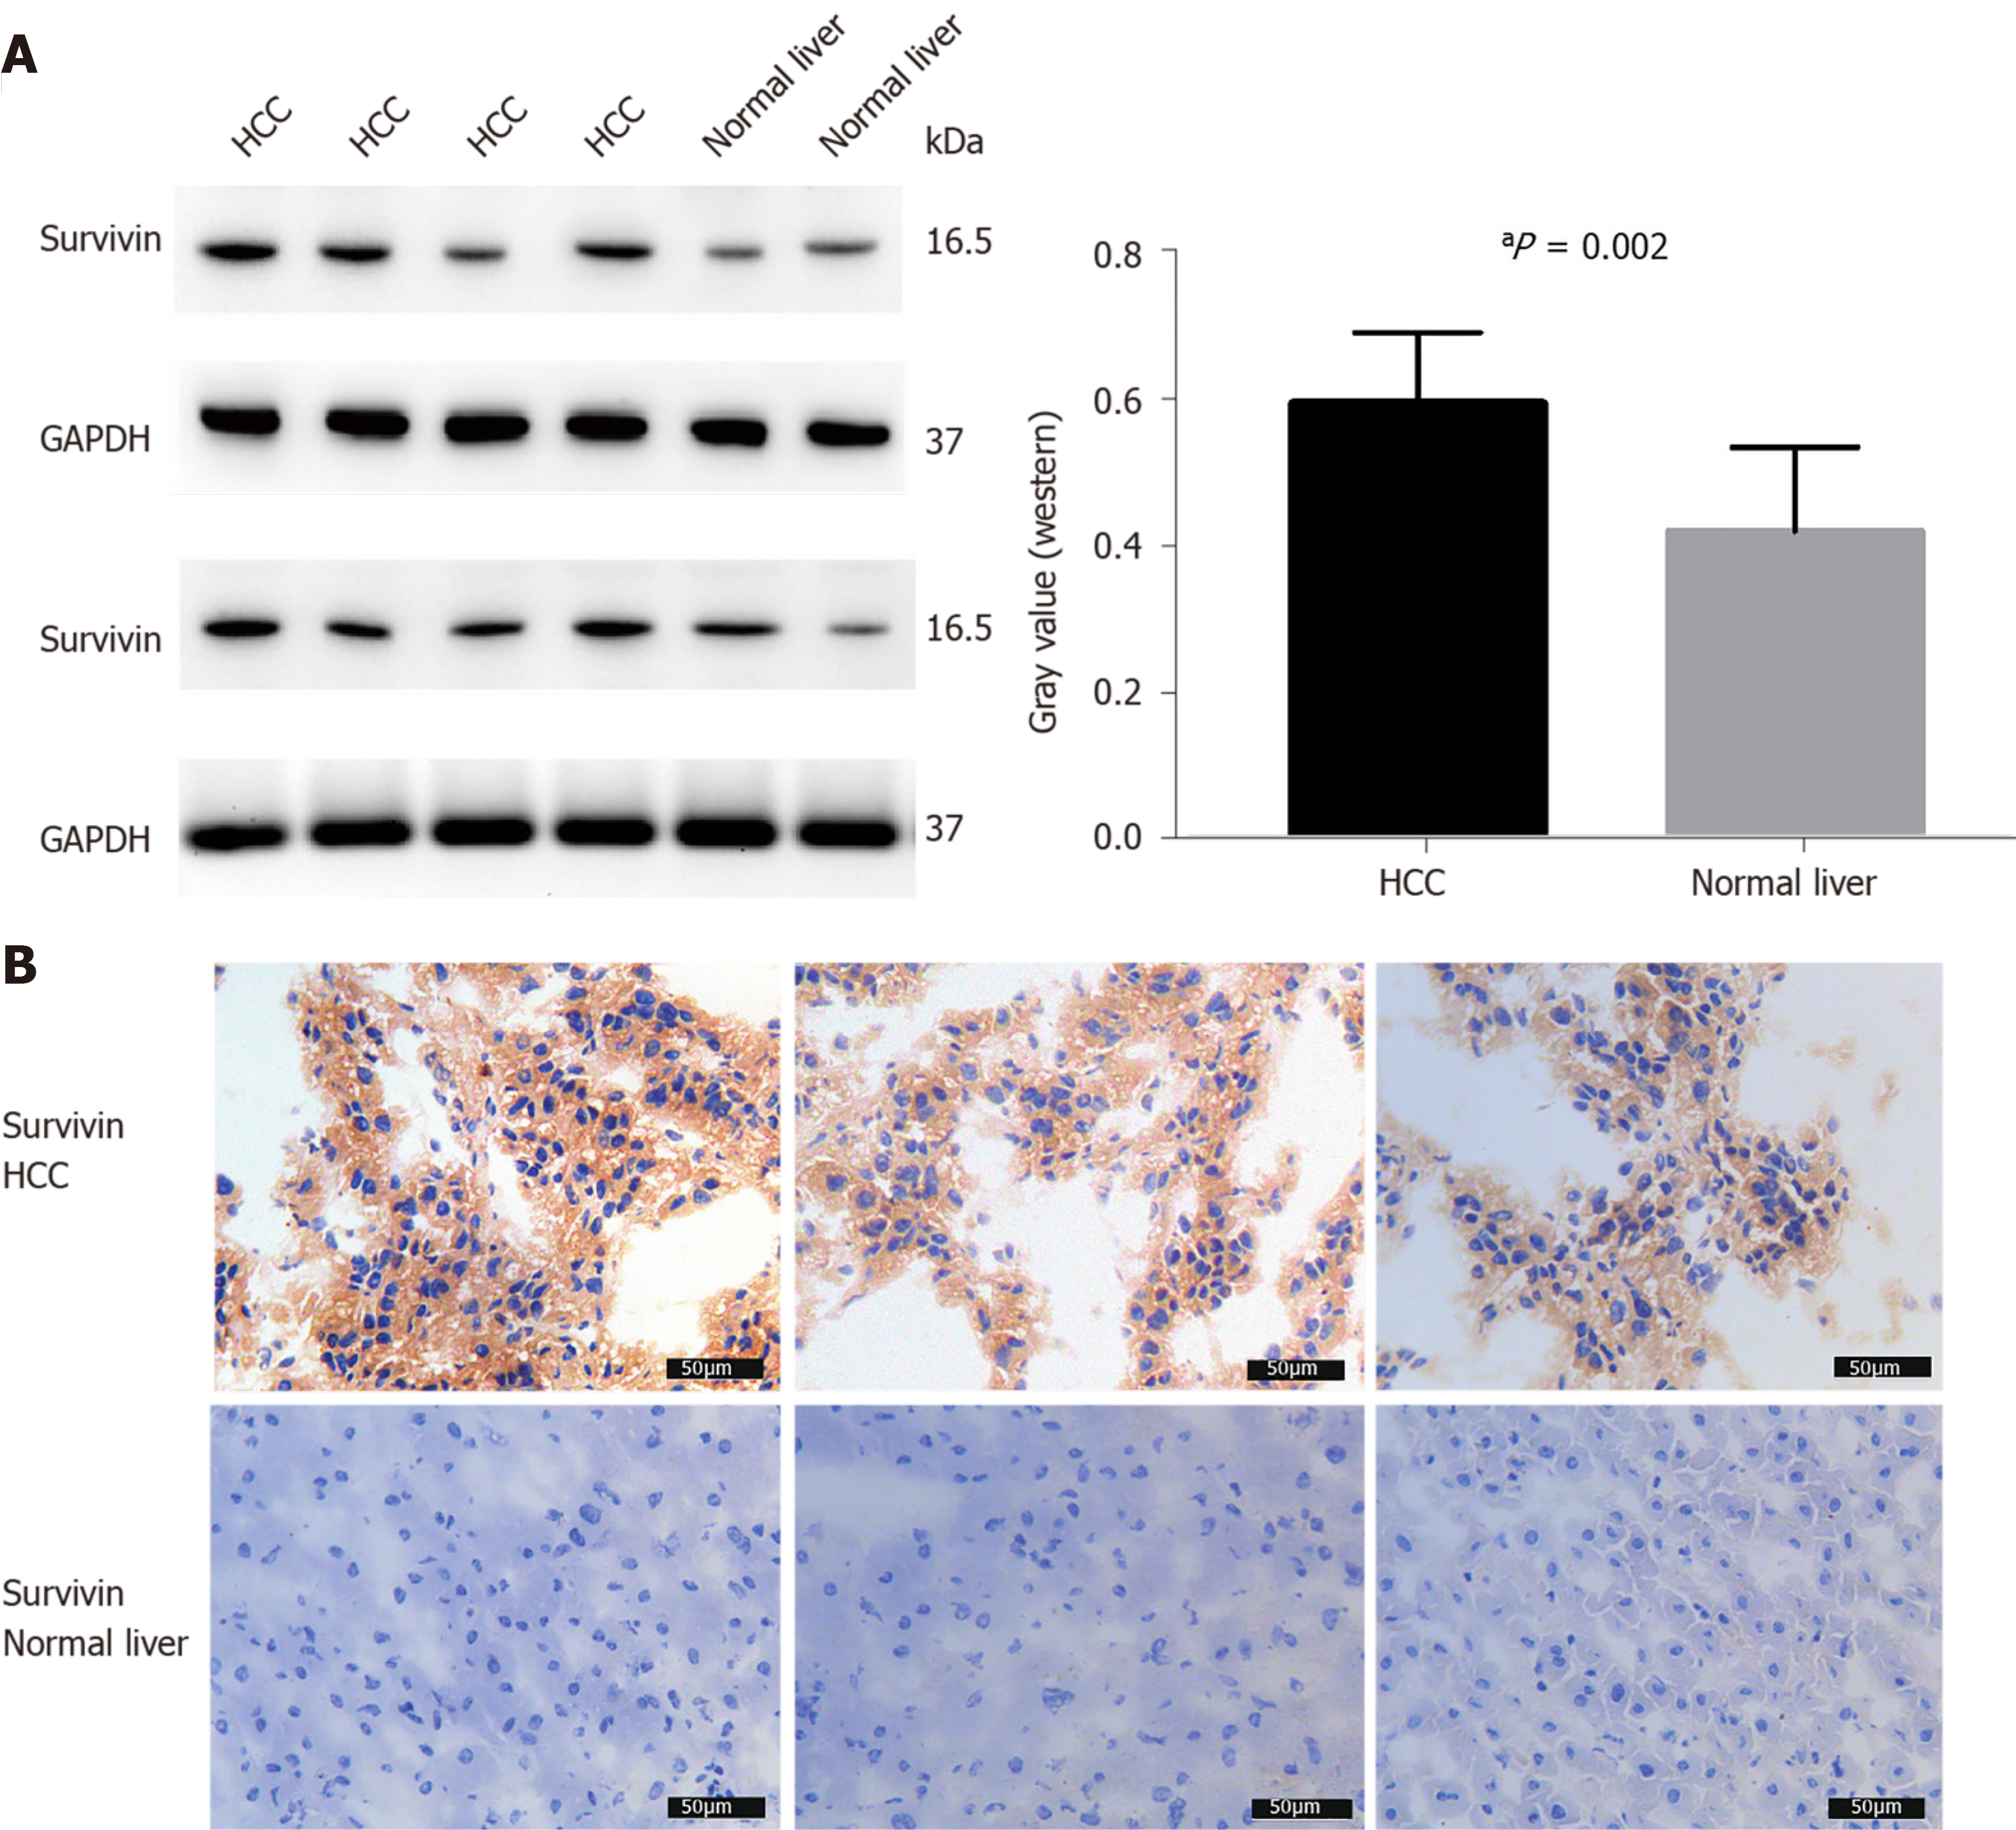
Figure 3 Survivin expression in hepatocellular cancer and normal adjacent tissue samples.
A: Western blot analysis showing the protein expression of survivin in hepatocellular cancer (HCC) (n = 8) and normal liver tissue (n = 4); B: Immunohistochemical staining for survivin in HCC (n = 8) and normal liver tissue (n = 4). Survivin expression was higher in HCC than in normal liver tissue. aP < 0.05. HCC: Hepatocellular cancer.
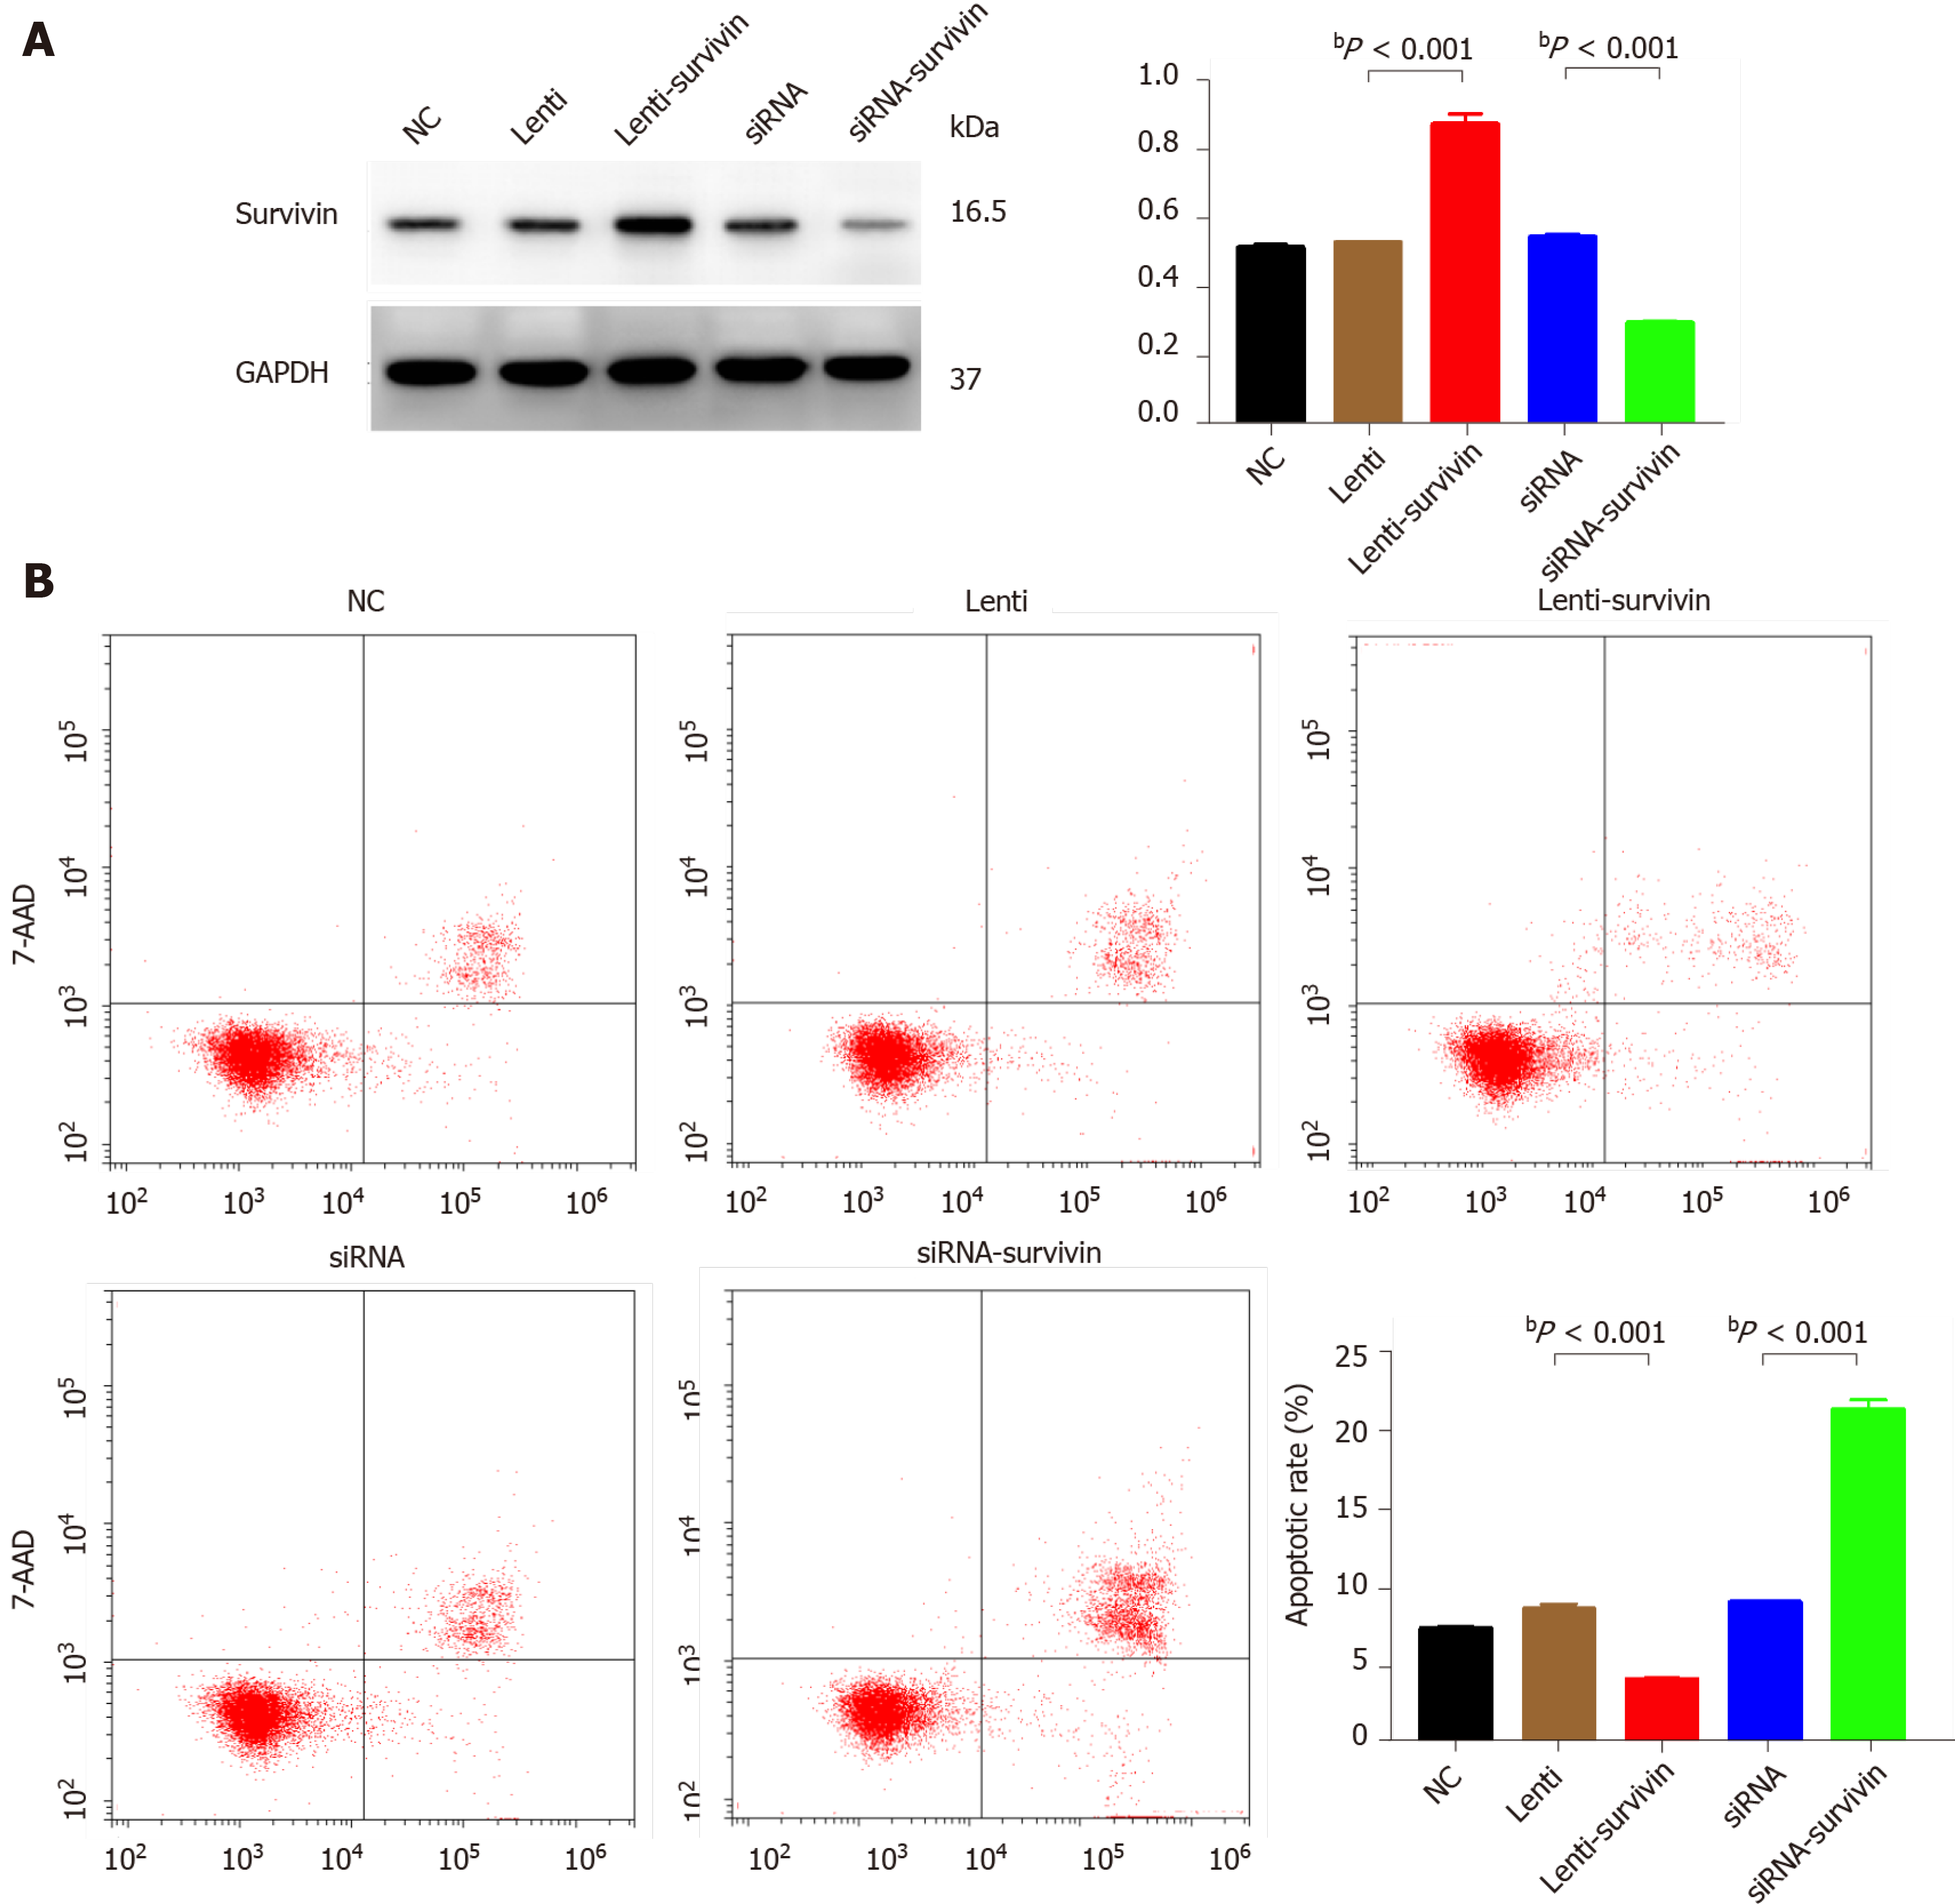
Figure 4 Effect of survivin silencing and overexpression on apoptosis ability of HepG2 cells.
A: Western blot analysis confirming survivin protein knockdown and upregulation in the selected clones (siRNA, siRNA-survivin, Lenti, and Lenti-survivin) and controls; B: Cell apoptosis was detected by flow cytometric analysis (n = 3). The apoptosis rate was significantly lower in the survivin-overexpressing cells (bP < 0.01).
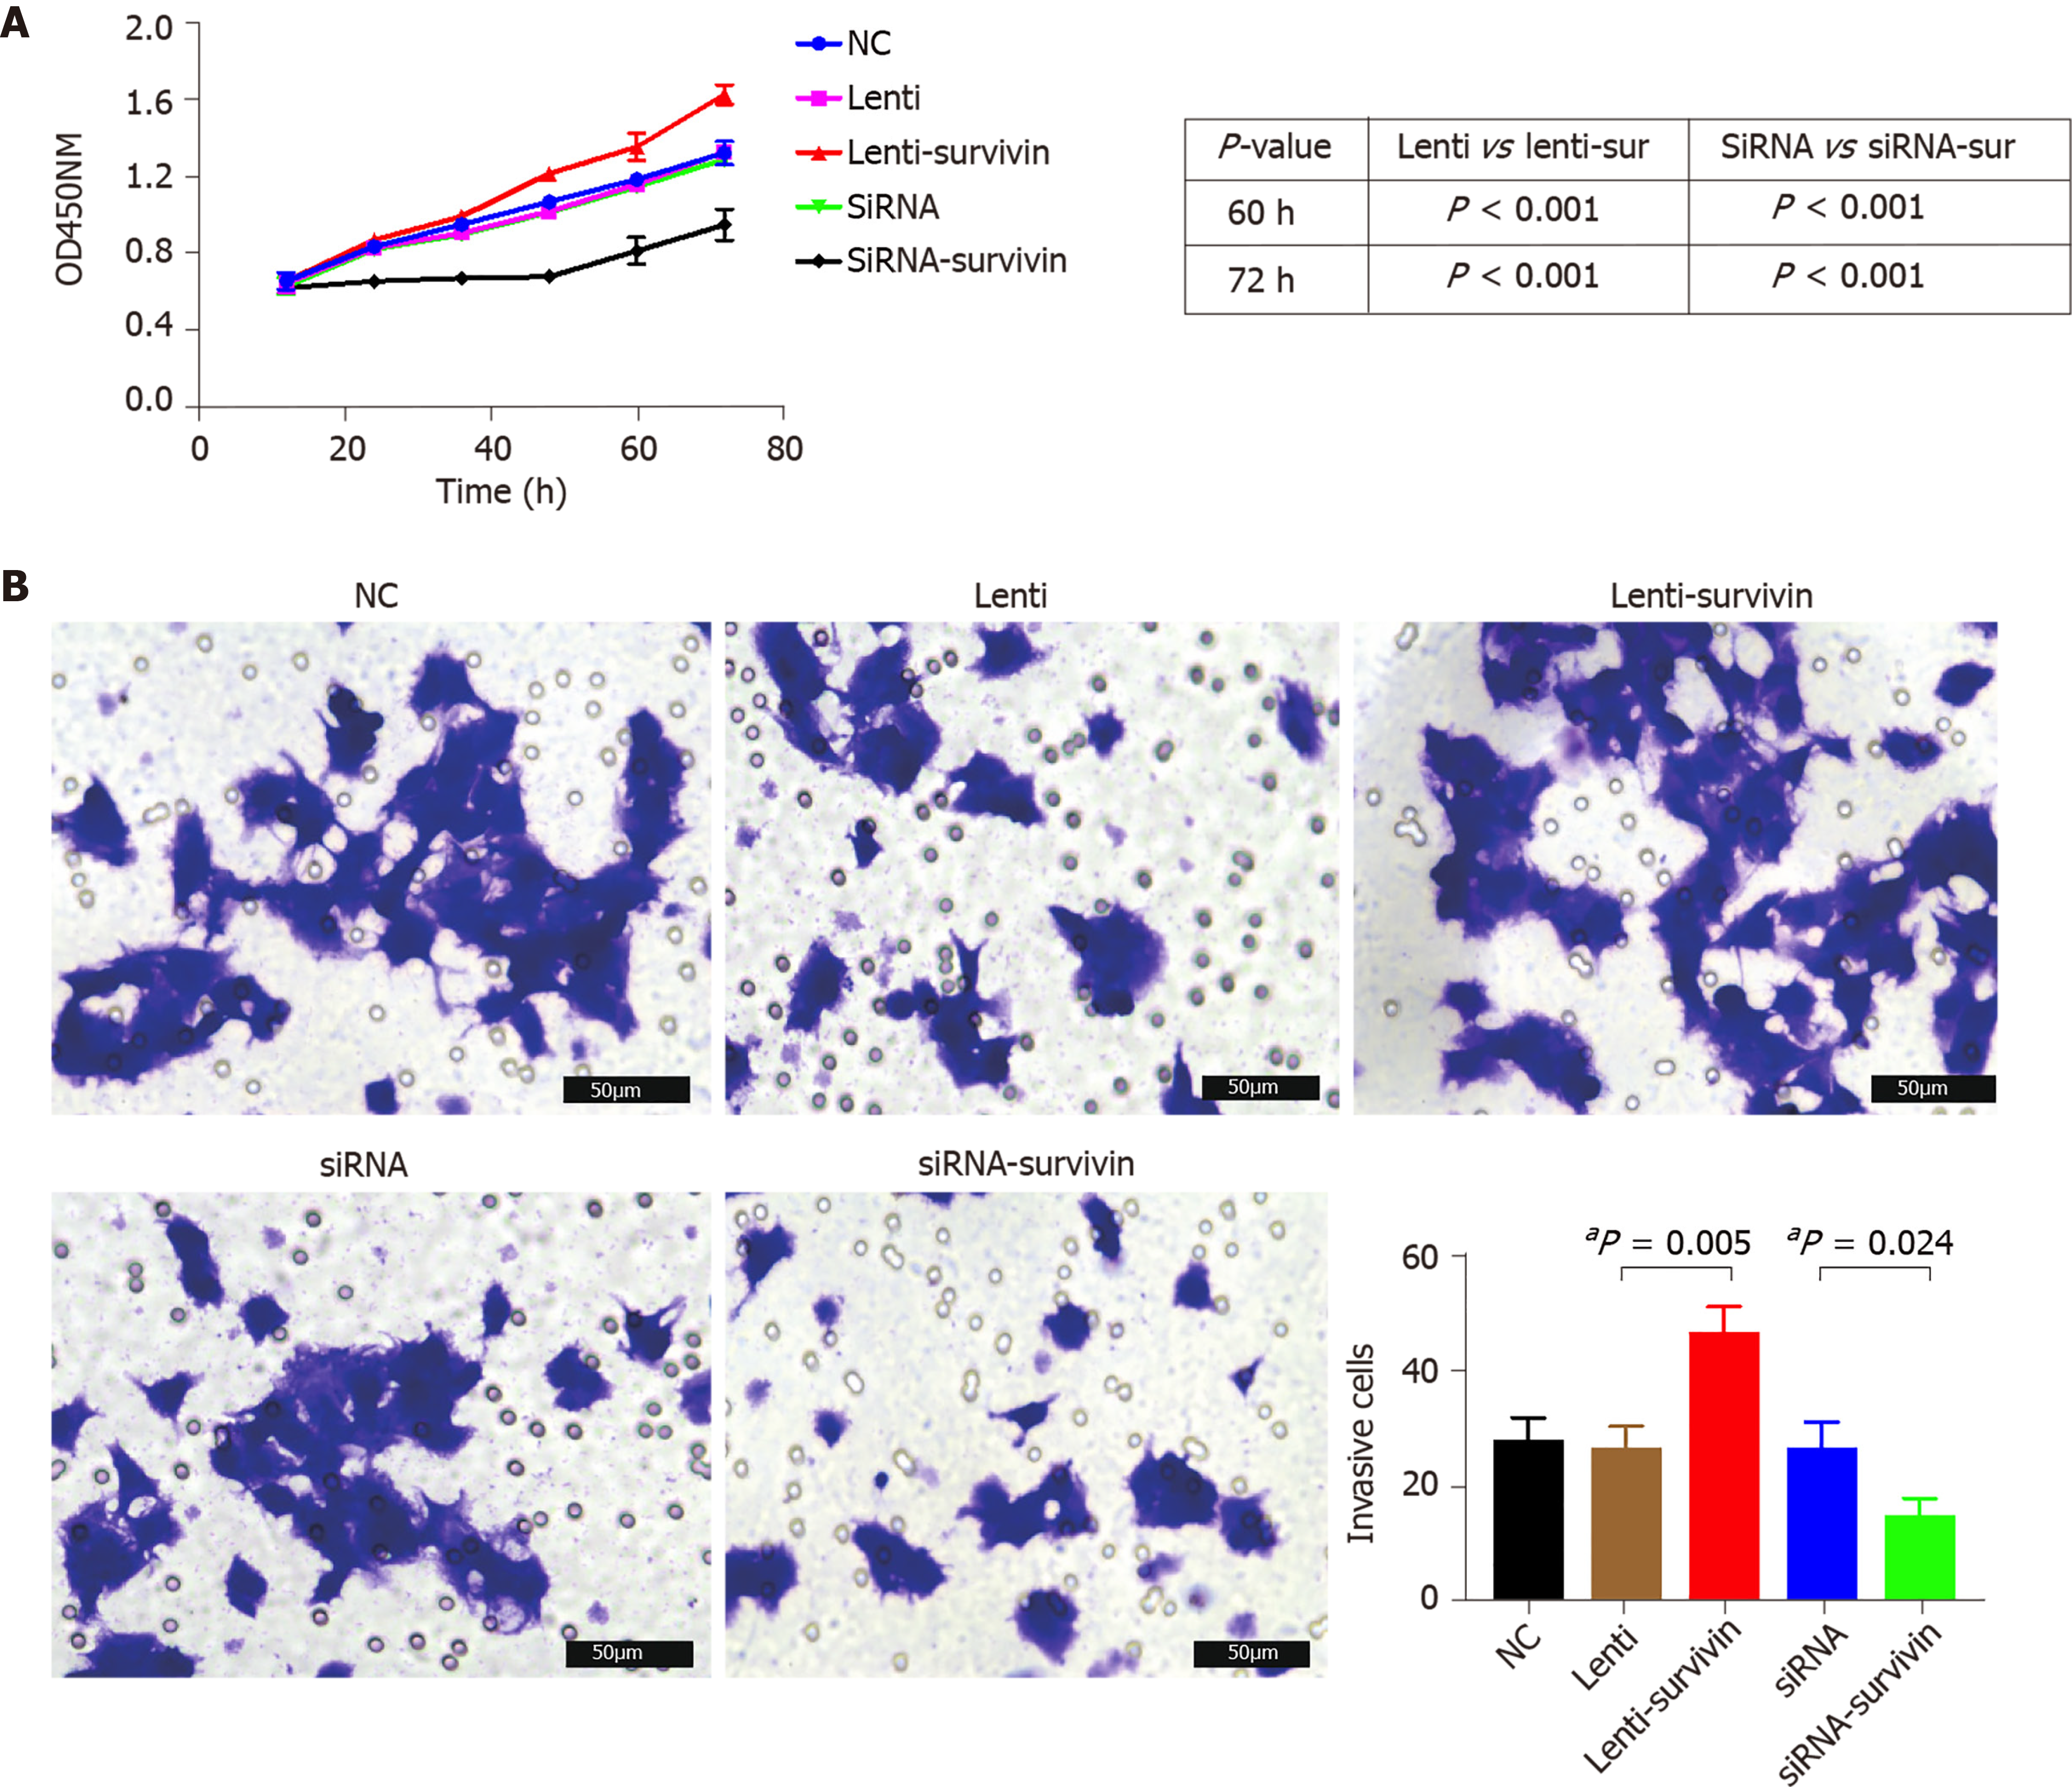
Figure 5 Effect of survivin silencing and overexpression on proliferation and invasion abilities of HepG2 cells.
A: Cell proliferation was evaluated at 12 h, 24 h, 48 h, 60 h, and 72 h after transfection with the siRNA or lentivirus using the CCK8 assay (n = 5), and it was significantly higher in the survivin-overexpressing cells (aP < 0.05); B: Invasion ability of cells was examined by transwell assay (n = 3). The invasive cell count was significantly higher in the survivin-overexpressing cells (aP < 0.05).
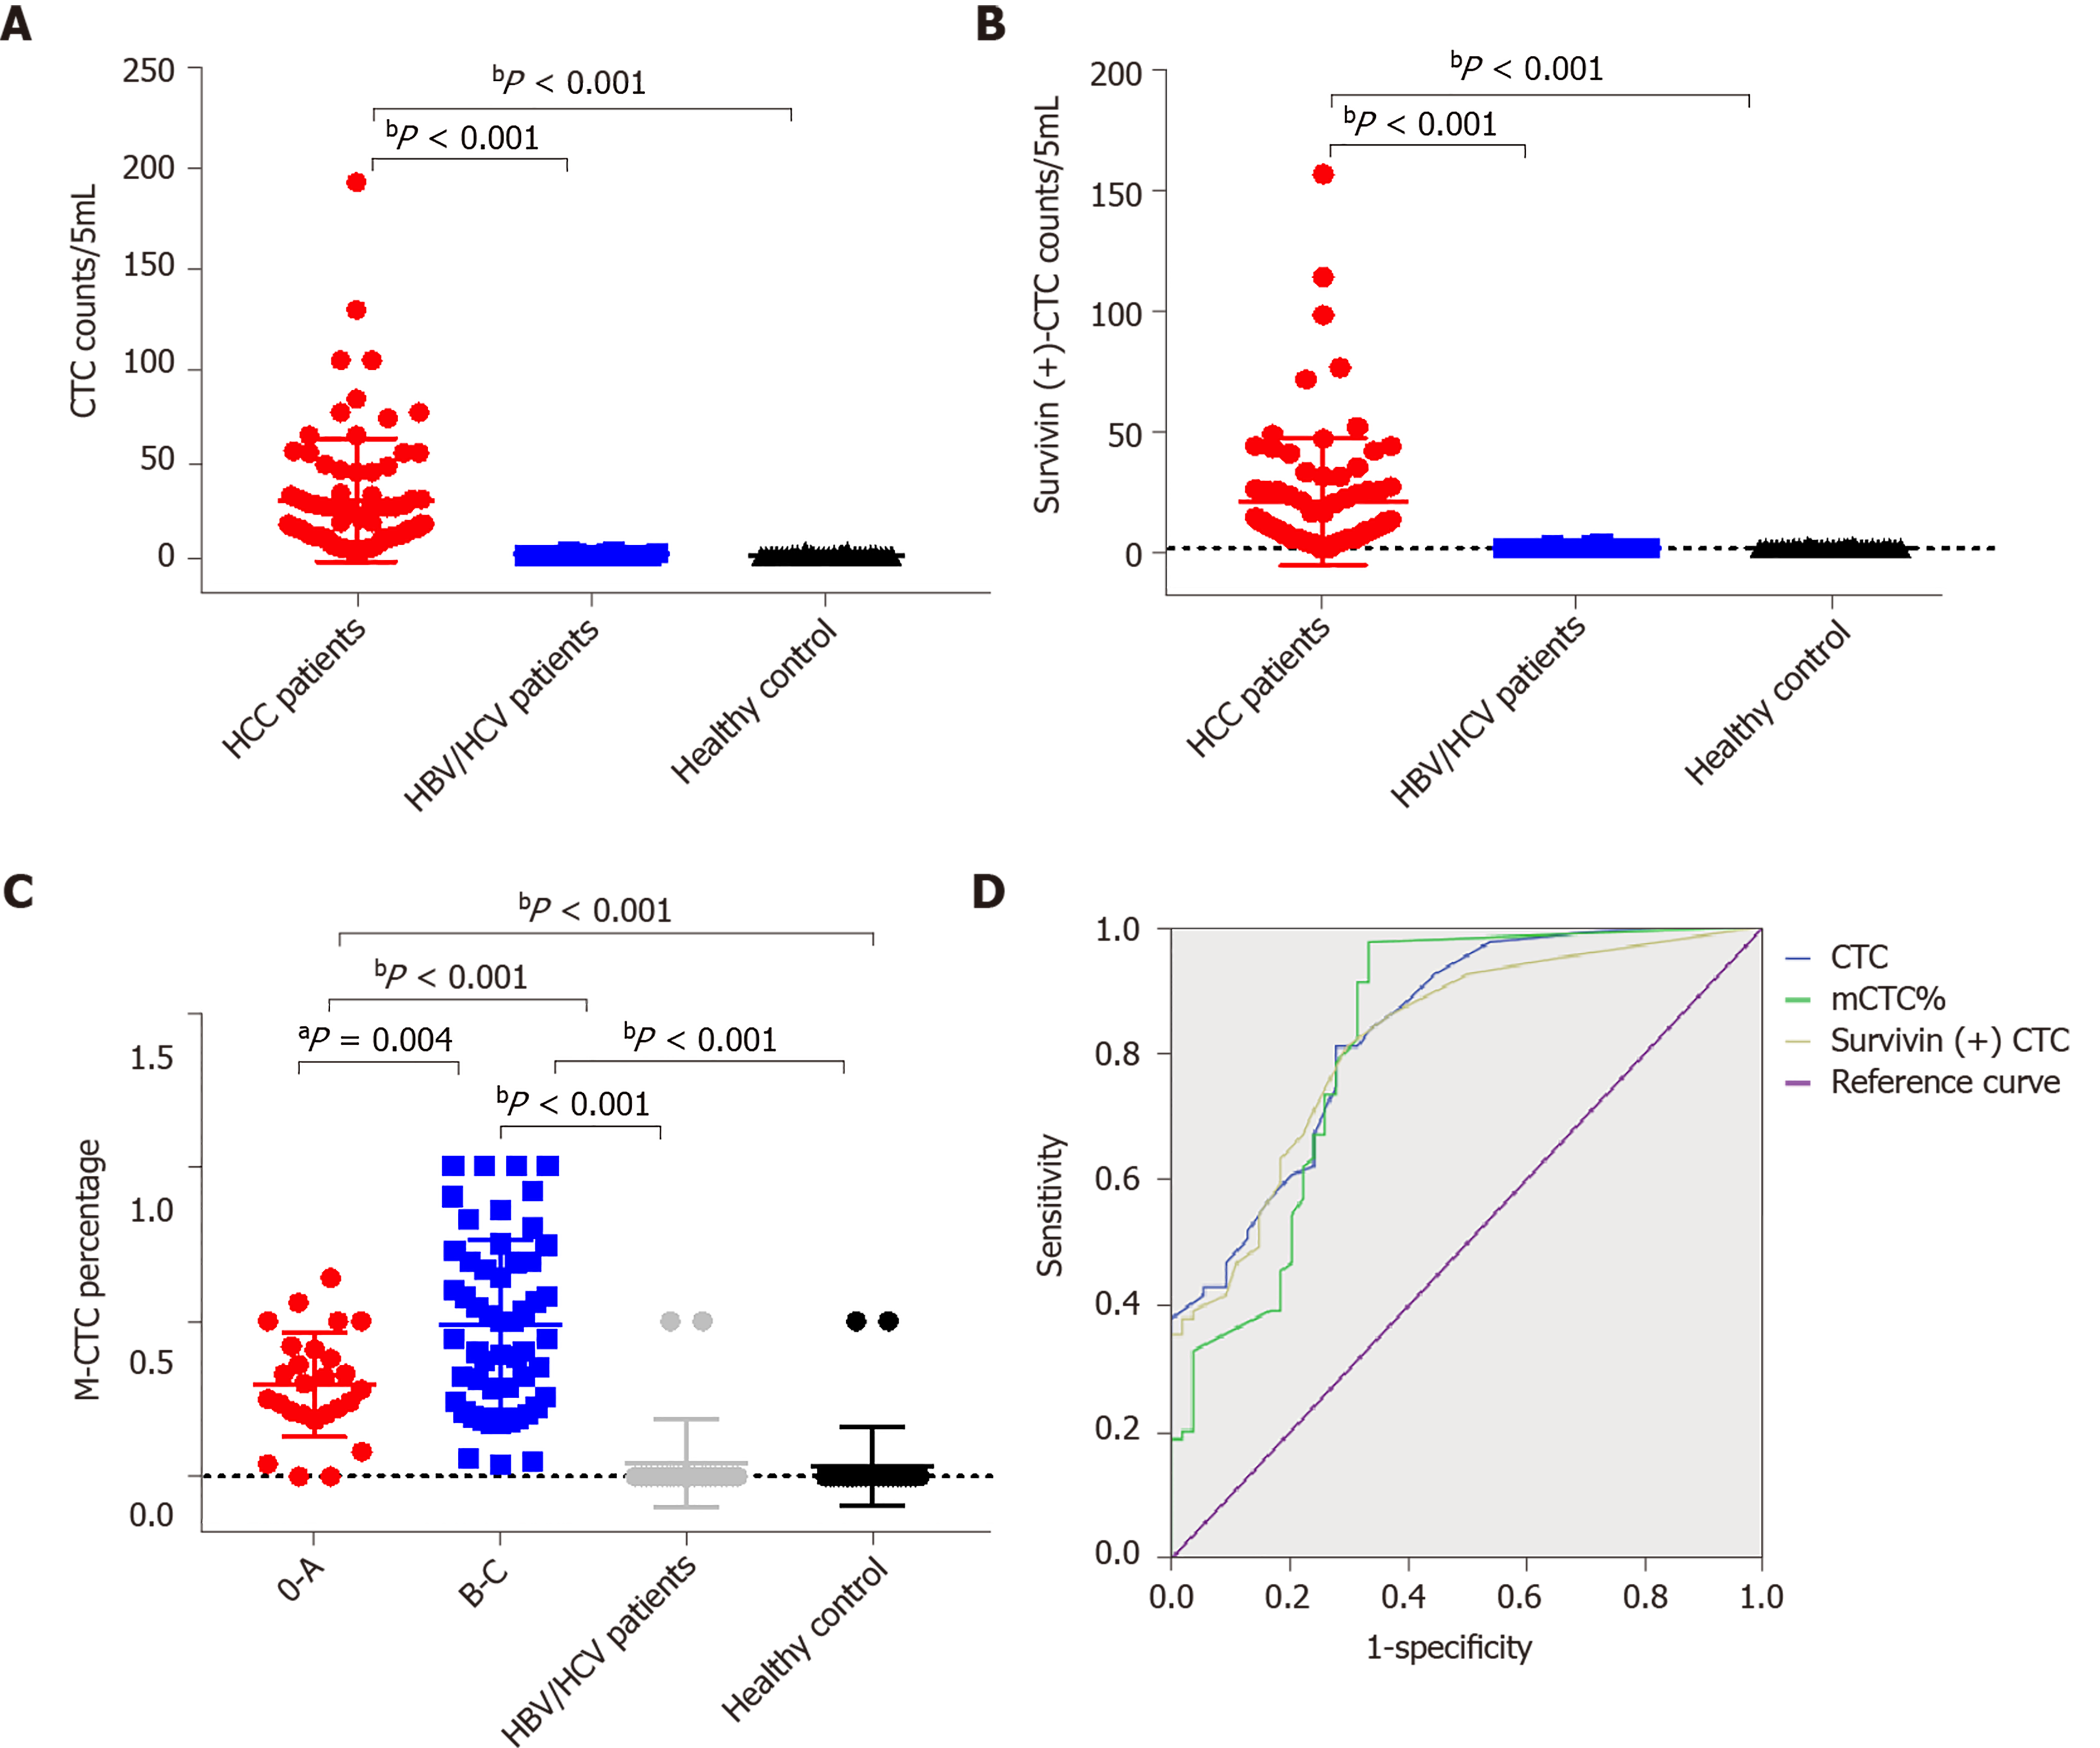
Figure 6 Total circulating tumor cell count and survivin-positive circulating tumor cell count in the study cohort.
A and B: Both the median circulating tumor cell (CTC) count (A) and survivin-positive CTC count (B) in hepatocellular cancer (HCC) patients were significantly higher than those in the HBV/HCV patients and healthy controls; C: The proportion of mesenchymal CTCs (mCTCs) in HCC at the advanced BCLC stage (B-C) was significantly higher than that in HCC at the early stage (0-A); D: ROC curves for survivin-positive CTC count, total CTC count, and mCTC proportion. The rational cut-off for diagnosis was 12 for the CTC count, 4 for the survivin-positive CTC count, and 1.85% for the mCTC proportion. aP < 0.05; bP < 0.01. CTC: Circulating tumor cell.
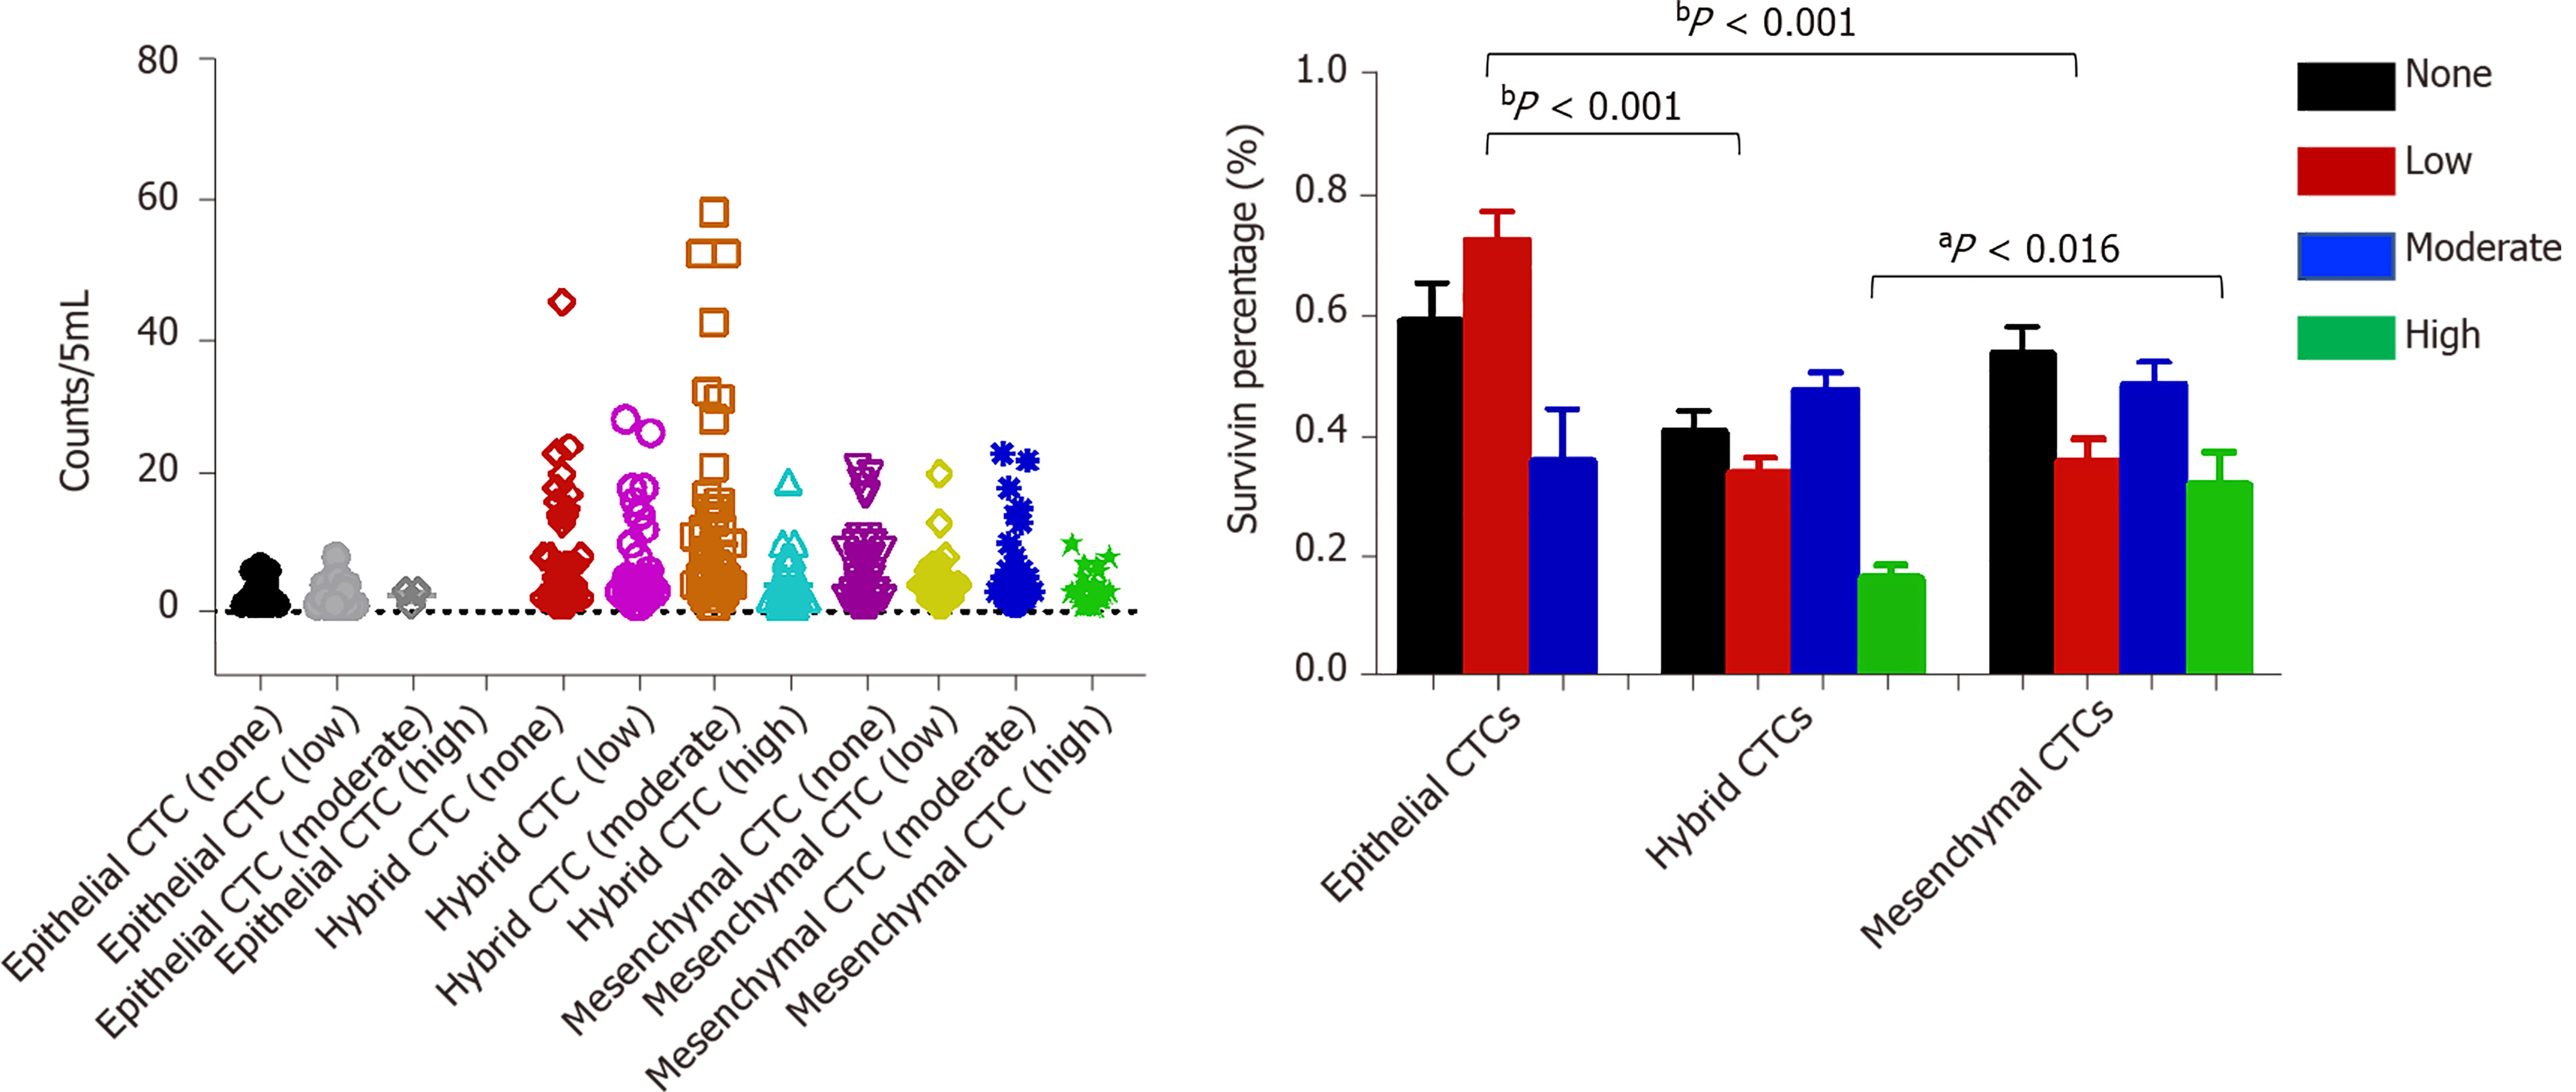
Figure 7 Analysis of survivin gene expression patterns in epithelial, mixed, and mesenchymal circulating tumor cells.
A significantly lower percentage of epithelial circulating tumor cells (CTCs) showed moderate staining intensity than mixed and mesenchymal CTCs (mCTCs), while a significantly higher percentage of epithelial CTCs showed low staining intensity than hybrid and mCTCs. aP < 0.05; bP < 0.01. CTC: Circulating tumor cell.
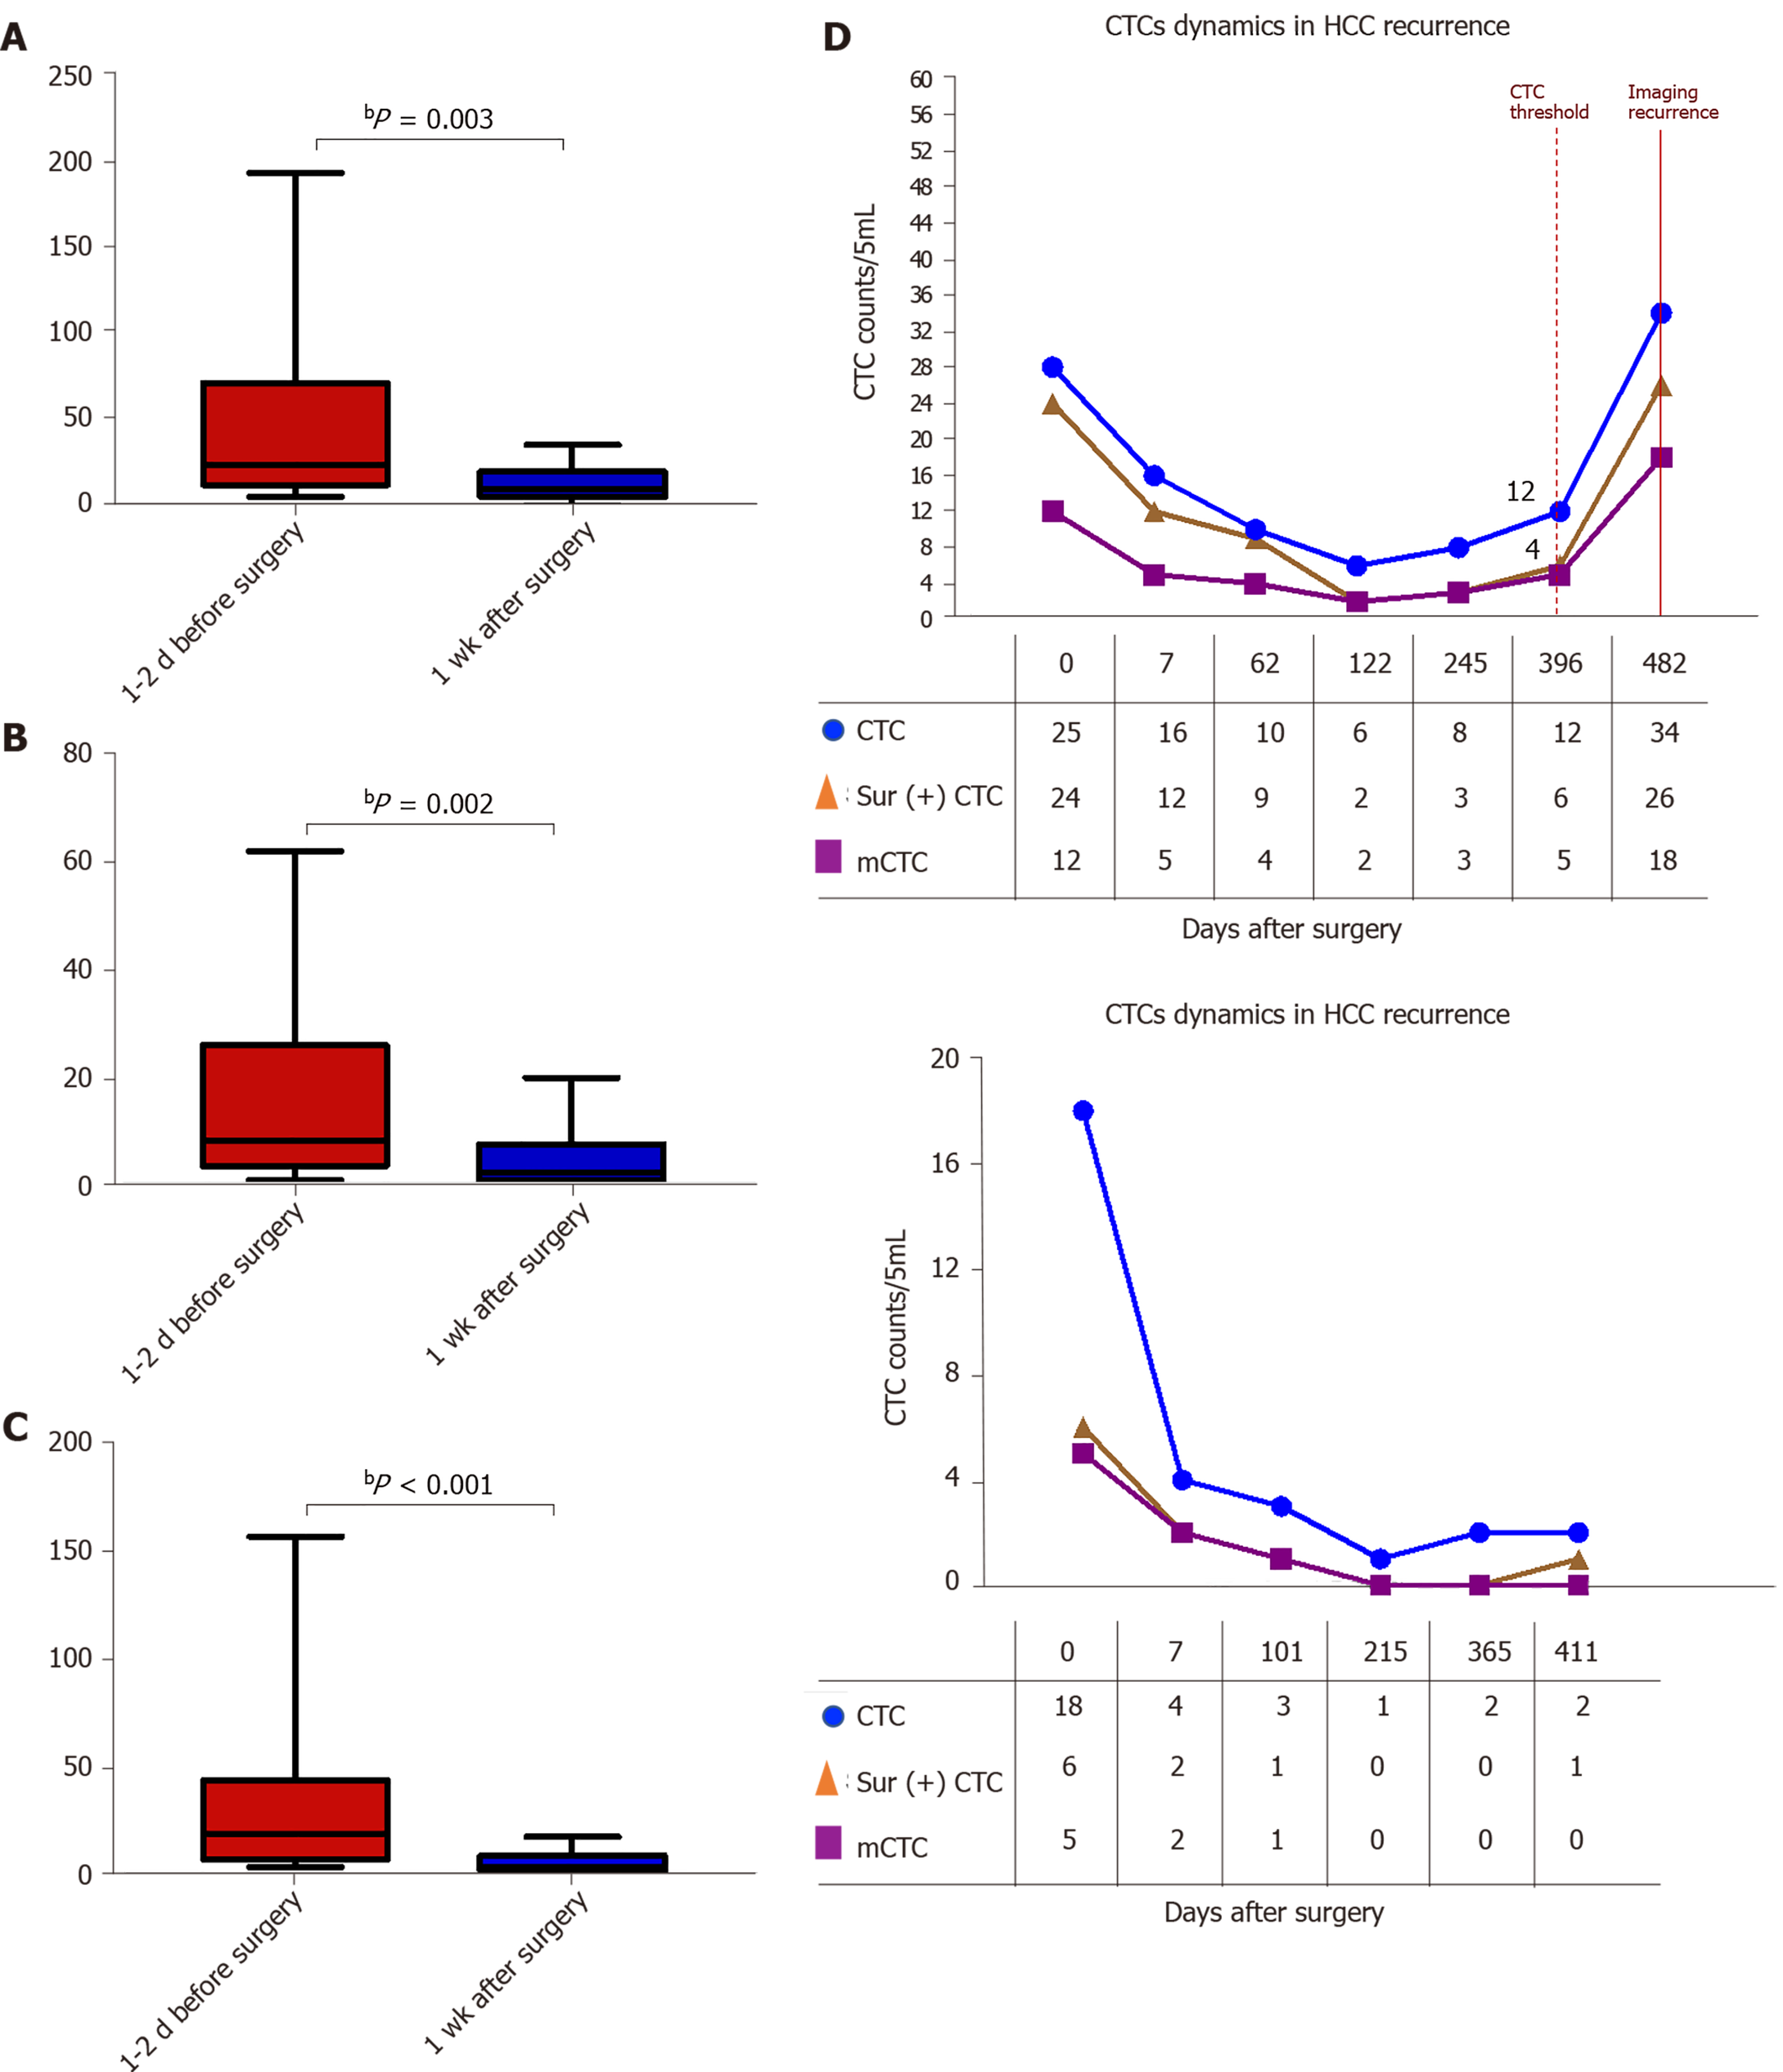
Figure 8 Dynamic changes in circulating tumor cell, mesenchymal circulating tumor cell, and survivin-positive circulating tumor cell counts following surgery.
A-C: The total circulating tumor cell (CTC) count, mesenchymal CTC proportion, and survivin-positive CTC count decreased dramatically 1 wk after resection. D: Increased survivin-positive CTC count in postoperative hepatocellular cancer patients (n = 10) at 1-12 mo before detectable recurrence or appearance of metastatic lesions, and decreased surviving-positive CTC count in the last 12 hepatocellular cancer patients with no recurrence. bP < 0.01. CTC: Circulating tumor cell.
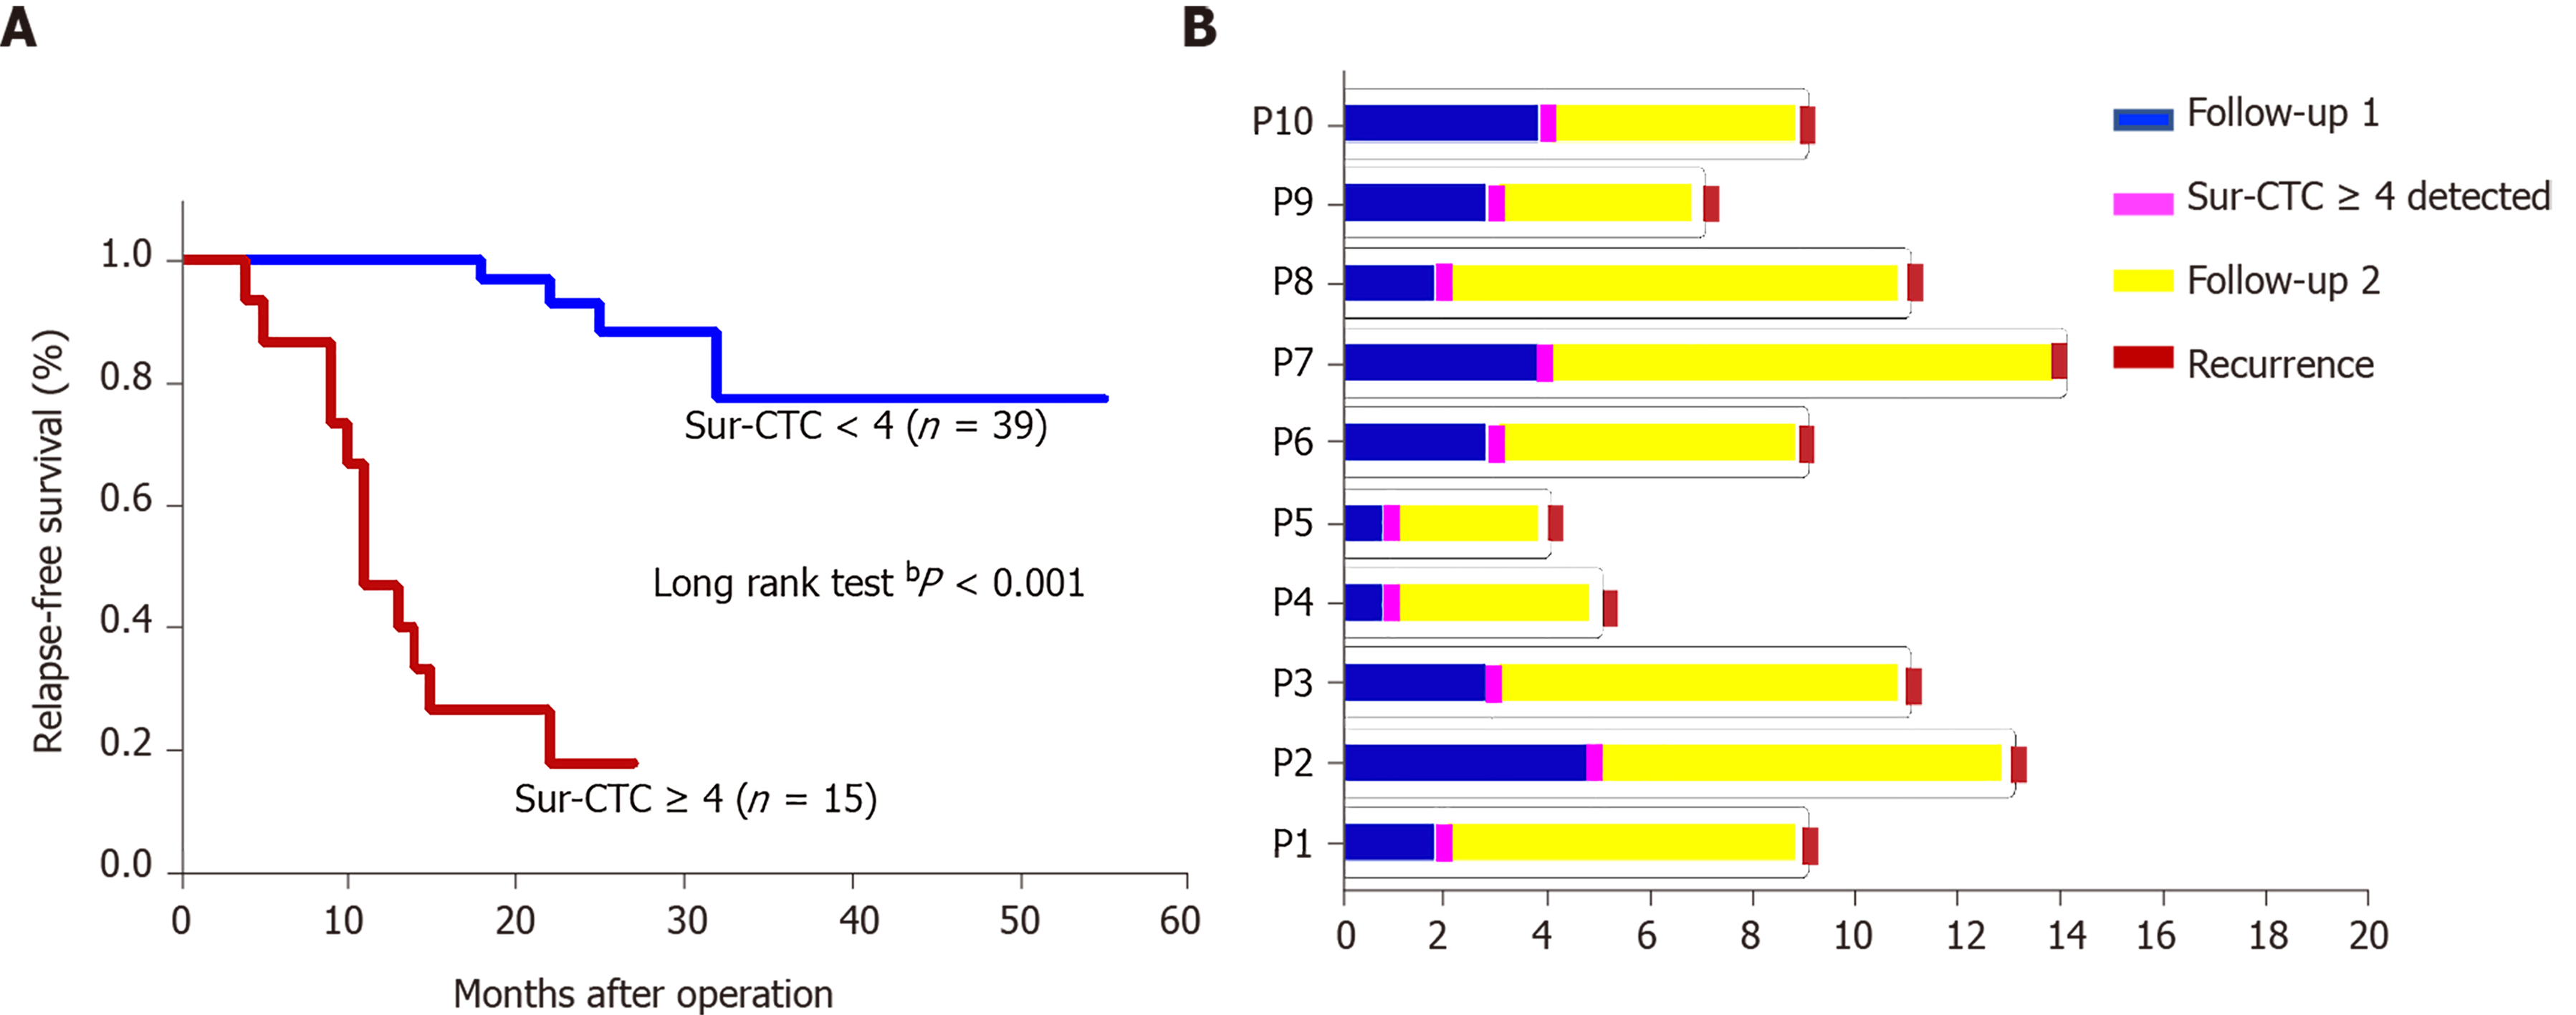
Figure 9 Prognosis of hepatocellular cancer patients with different survivin-positive circulating tumor cell counts.
A: Recurrence free survival time after surgery by change in survivin-positive circulating tumor cell (CTC) count; B: The survivin-positive CTCs detected during follow-up of 10 hepatocellular cancer patients after operation predict tumor recurrence. bP < 0.01. CTC: Circulating tumor cell.
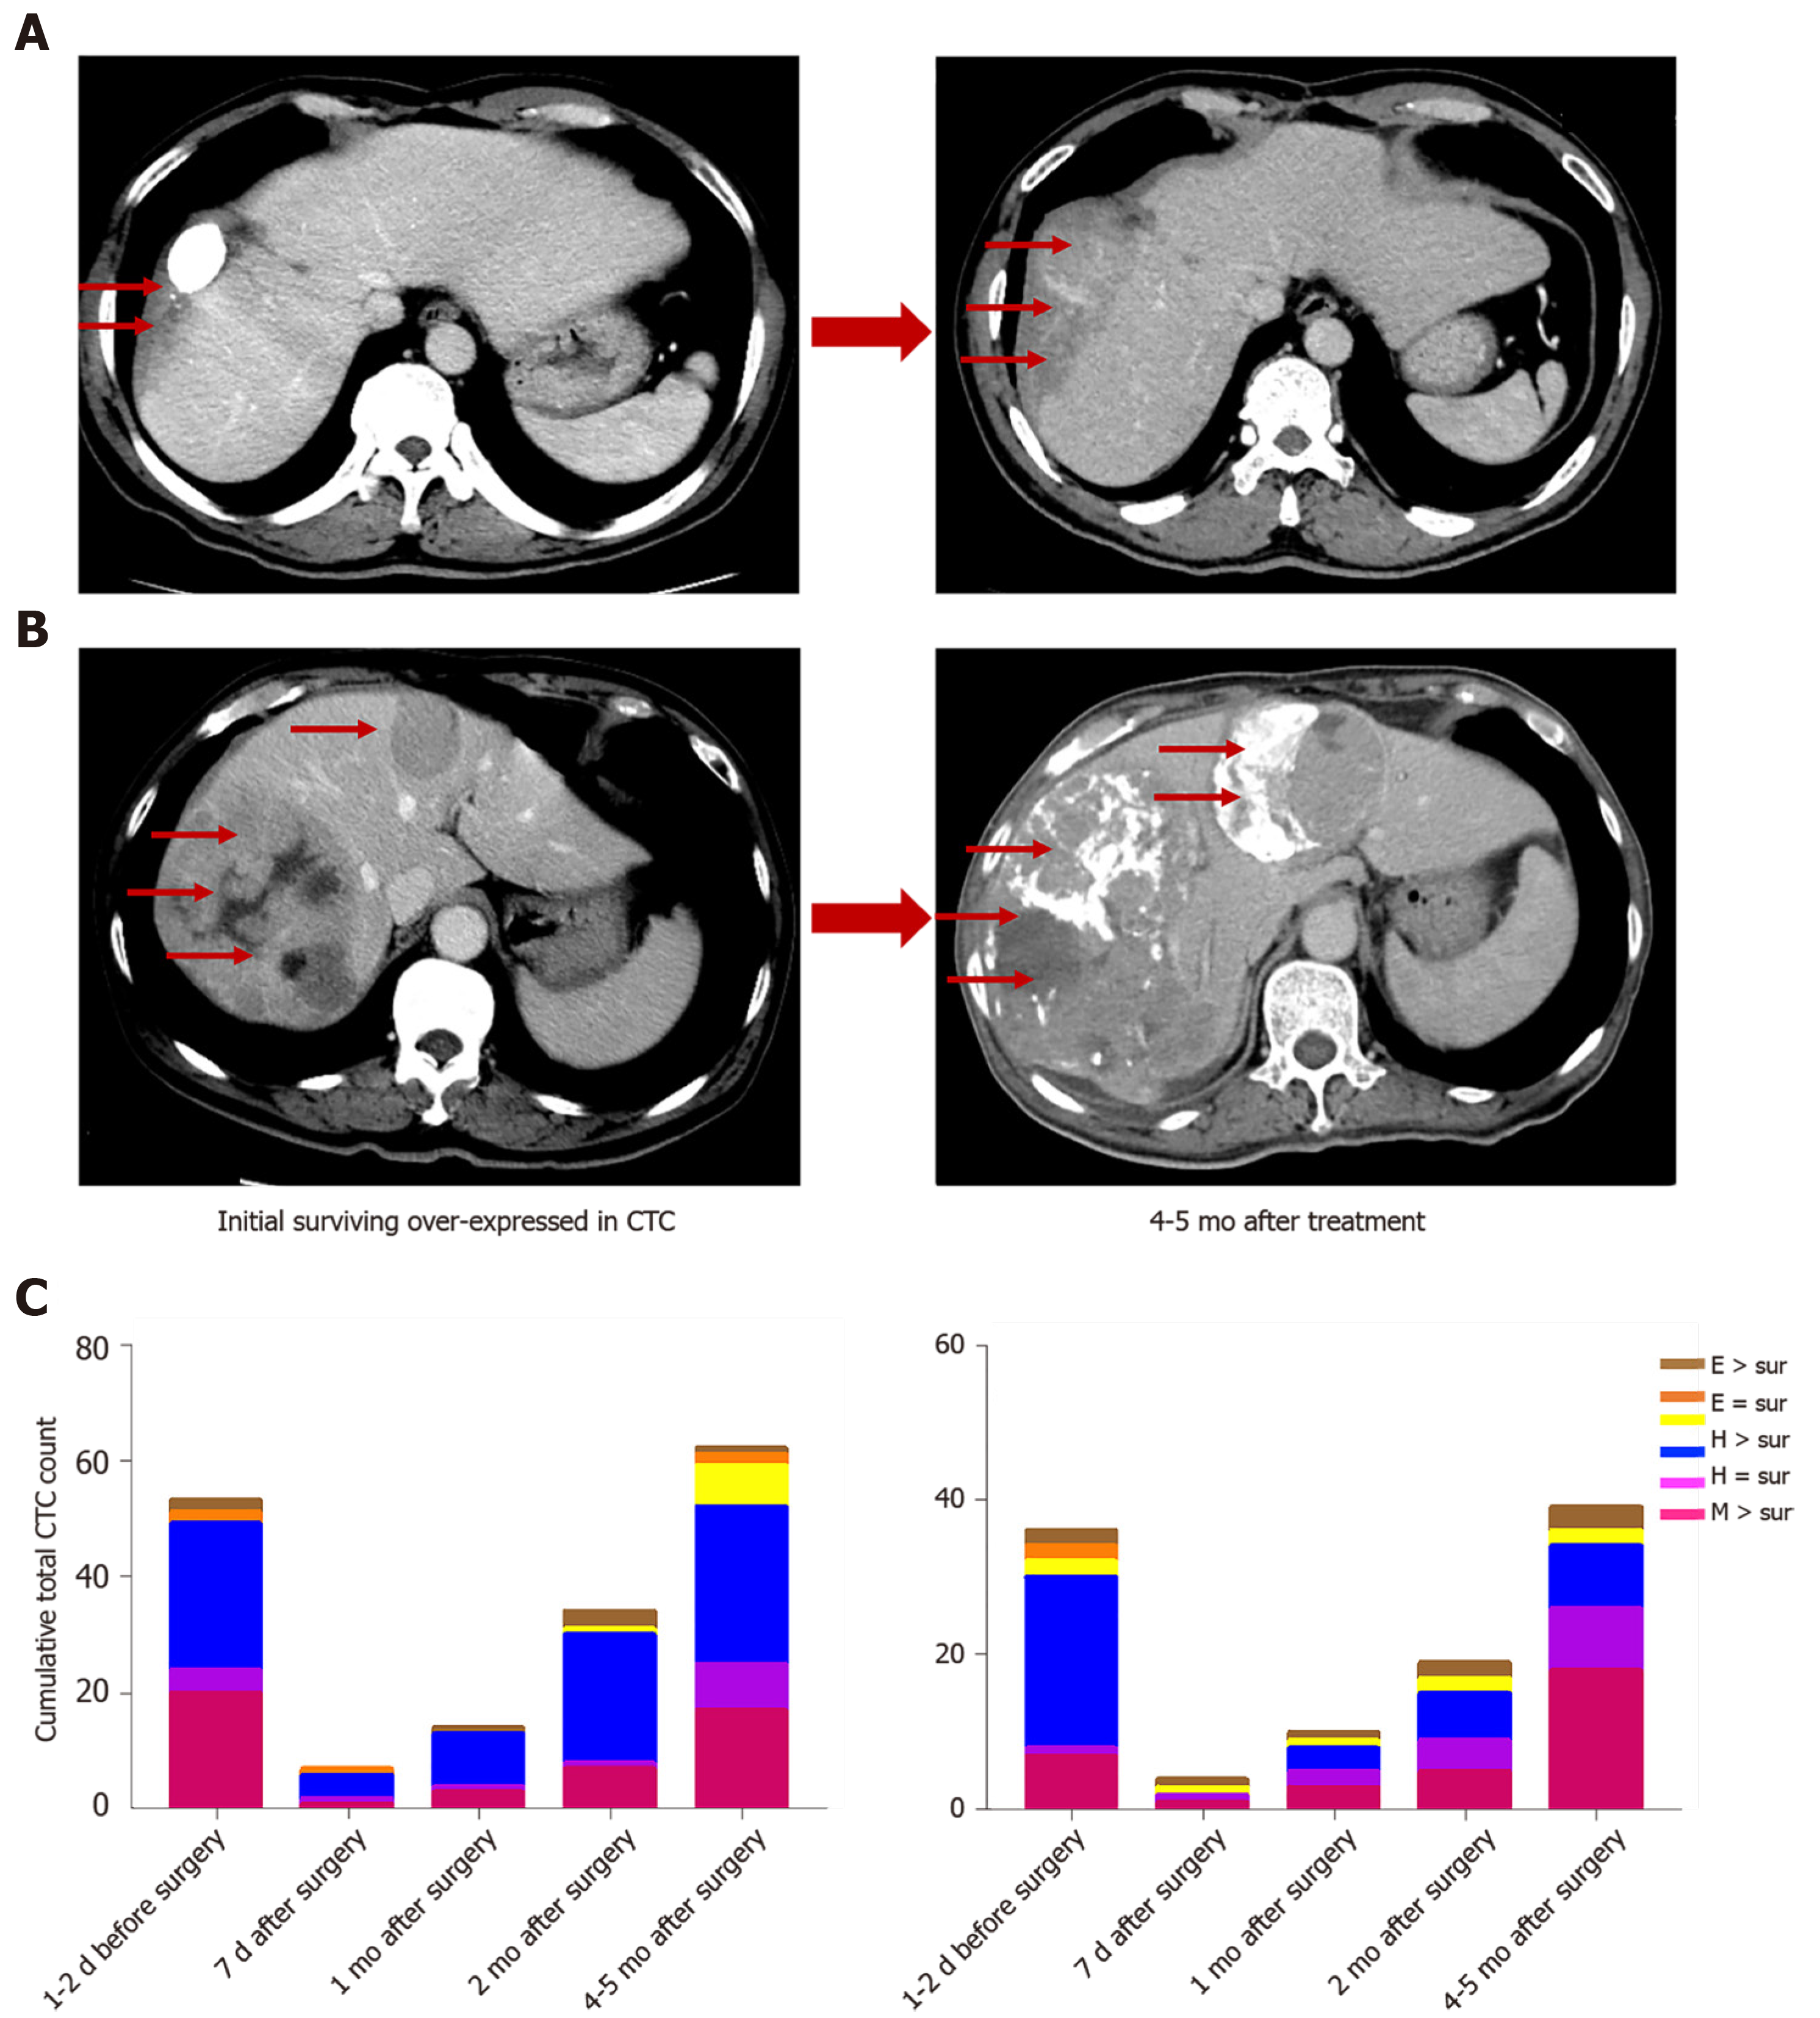
Figure 10 Survivin-positive circulating tumor cells detected during follow-up predict recurrence (m).
A and B: Images of two hepatocellular cancer (HCC) patients at the same BCLC stage who expressed survivin in circulating tumor cells (CTCs). At 4 and 5 mo after treatment, the HCC tumors showed more rapid progression in patients with higher survivin expression in CTCs at baseline; C: Cumulative total CTC count by three cell types and survivin-positive CTC count in the two patients before and after operation. The patients’ CTC and survivin-positive CTC count increased at the 2-mo follow-up. Letter E represents epithelial CTCs; Letter H represents hybrid CTCs; Letter M represents mesenchymal CTCs. CTC: Circulating tumor cell.
- Citation: Yu J, Wang Z, Zhang H, Wang Y, Li DQ. Survivin-positive circulating tumor cells as a marker for metastasis of hepatocellular carcinoma. World J Gastroenterol 2021; 27(43): 7546-7562
- URL: https://www.wjgnet.com/1007-9327/full/v27/i43/7546.htm
- DOI: https://dx.doi.org/10.3748/wjg.v27.i43.7546


