Copyright
©The Author(s) 2021.
World J Gastroenterol. Nov 21, 2021; 27(43): 7530-7545
Published online Nov 21, 2021. doi: 10.3748/wjg.v27.i43.7530
Published online Nov 21, 2021. doi: 10.3748/wjg.v27.i43.7530
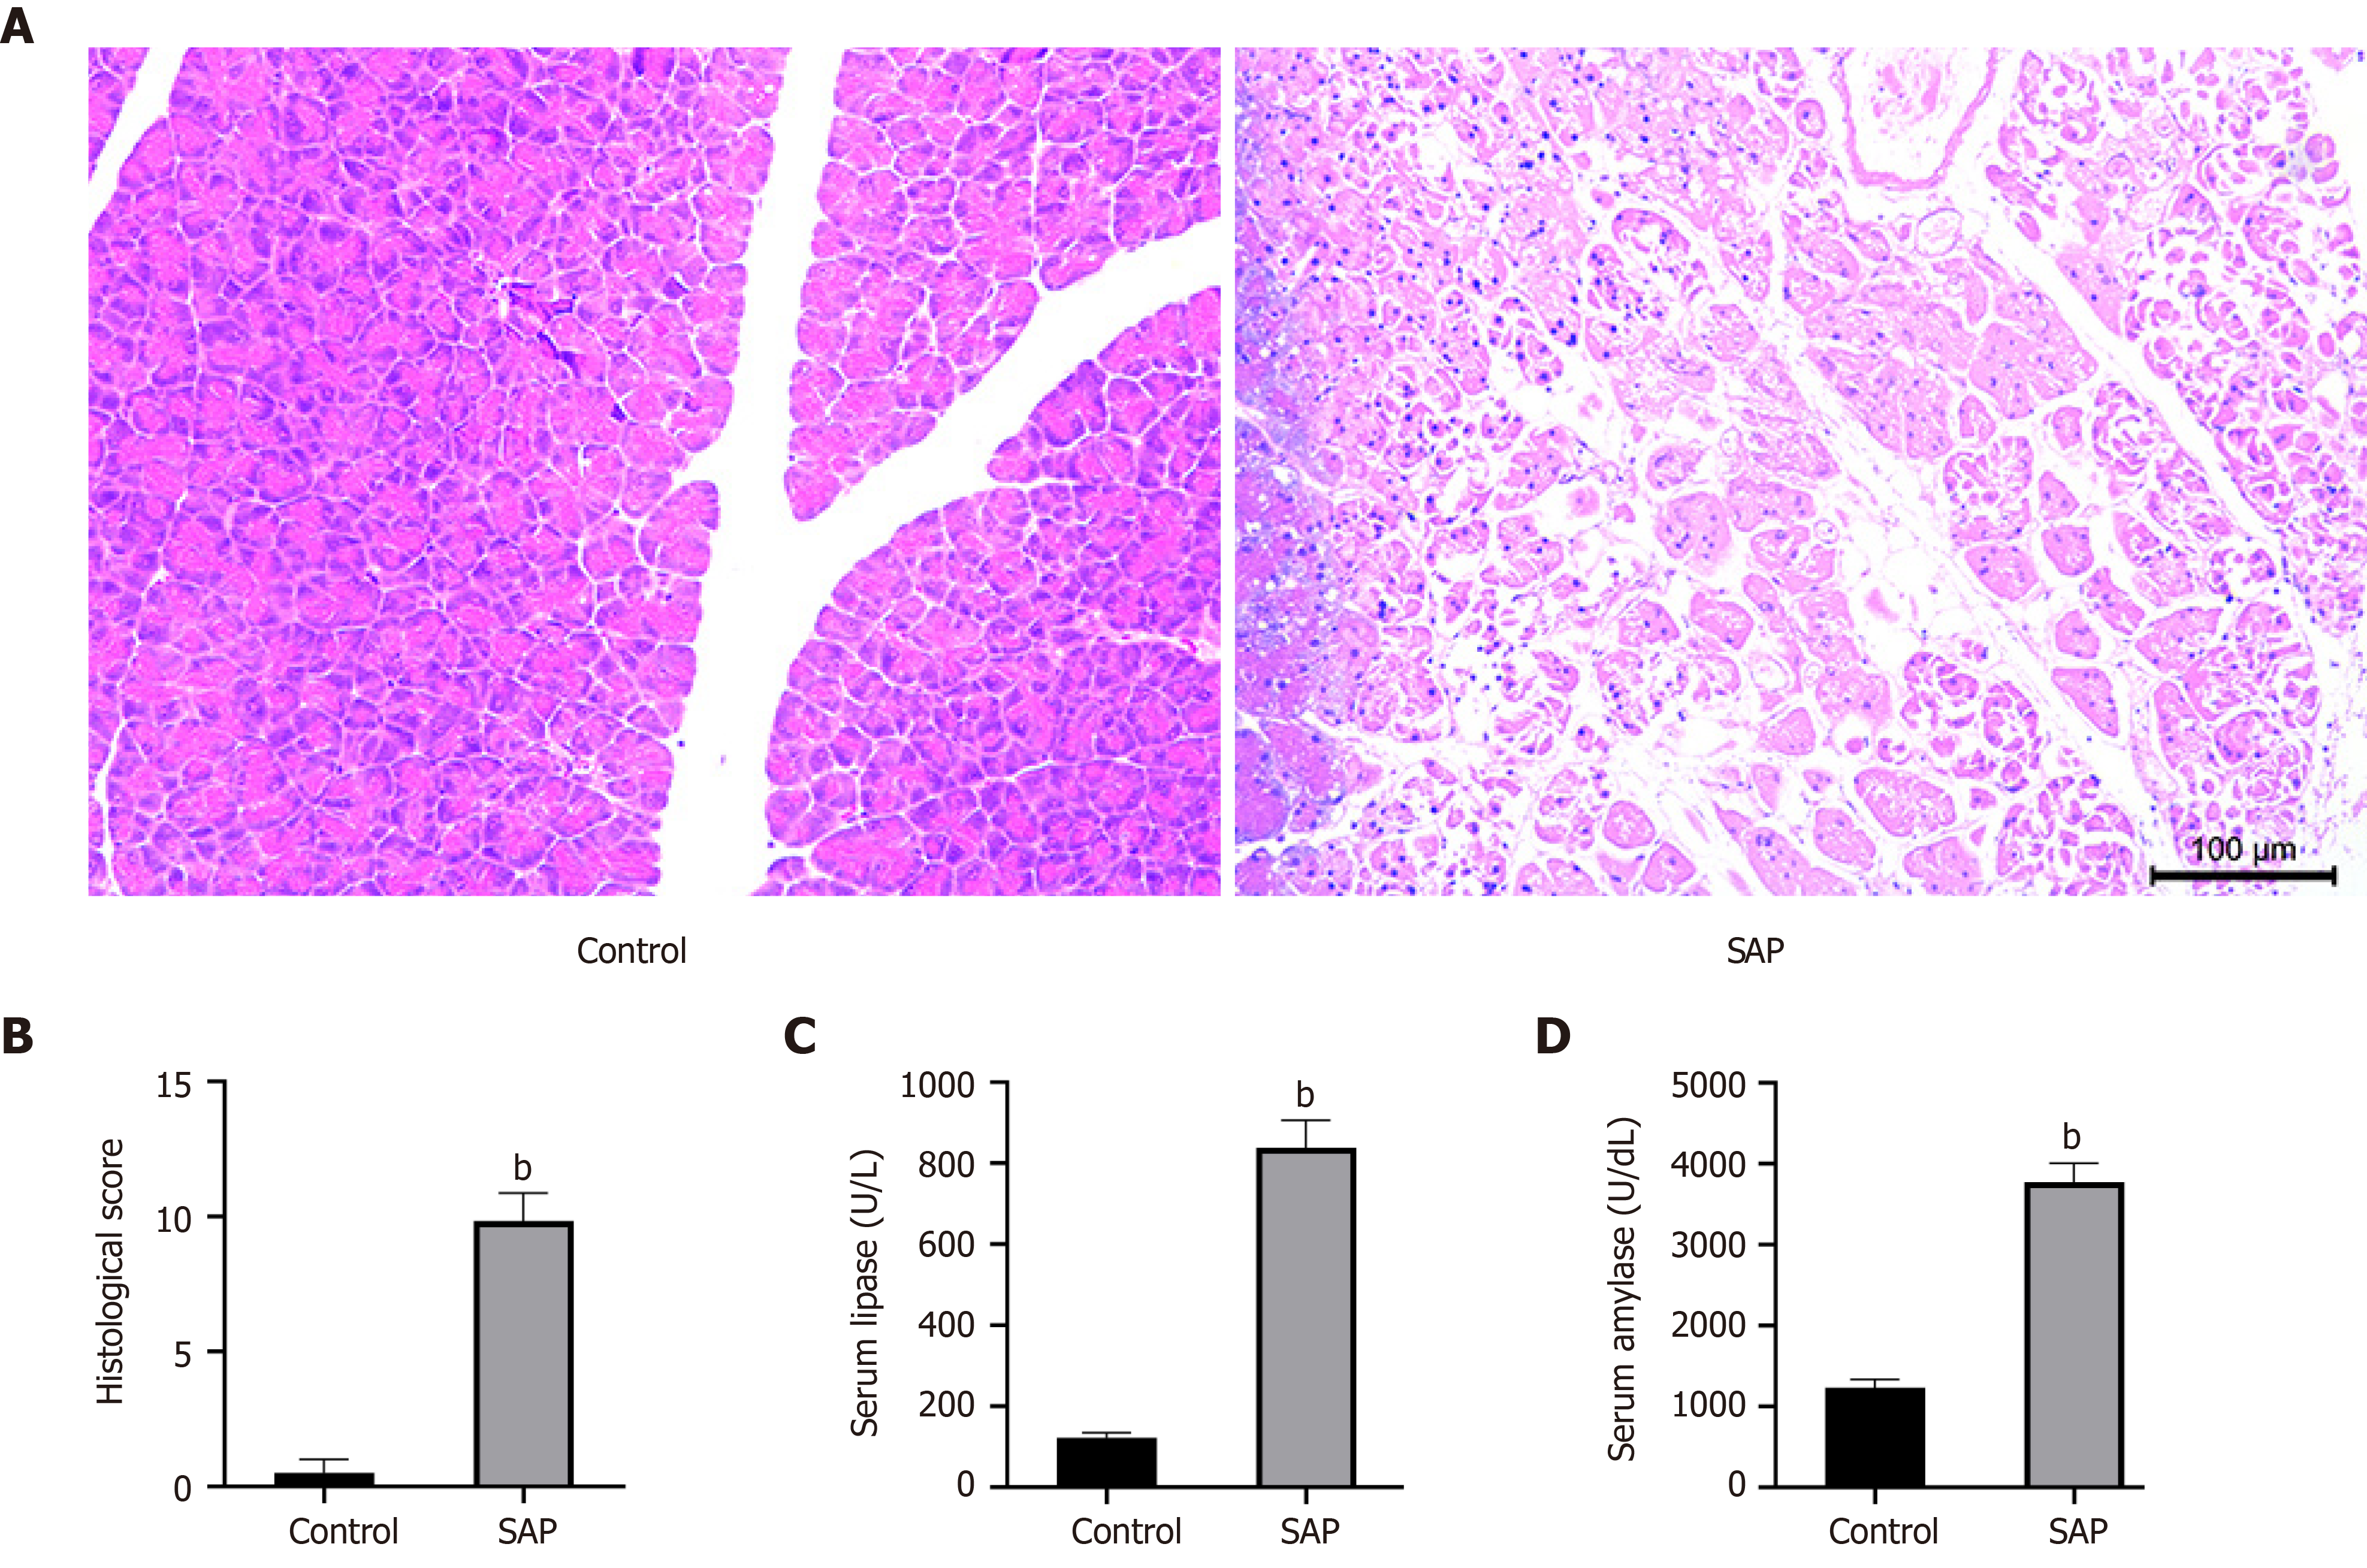
Figure 1 Evaluation of mouse model of severe acute pancreatitis.
A: Representative images of pancreatic tissues stained with hematoxylin from control (left) and severe acute pancreatitis (SAP) (right) groups (× 100 magnification); B: Histological score of pancreatic tissues in control and SAP groups; C and D: Levels of serum lipase and amylase, respectively. bP < 0.01 vs control group, n = 3 per group.
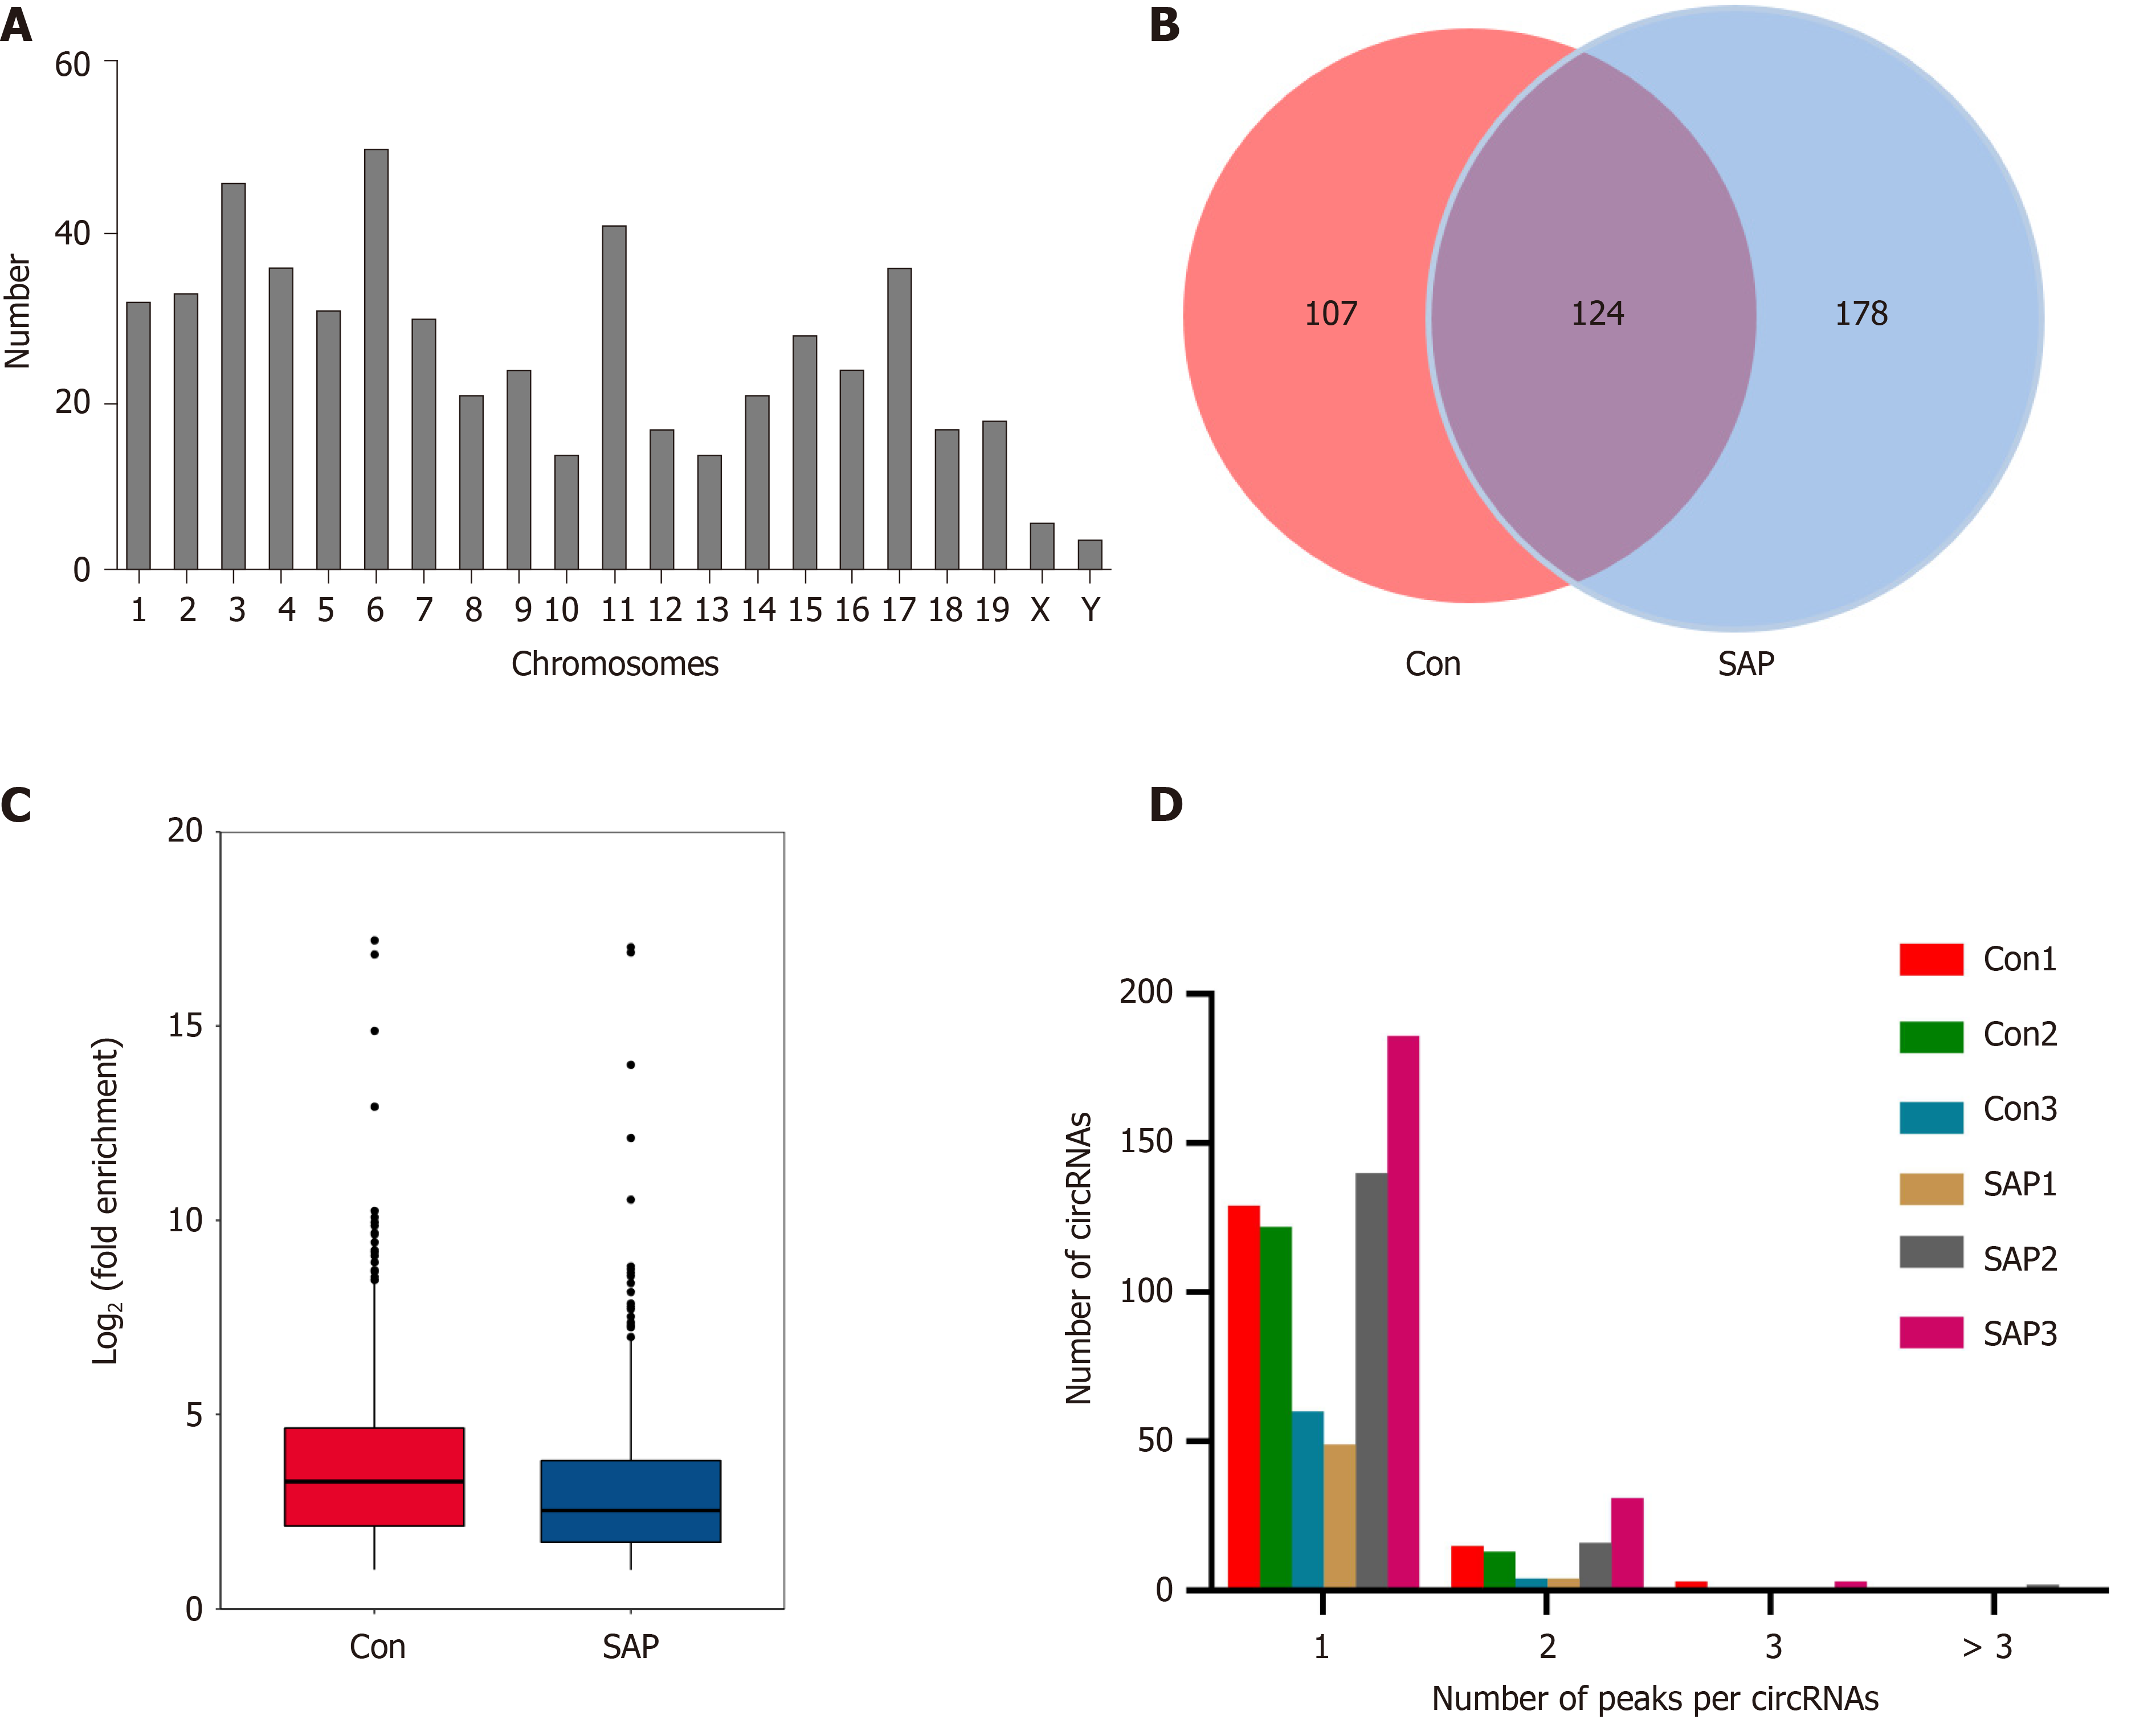
Figure 2 Overview of N6-methyladenosine circRNAs in severe acute pancreatitis.
A: Number of identified N6-methyladenosine (m6A) circRNAs according to distribution on chromosomes; B: Venn diagram exhibiting number of common and specific m6A circRNAs between control and severe acute pancreatitis (SAP) groups; C: Box plot showing level of m6A peaks enrichment in circRNAs in control and SAP groups; D: Number of circRNAs containing variant numbers of m6A peaks.
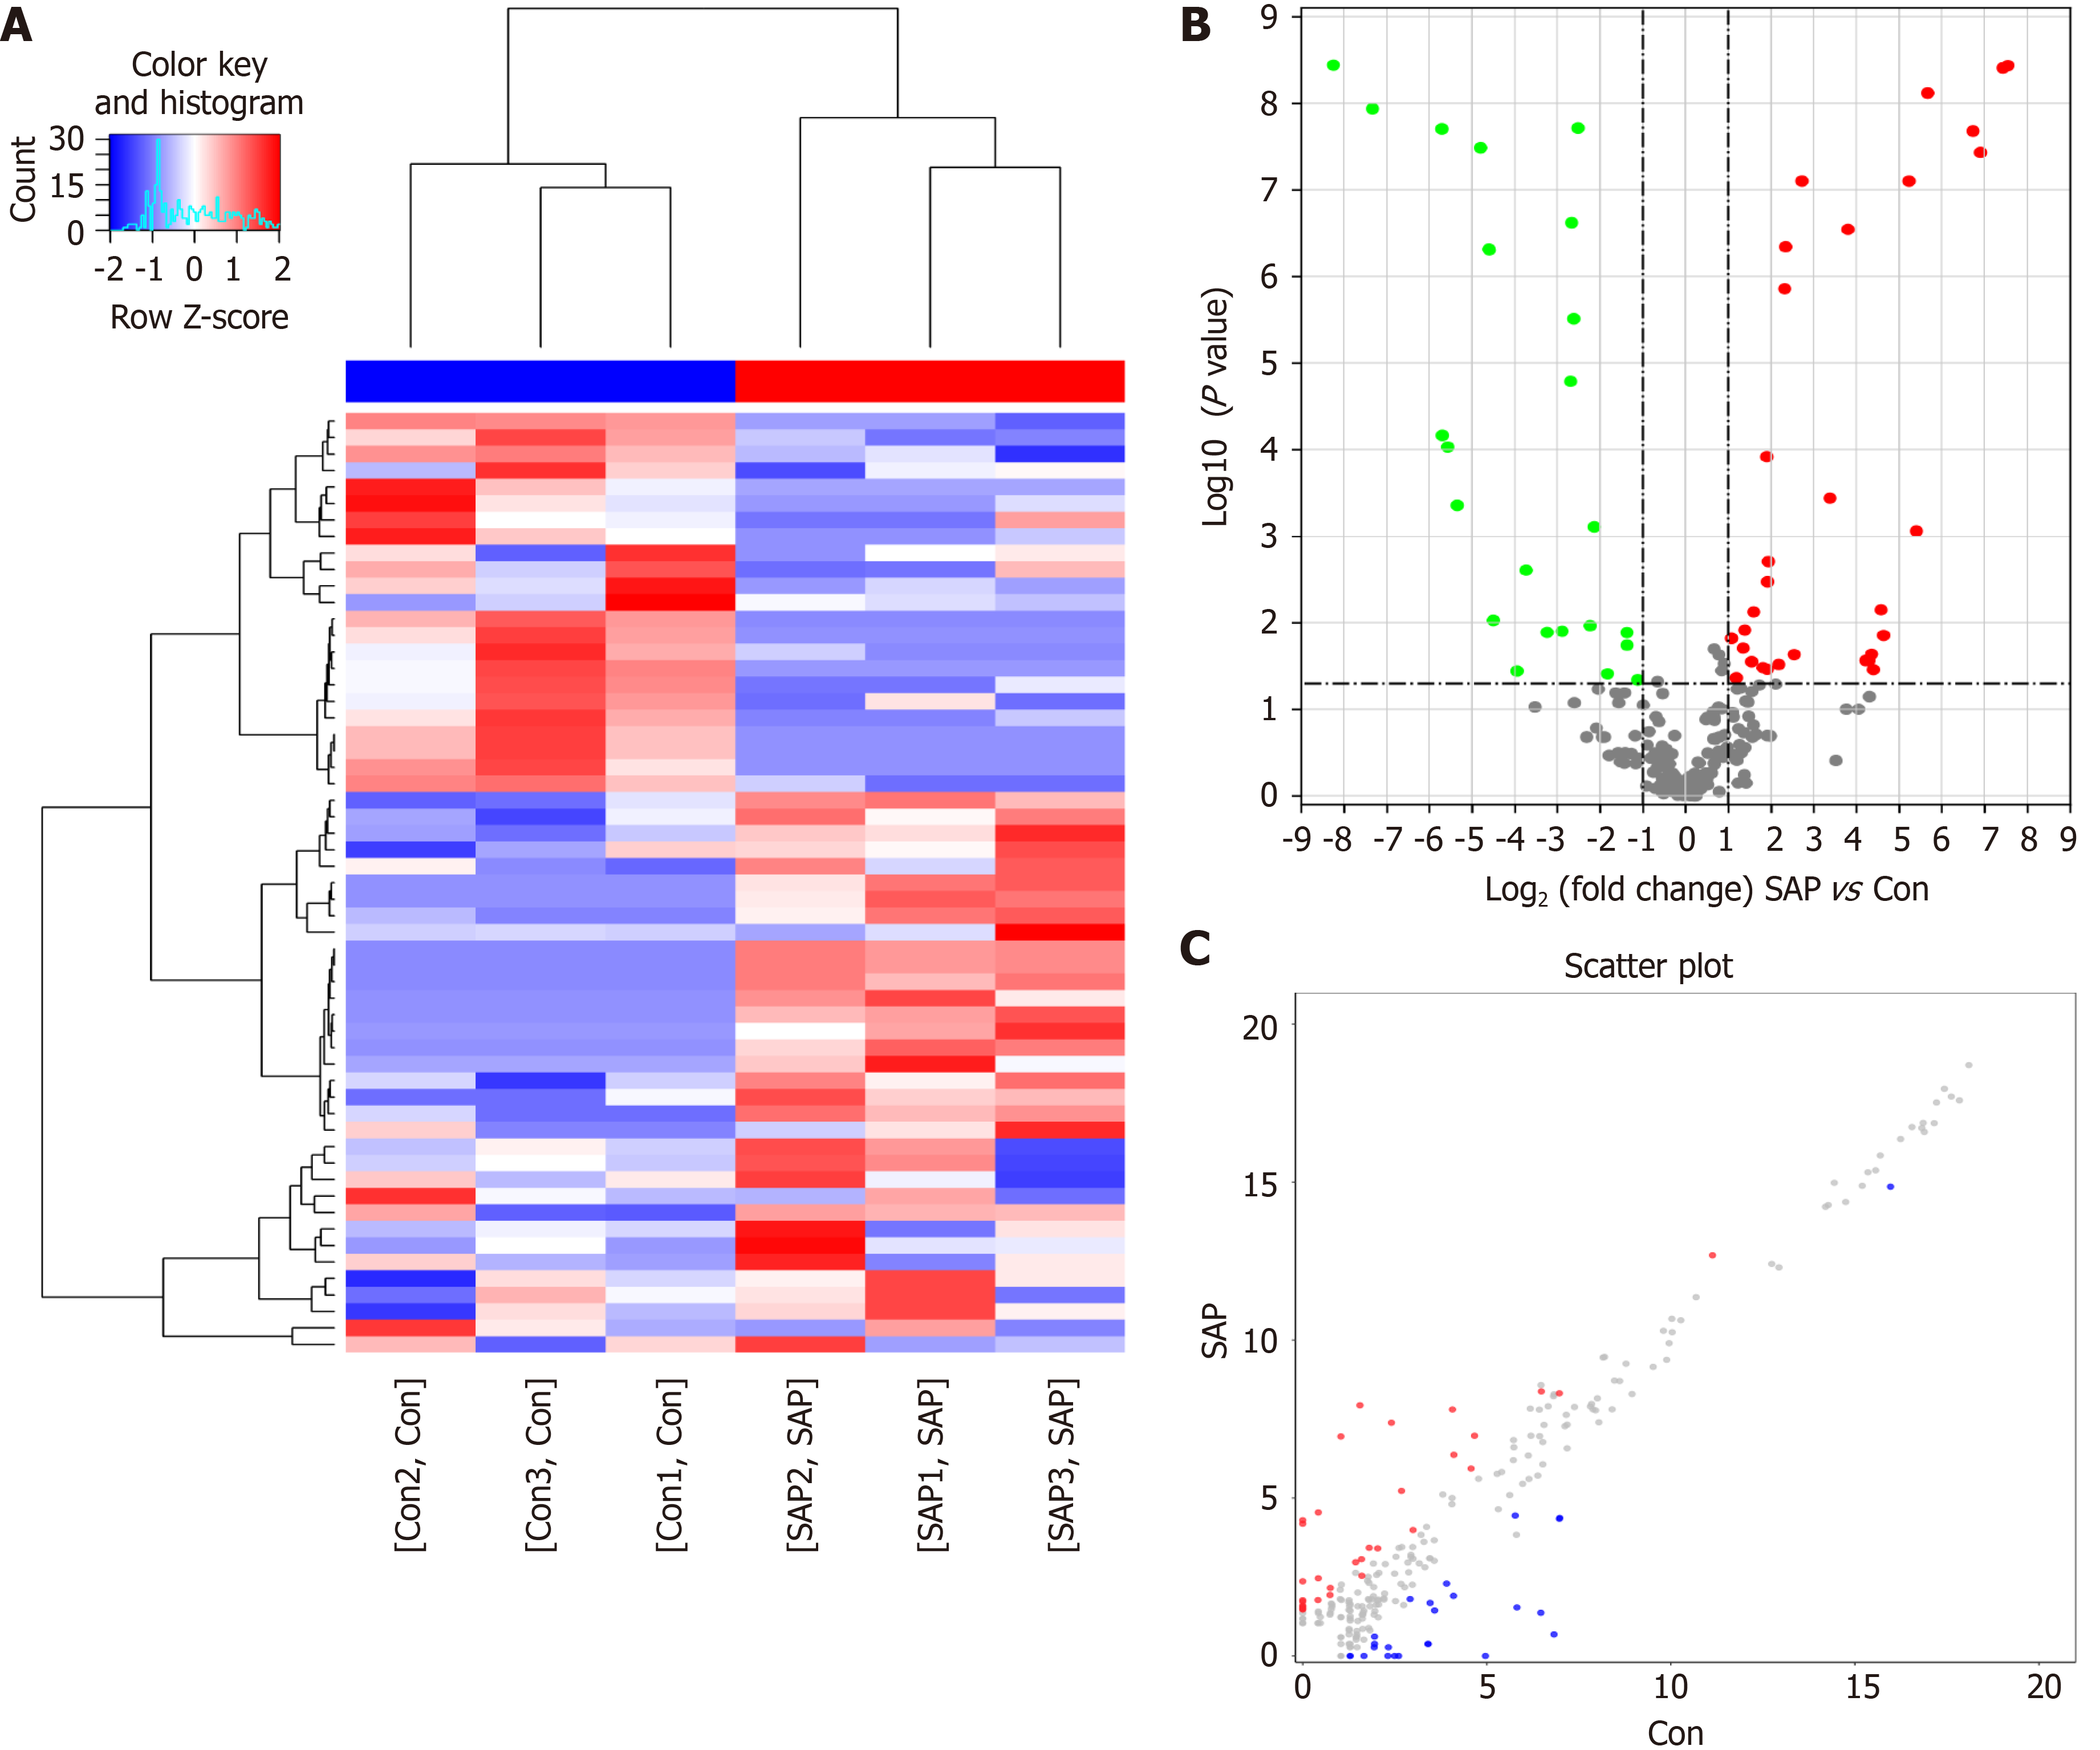
Figure 3 Differential N6-methyladenosine modification of circRNAs in severe acute pancreatitis.
A: Hierarchical clustering graph exhibiting differential N6-methyladenosine (m6A) modification of circRNAs in control and severe acute pancreatitis (SAP) groups. Higher expression is presented in red and lower expression in blue; B and C: Volcano and scatter plot showing the circRNAs with significant differentially expressed m6A peaks.
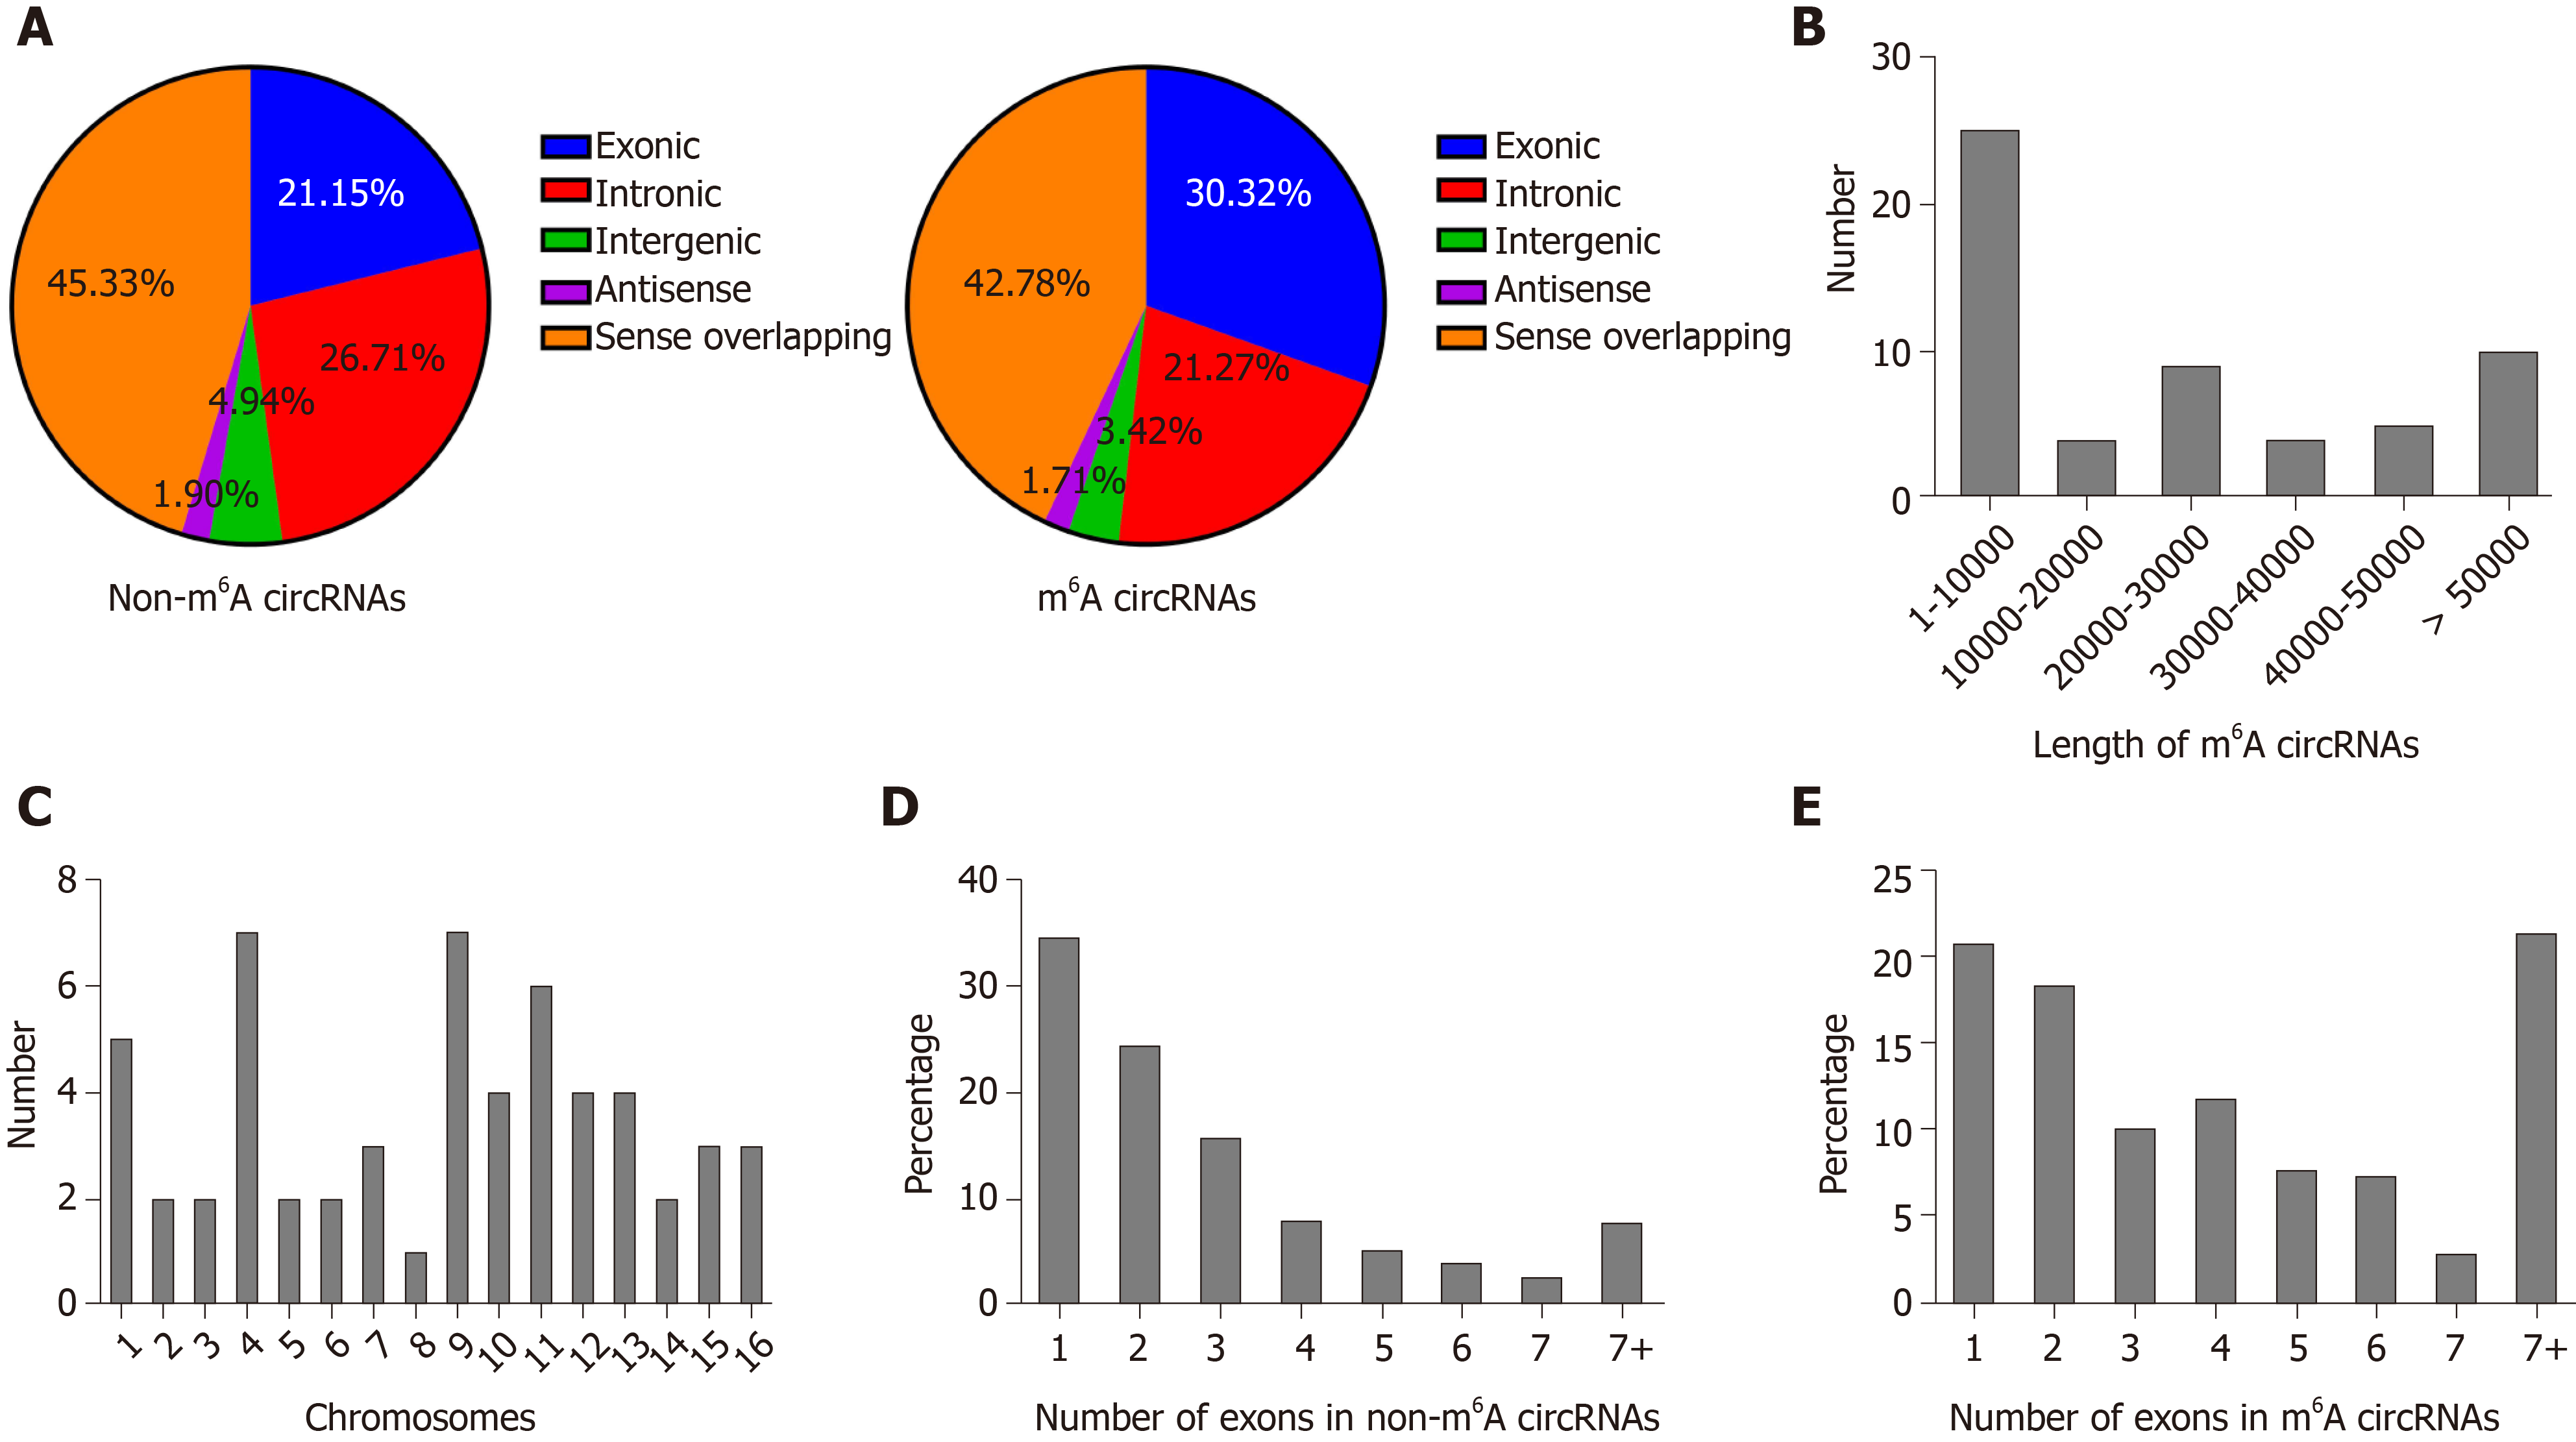
Figure 4 Distribution of N6-methyladenosine sites in severe acute pancreatitis and control groups.
A: Distribution of genomic origins of non-N6-methyladenosine (m6A) circRNAs (left) and m6A circRNAs (right); B: Number of circRNAs with differentially expressed m6A peaks based on the distribution of length; C: Chromosomal distribution of all differential m6A sites within circRNAs; D and E: Distribution of non-m6A and m6A circRNAs based on the number of exons in each circRNA.
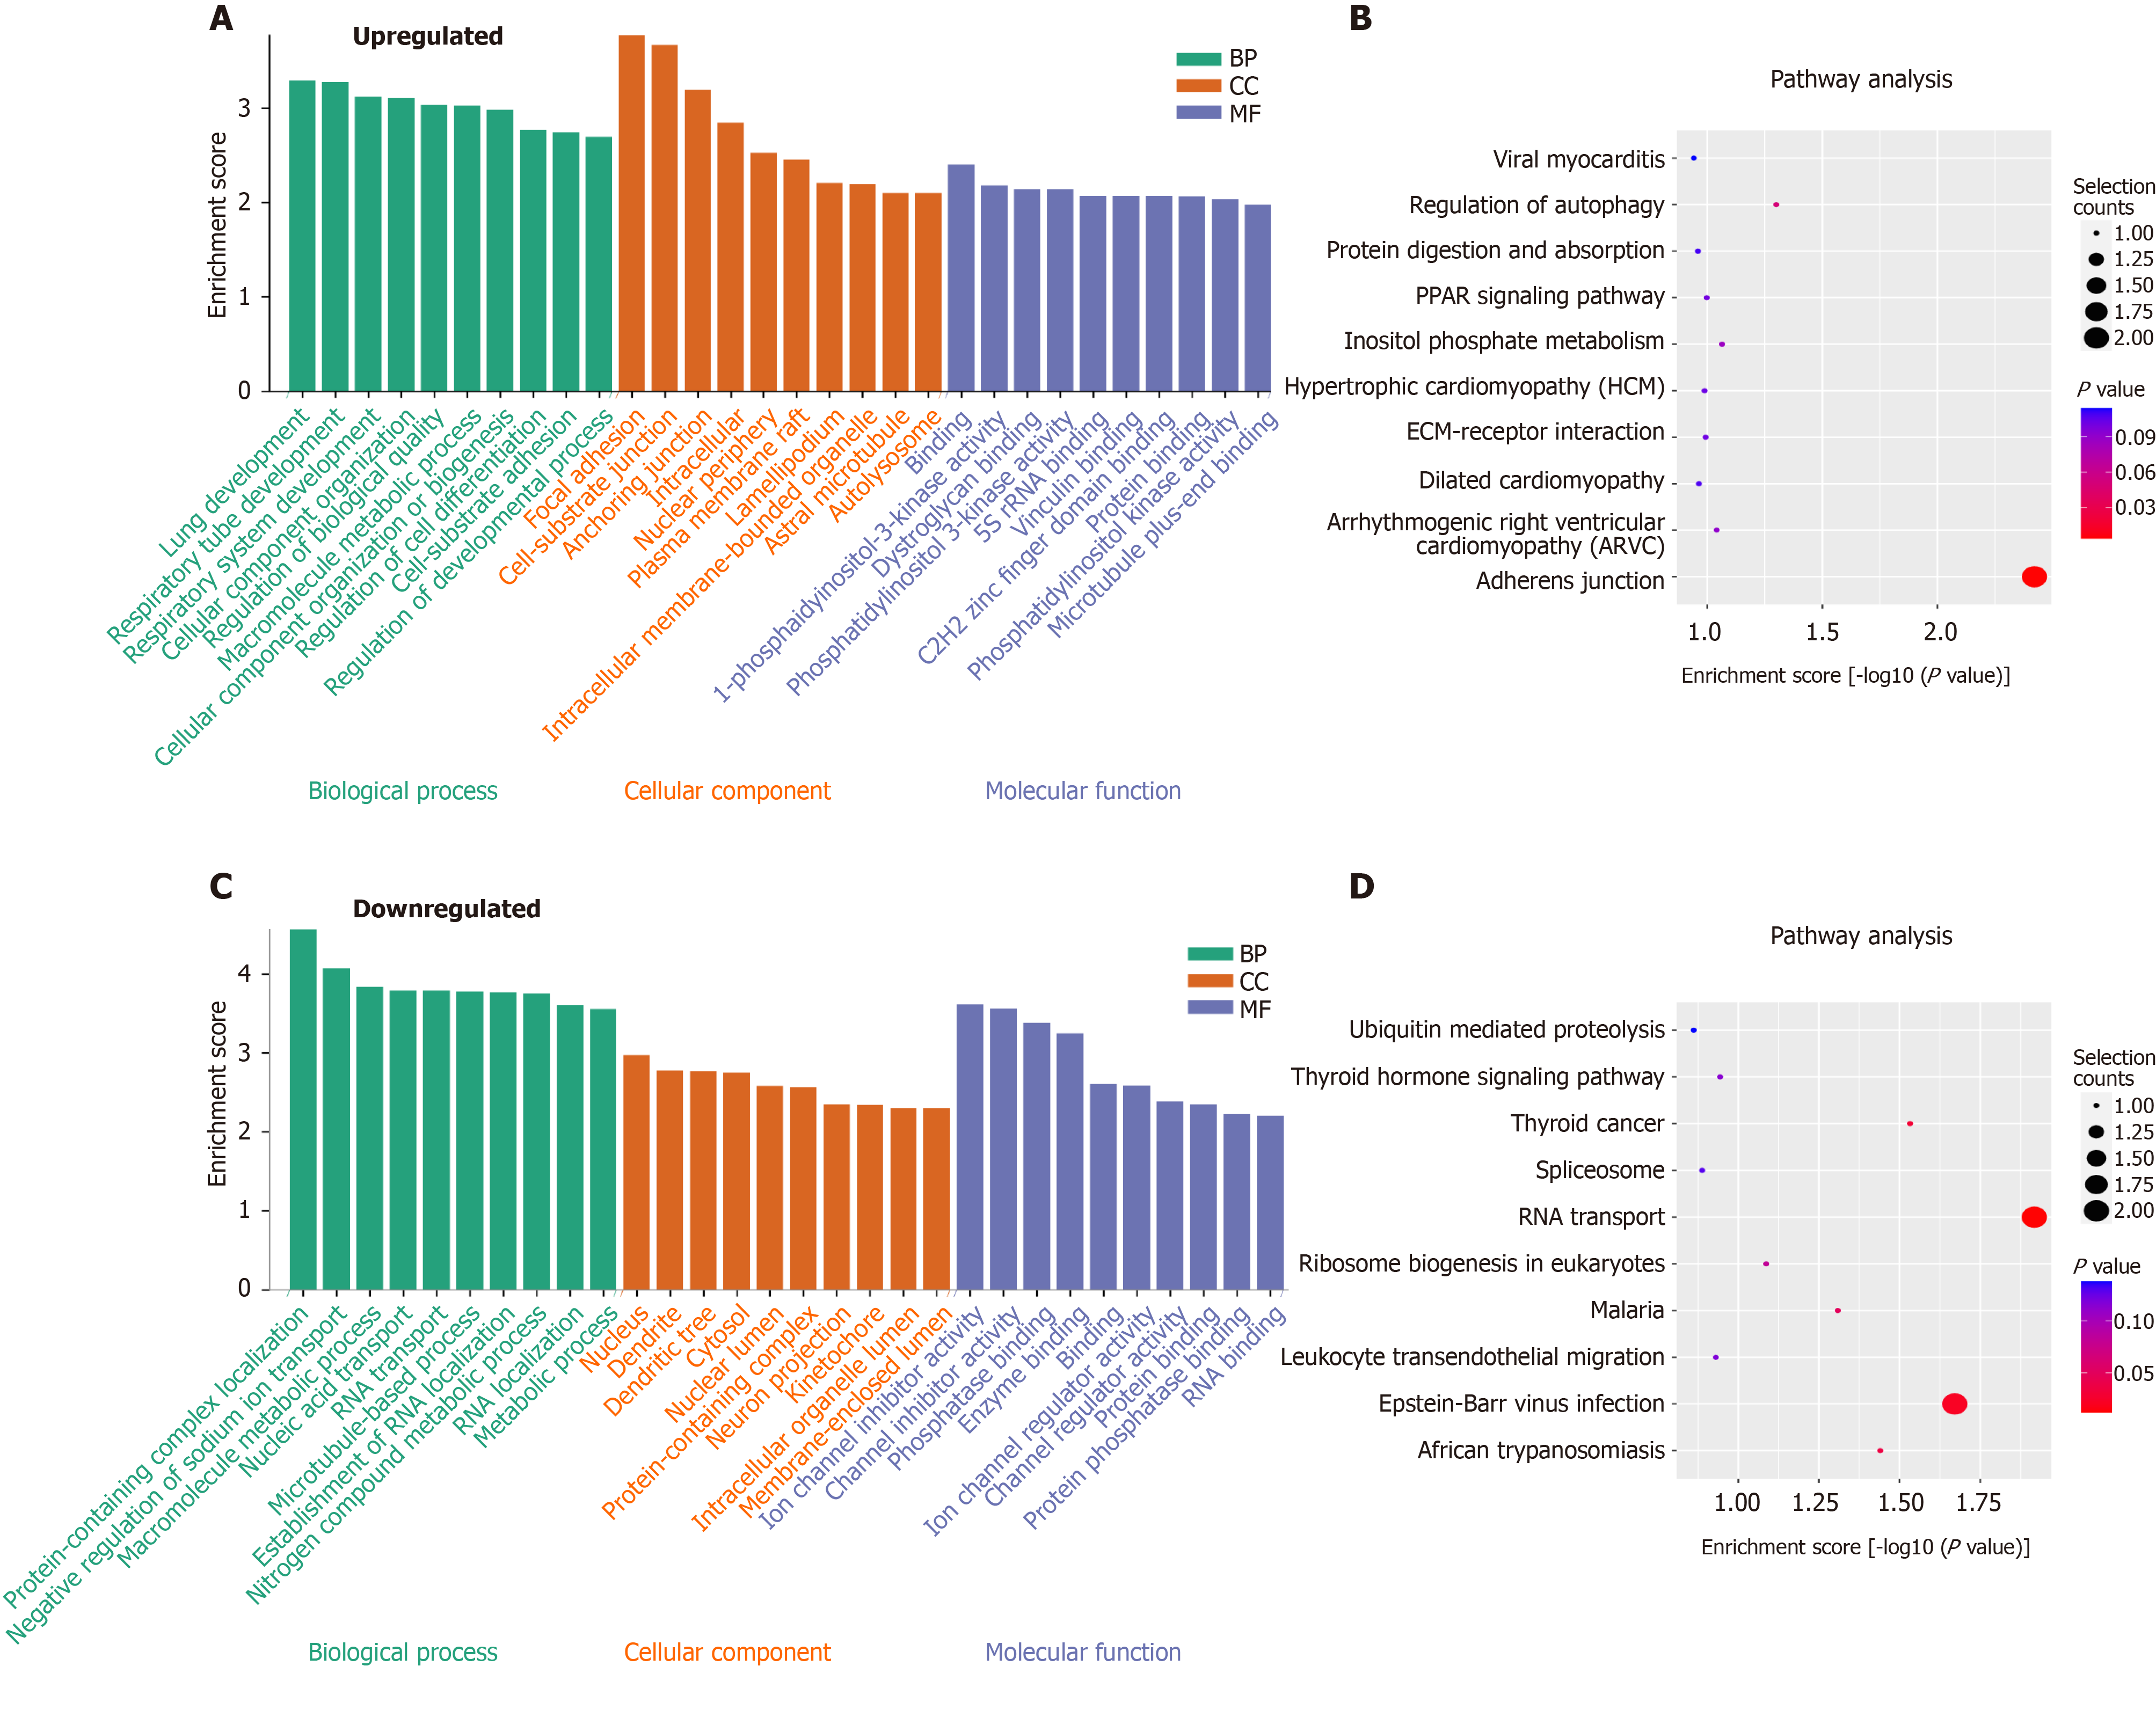
Figure 5 Functional analysis of circRNAs with differentially expressed N6-methyladenosine peaks though gene ontology and Kyoto Encyclopedia of Genes and Genomes analysis.
A and B: Gene ontology (GO) and Kyoto Encyclopedia of Genes and Genomes (KEGG) analysis of circRNAs with upregulated N6-methyladenosine (m6A) peaks; C and D: GO and KEGG analysis of circRNAs with downregulated m6A peaks. GO analysis include biological process (BP) analysis, cellular component (CC) analysis, and molecular function (MF) analysis.
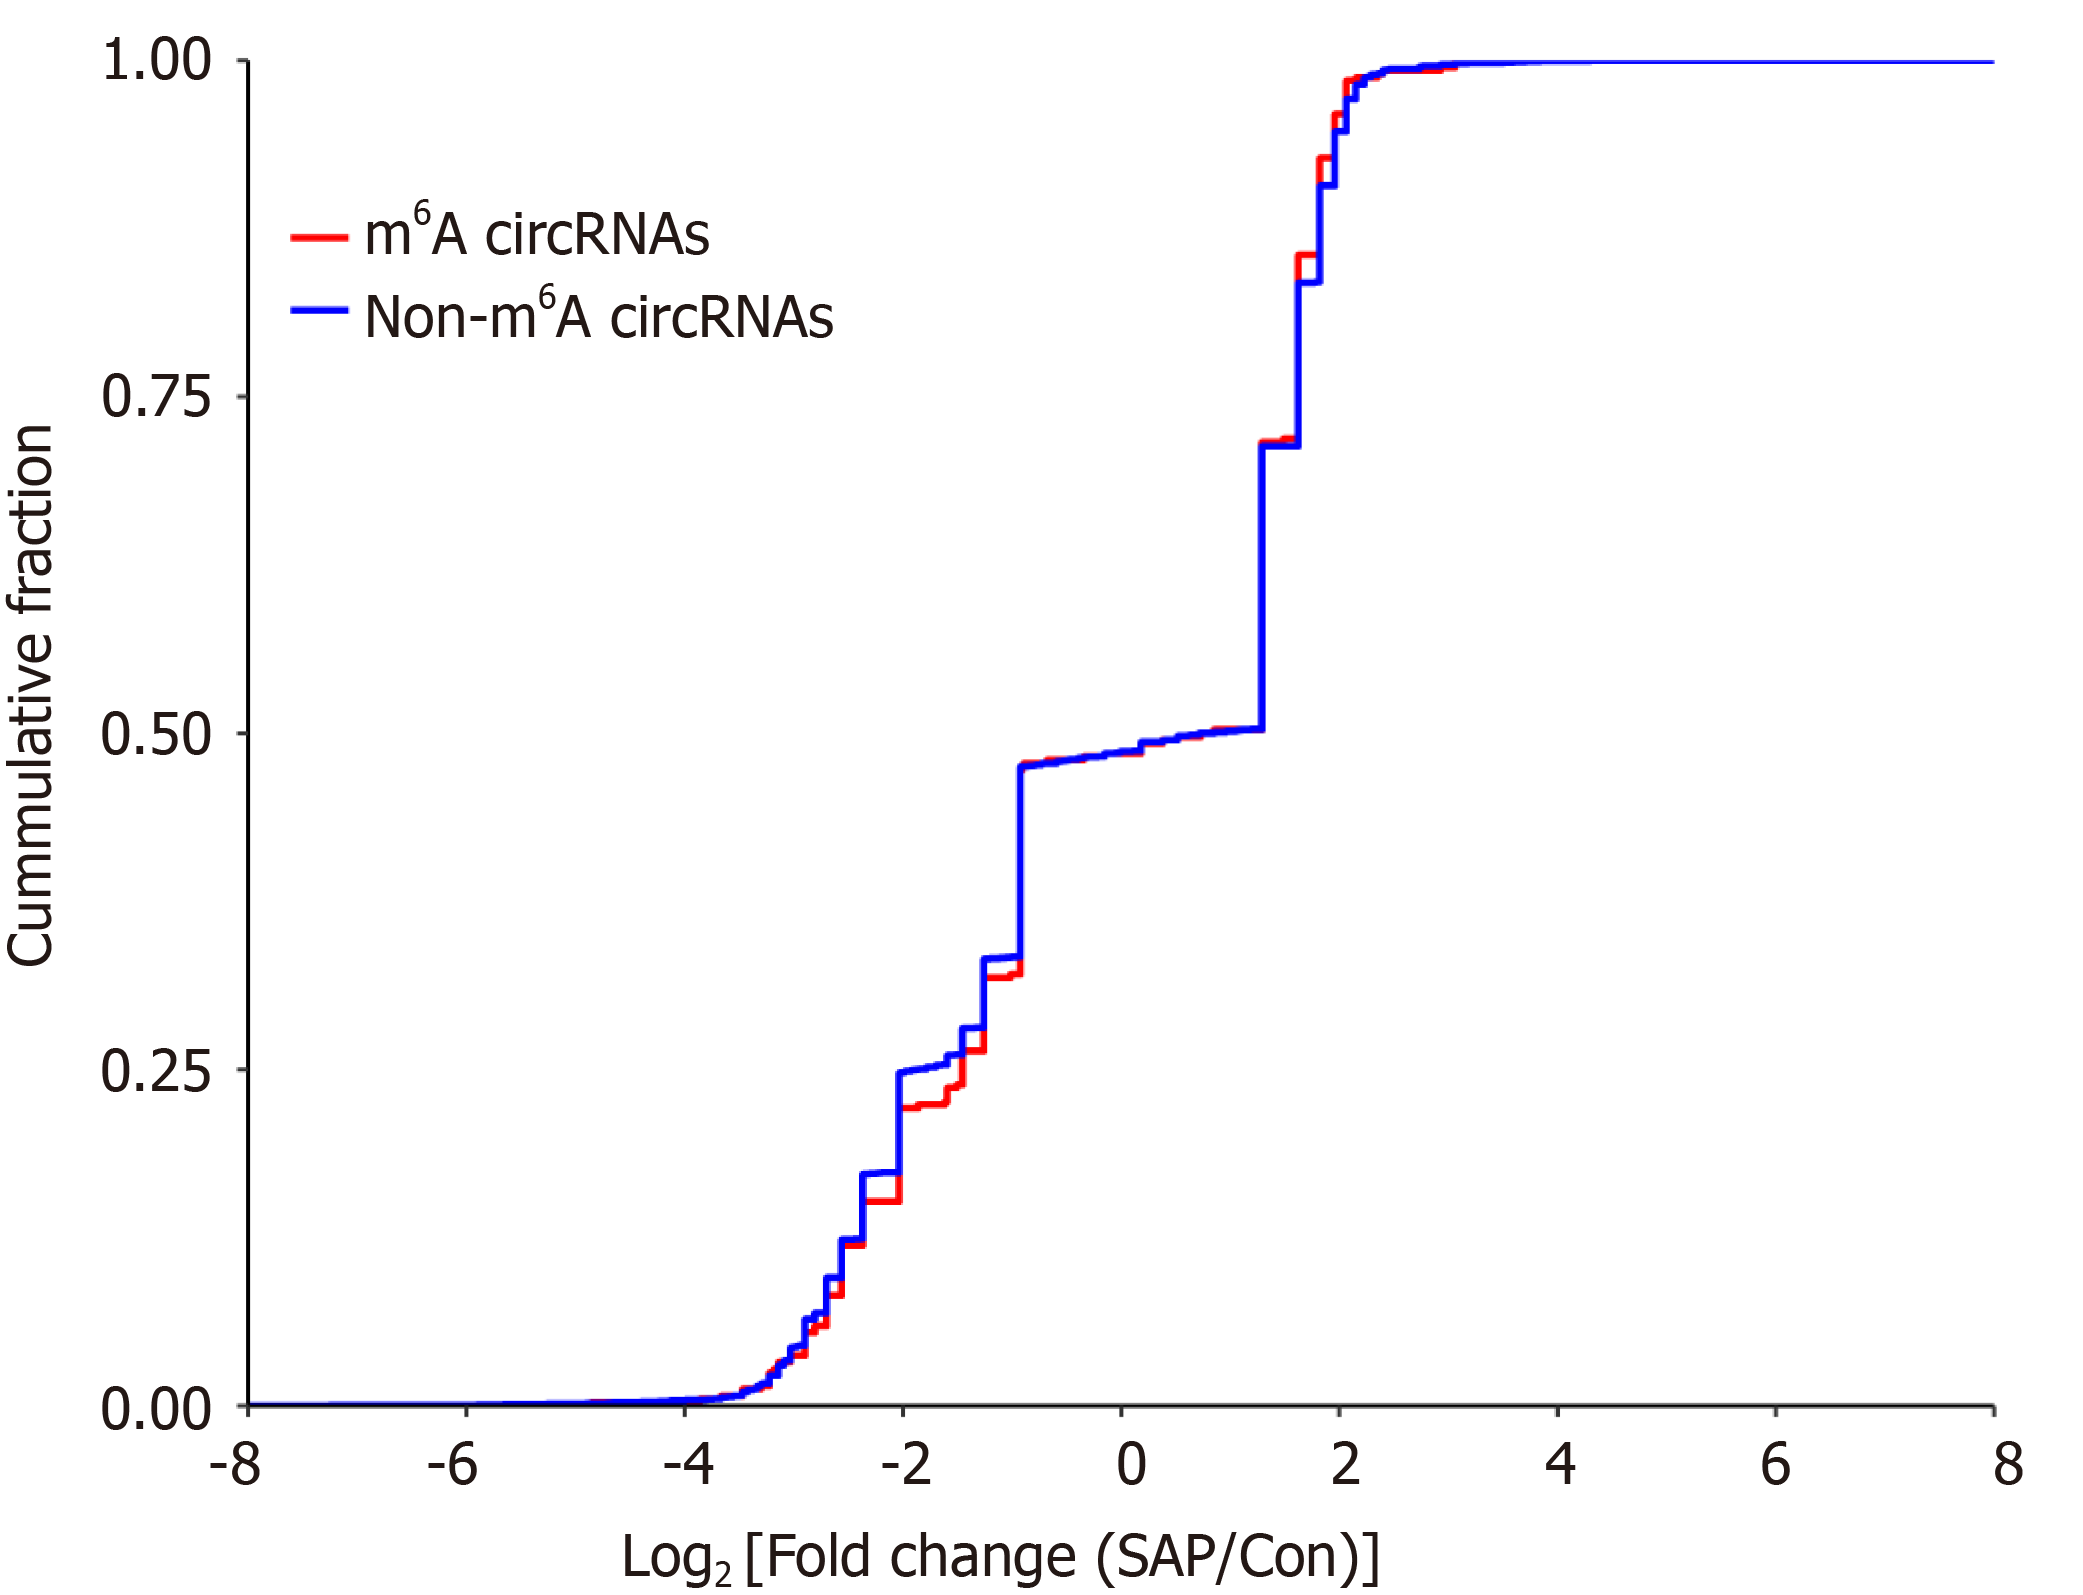
Figure 6 Relationship between N6-methyladenosine level and expression of circRNAs in severe acute pancreatitis.
Cumulative distribution of circRNAs expression between control and severe acute pancreatitis (SAP) groups for N6-methyladenosine (m6A) circRNAs (red) and non-m6A circRNAs (blue).
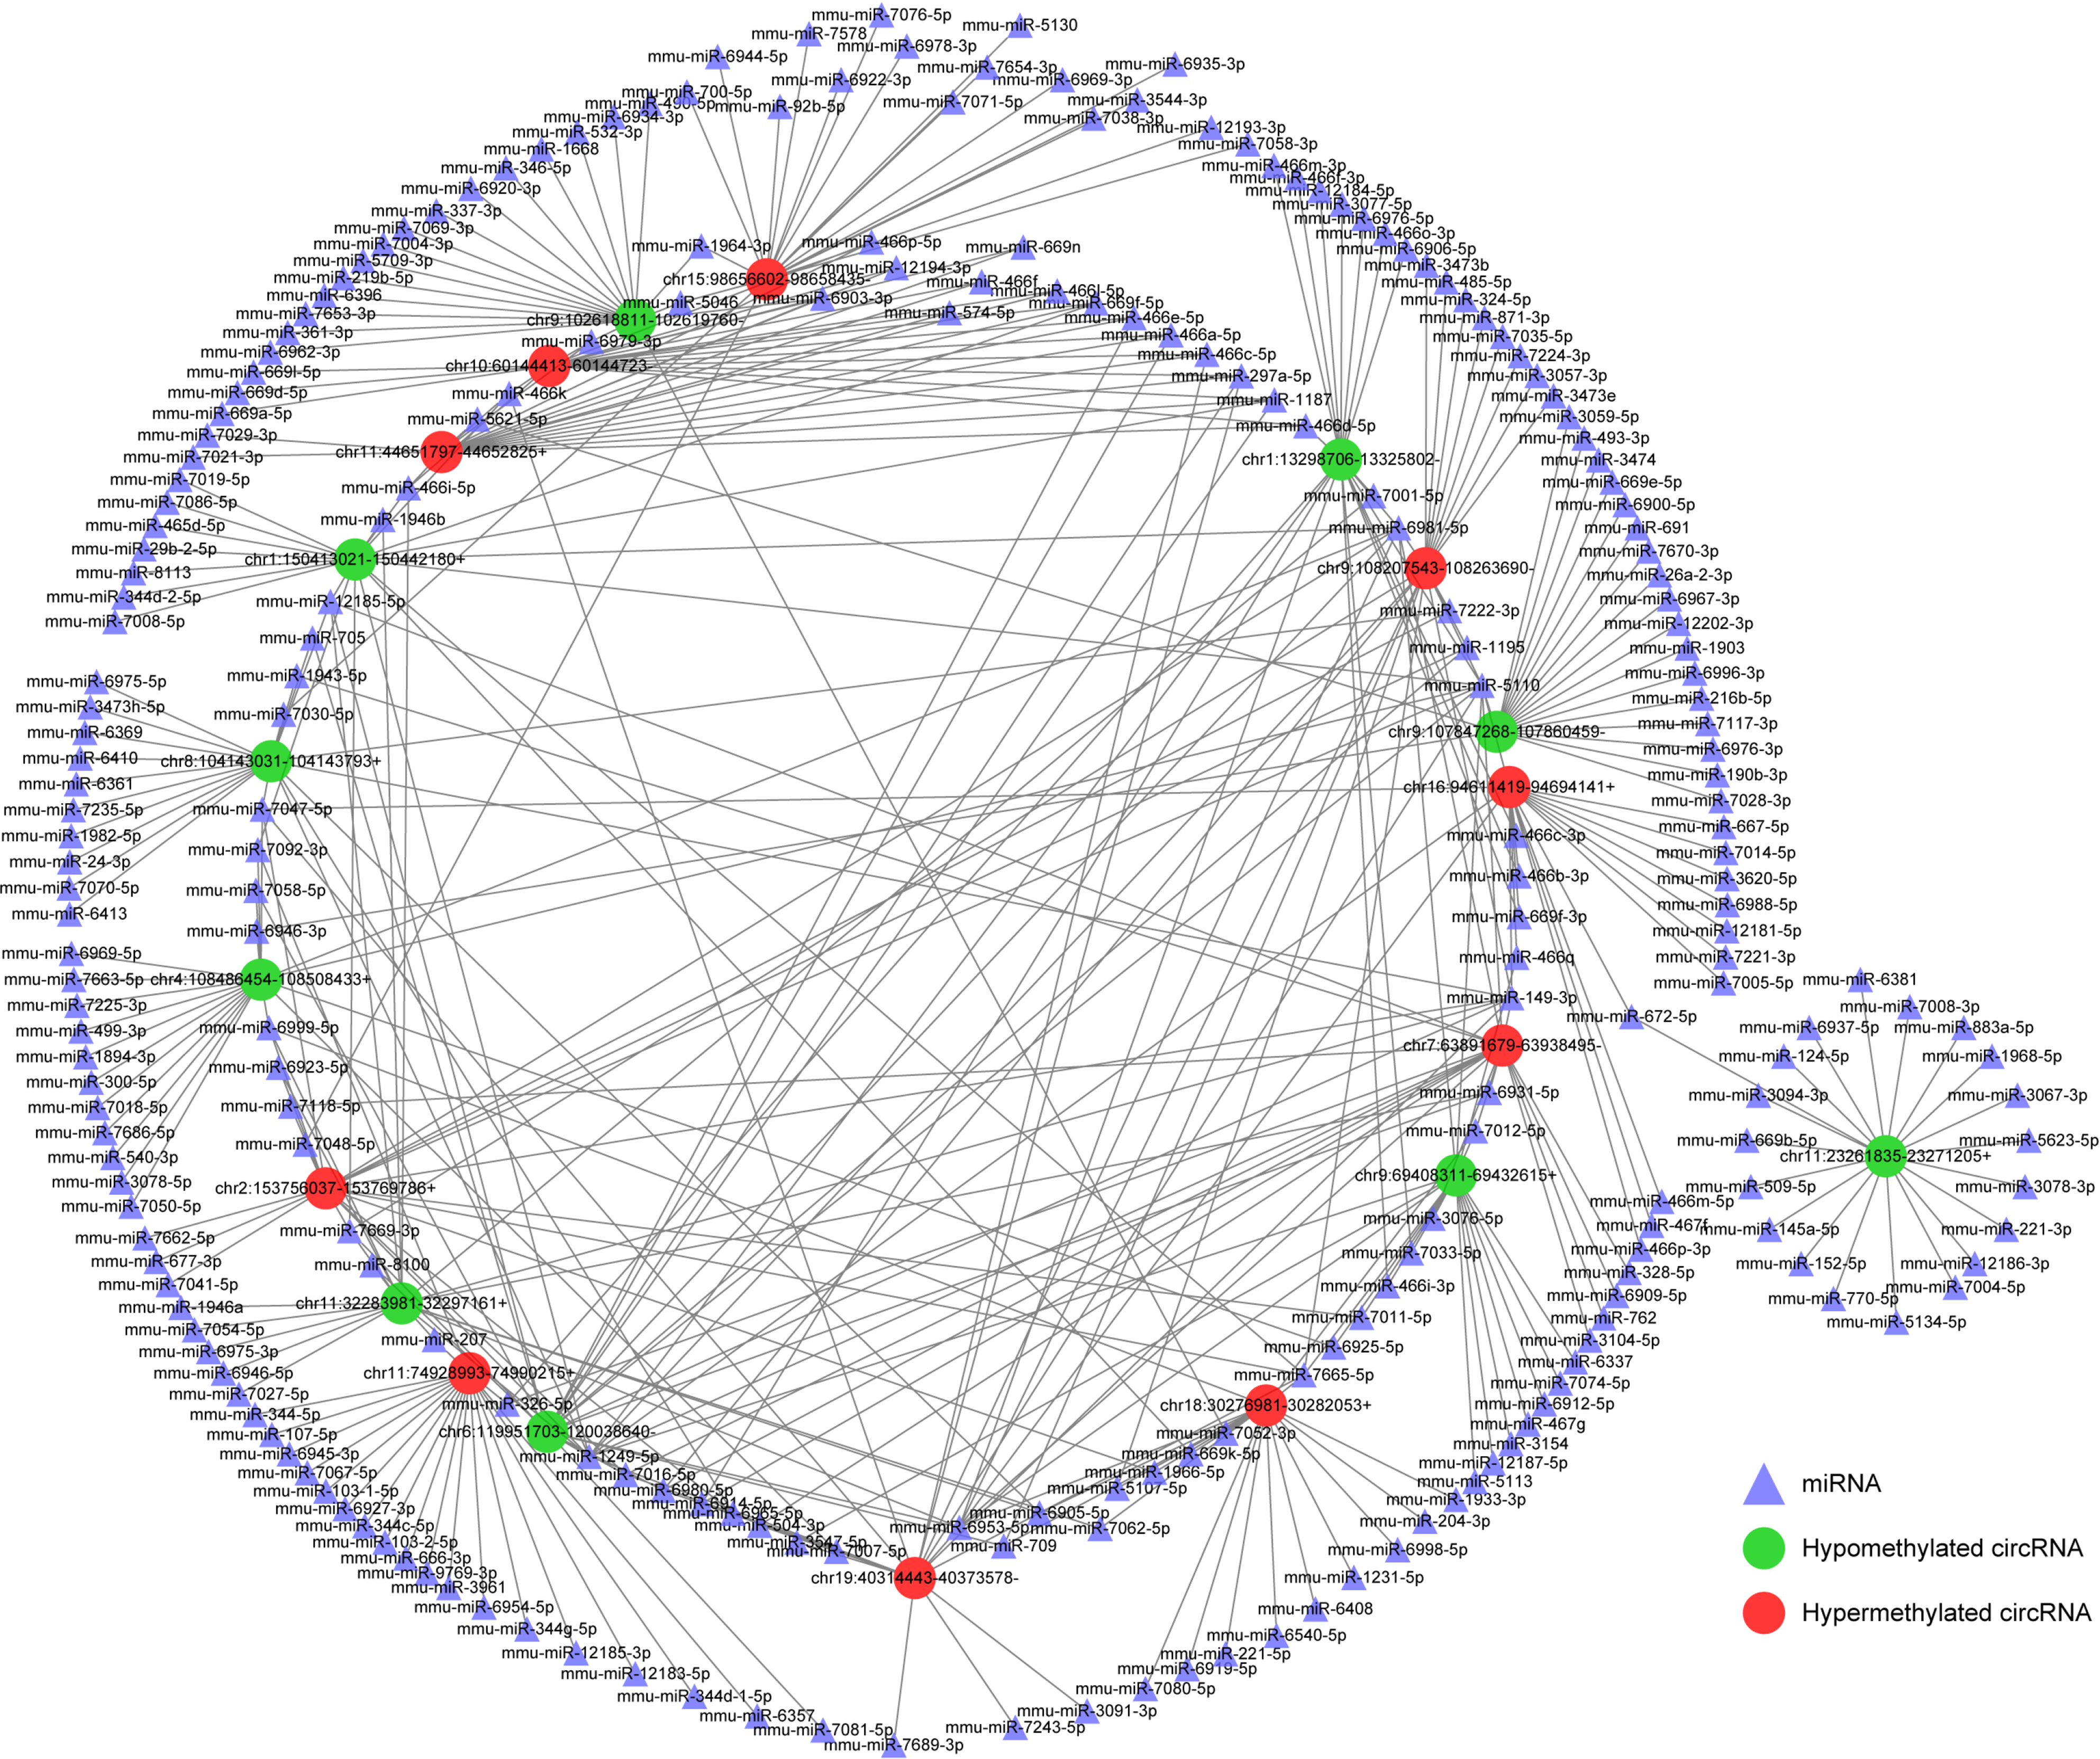
Figure 7 Construction of N6-methyladenosine circRNA-miRNA networks in severe acute pancreatitis.
A map showing the interaction networks of the top 10 upregulated and top 10 downregulated circRNAs according to the level of N6-methyladenosine, and their around 20 target miRNAs with the most stable binding in SAP. Green circles represent hypomethylated circRNAs, red circles represent hypermethylated circRNAs and triangles represent miRNAs, compared with control group.
Figure 8 Expression of demethyltransferase in severe acute pancreatitis.
A: Relative mRNA levels of alkylation repair homolog 5 (ALKBH5) and fat mass and obesity related protein (FTO) (normalized by the quantity of GAPDH) in each group; B: Representative images of western blot detected with alkylation repair homolog 5 (ALKBH5), FTO, and GAPDH antibodies in control and severe acute pancreatitis (SAP) groups; C: Relative protein levels of ALKBH5 and FTO (measured as the ratio of ALKBH5, FTO to GAPDH by band density) in each group. Data are representative of at least three independent experiments. aP < 0.05 vs control group.
- Citation: Wu J, Yuan XH, Jiang W, Lu YC, Huang QL, Yang Y, Qie HJ, Liu JT, Sun HY, Tang LJ. Genome-wide map of N6-methyladenosine circular RNAs identified in mice model of severe acute pancreatitis. World J Gastroenterol 2021; 27(43): 7530-7545
- URL: https://www.wjgnet.com/1007-9327/full/v27/i43/7530.htm
- DOI: https://dx.doi.org/10.3748/wjg.v27.i43.7530


