Copyright
©The Author(s) 2020.
World J Gastroenterol. Dec 21, 2020; 26(47): 7584-7592
Published online Dec 21, 2020. doi: 10.3748/wjg.v26.i47.7584
Published online Dec 21, 2020. doi: 10.3748/wjg.v26.i47.7584
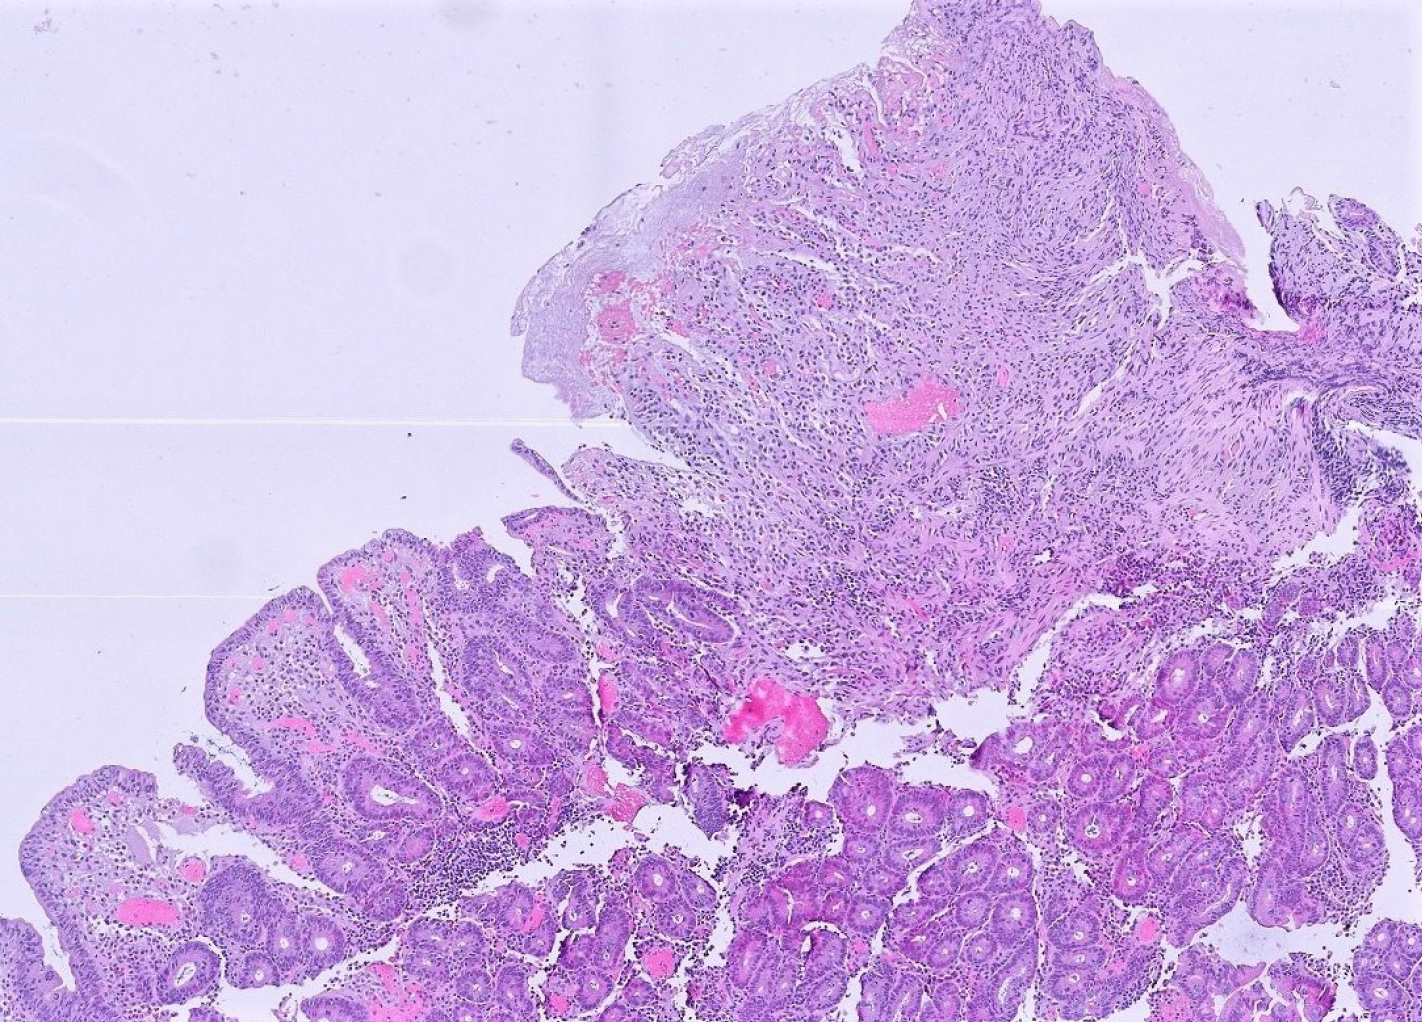
Figure 1 Biopsies from an area with ulcerative jejunitis.
On the right there is an erosion without lymphomatous involvement. Adjacent mucosa shows villous flattening. Magnification 200 ×.
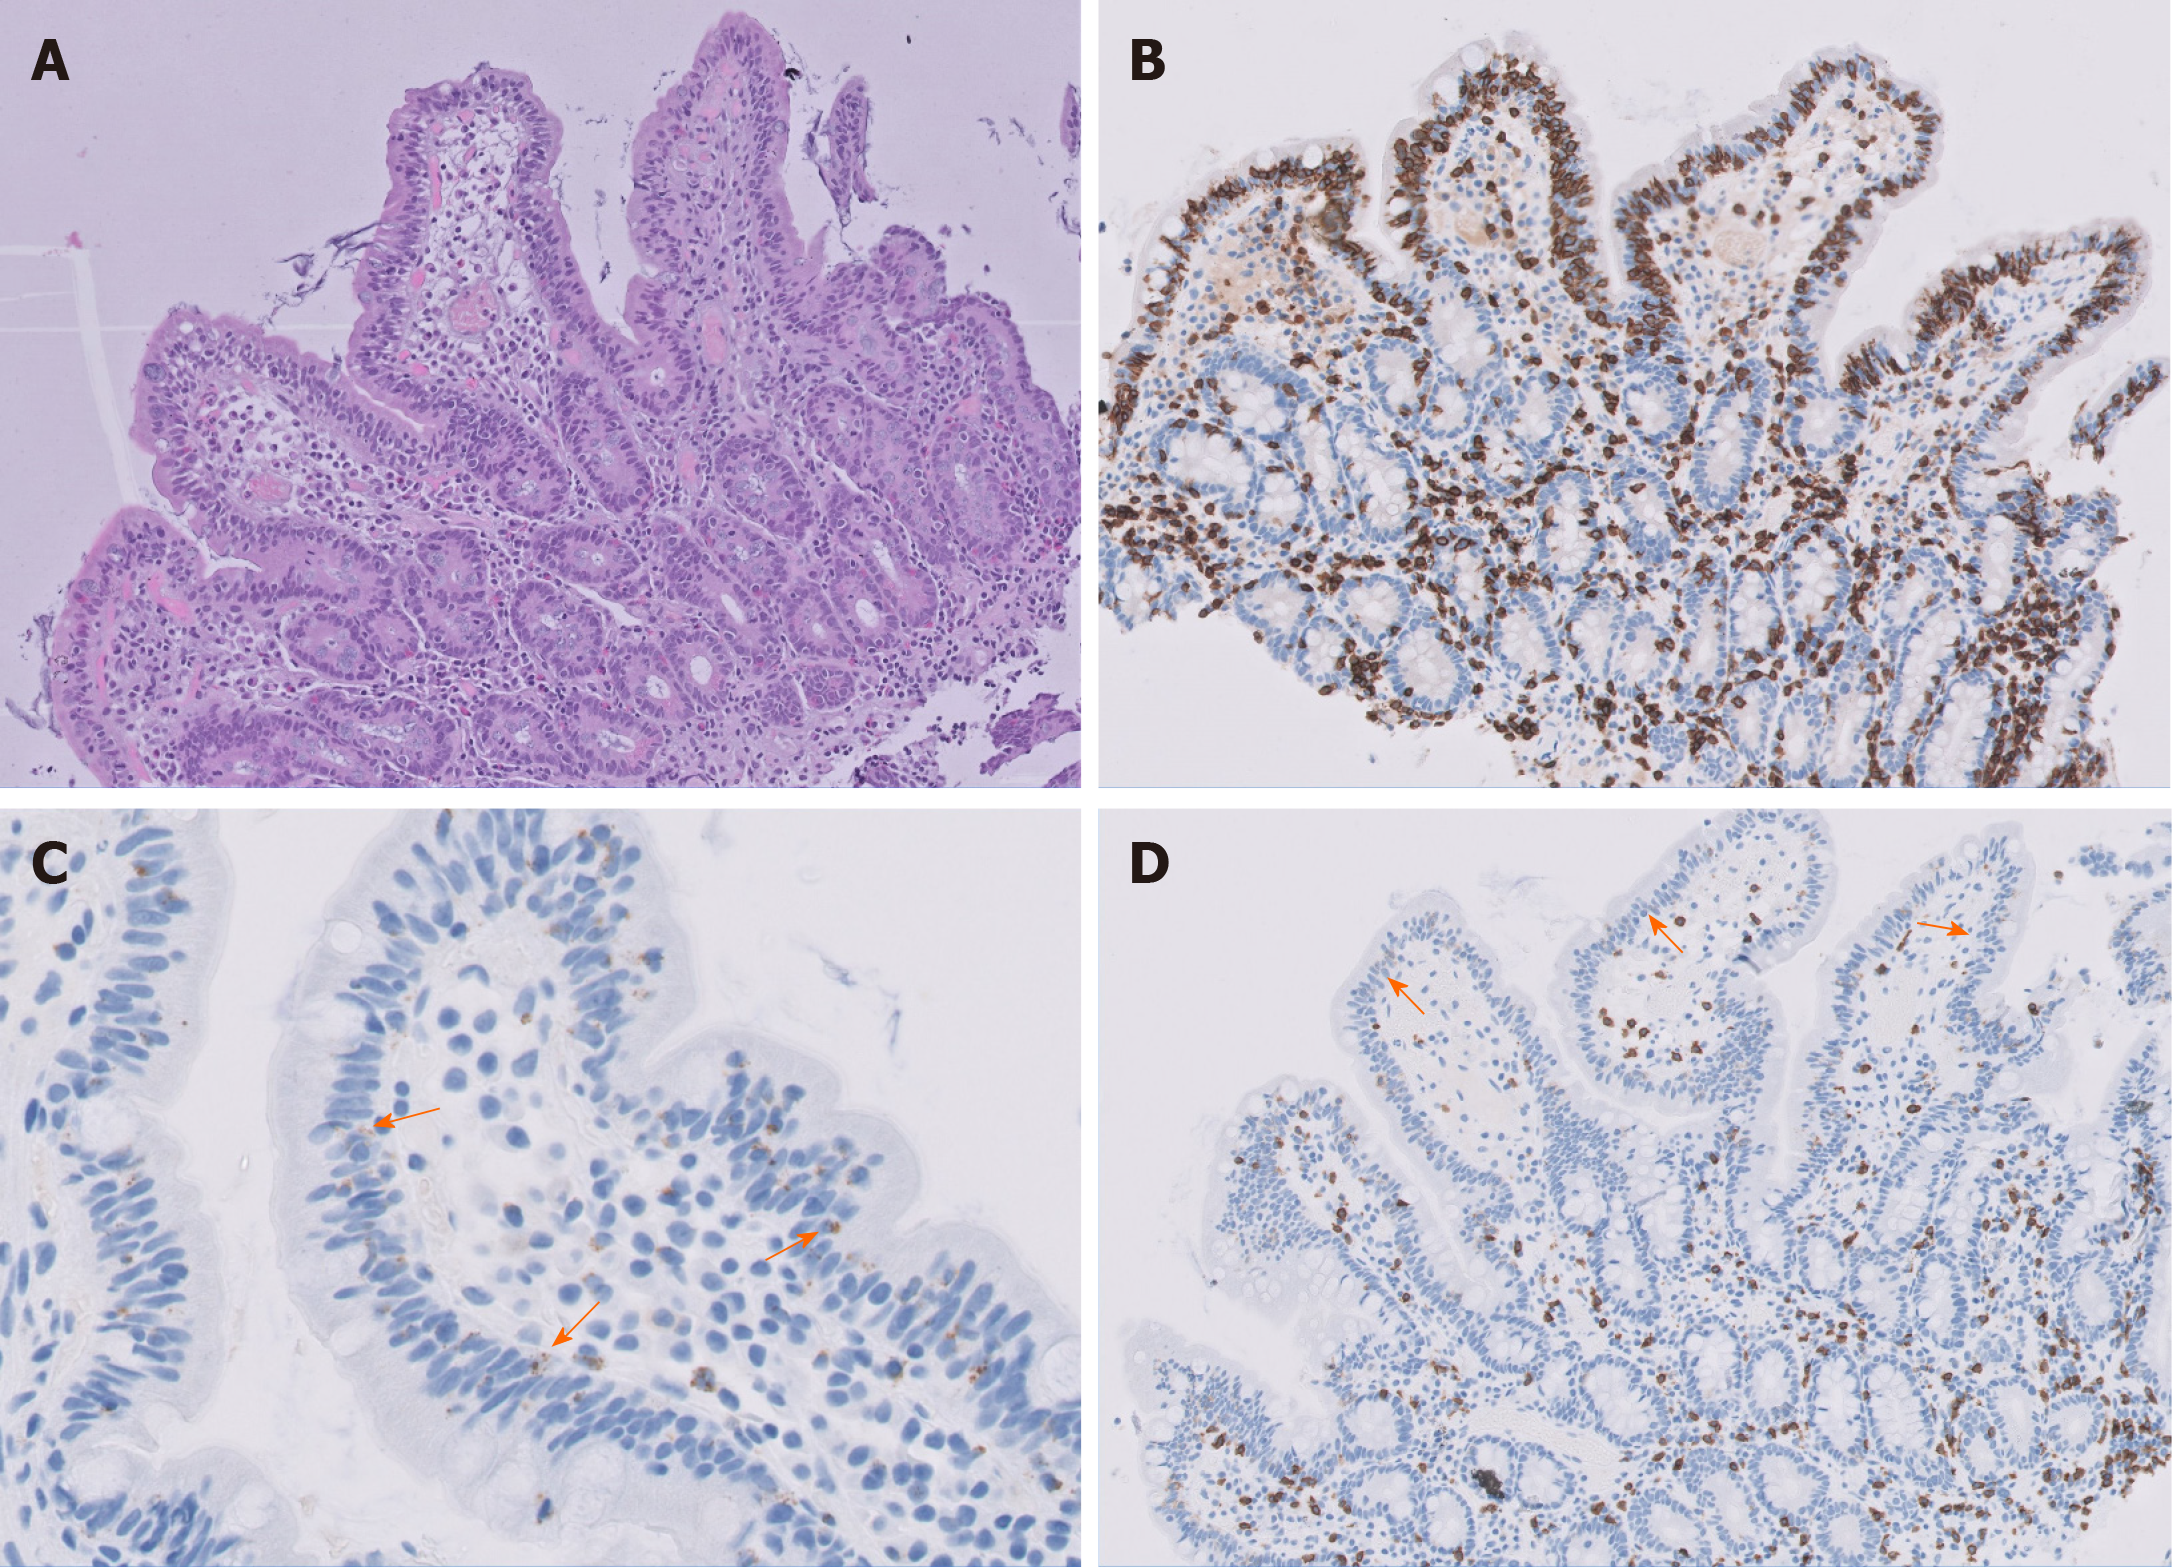
Figure 2 Histological presentation of refractory celiac disease type 2.
A: Normal villous architecture with an increase in intraepithelial lymphocytes. Hematoxylin and eosin; B: Intraepithelial CD3 positive lymphocytes (brown color) are abundant; C: Intraepithelial lymphocytes contain TIA-1 positive granules (brown color, arrow); D: Intraepithelial lymphocytes are CD8 negative (arrow), positive reaction in brown coloration. Magnification 200 × (A, B and D) and 400 × (C).
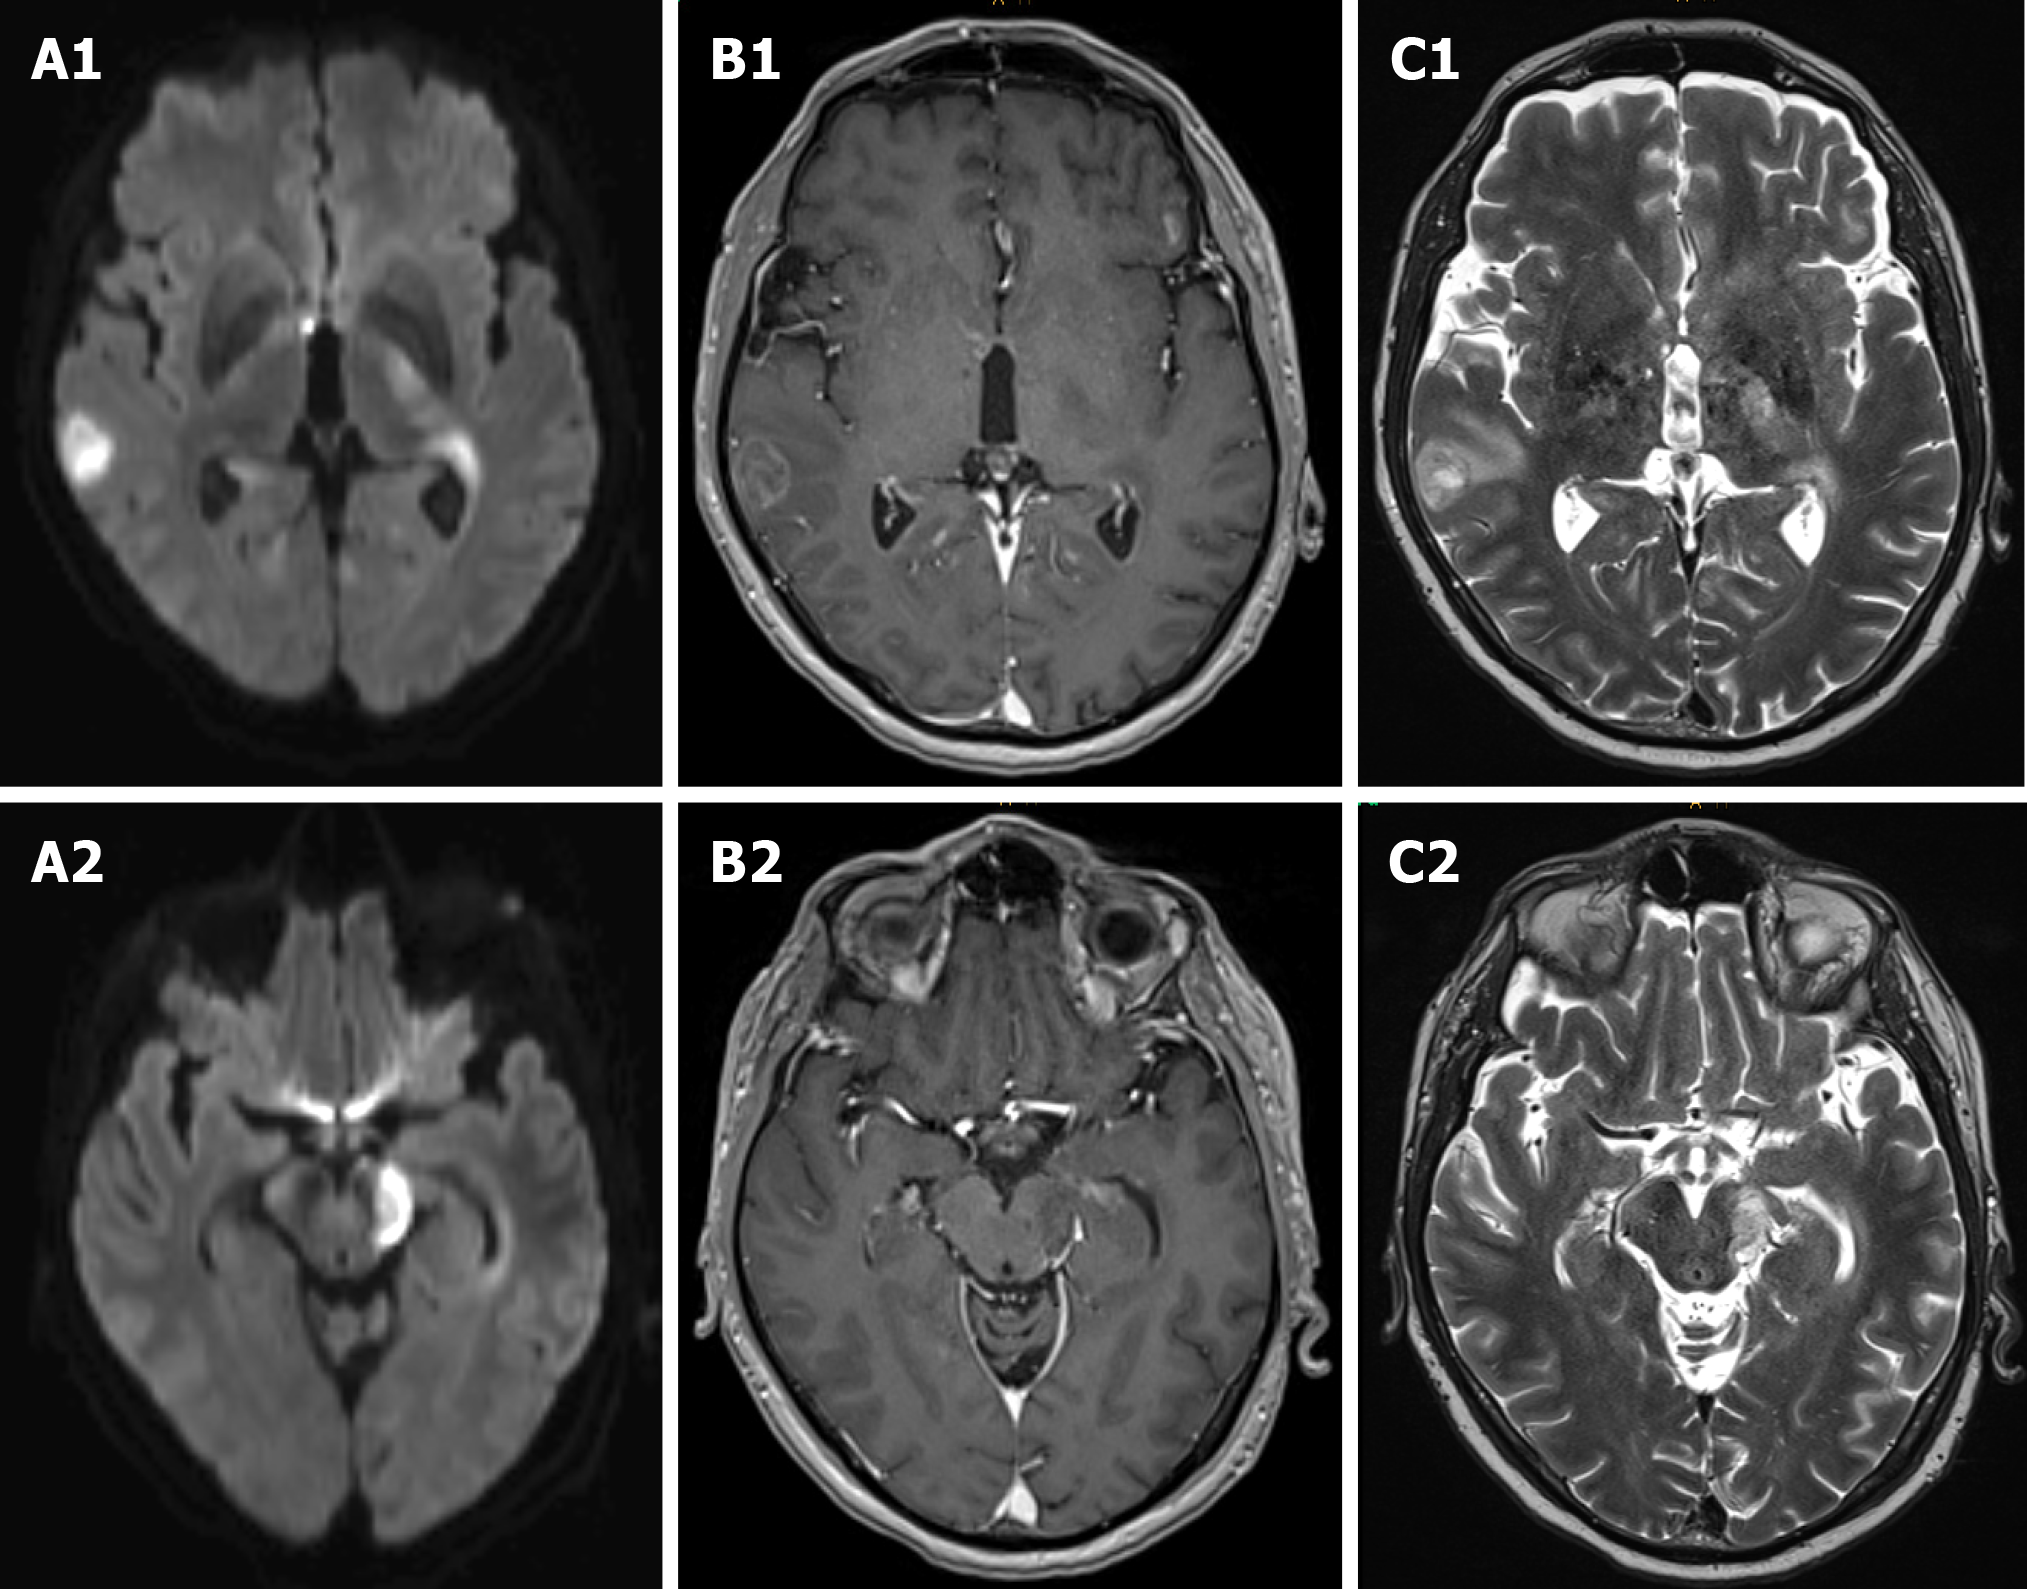
Figure 3 Cerebral magnetic resonance imaging images.
Cerebral magnetic resonance imaging demonstrated multifocal lesions in right temporal lobe, periventricular third ventricle right and lateral ventricle left, basal ganglia left and mesencephalon left with diffusion restriction on diffusion-weighted images as well as inhomogeneous and circular contrast enhancement as well as hyperintensities on T2-weighted images. A: Diffusion-weighted images (A1 and 2); B: Inhomogeneous and circular contrast enhancement (B1 and 2); C: T2-weighted images (C1 and 2).
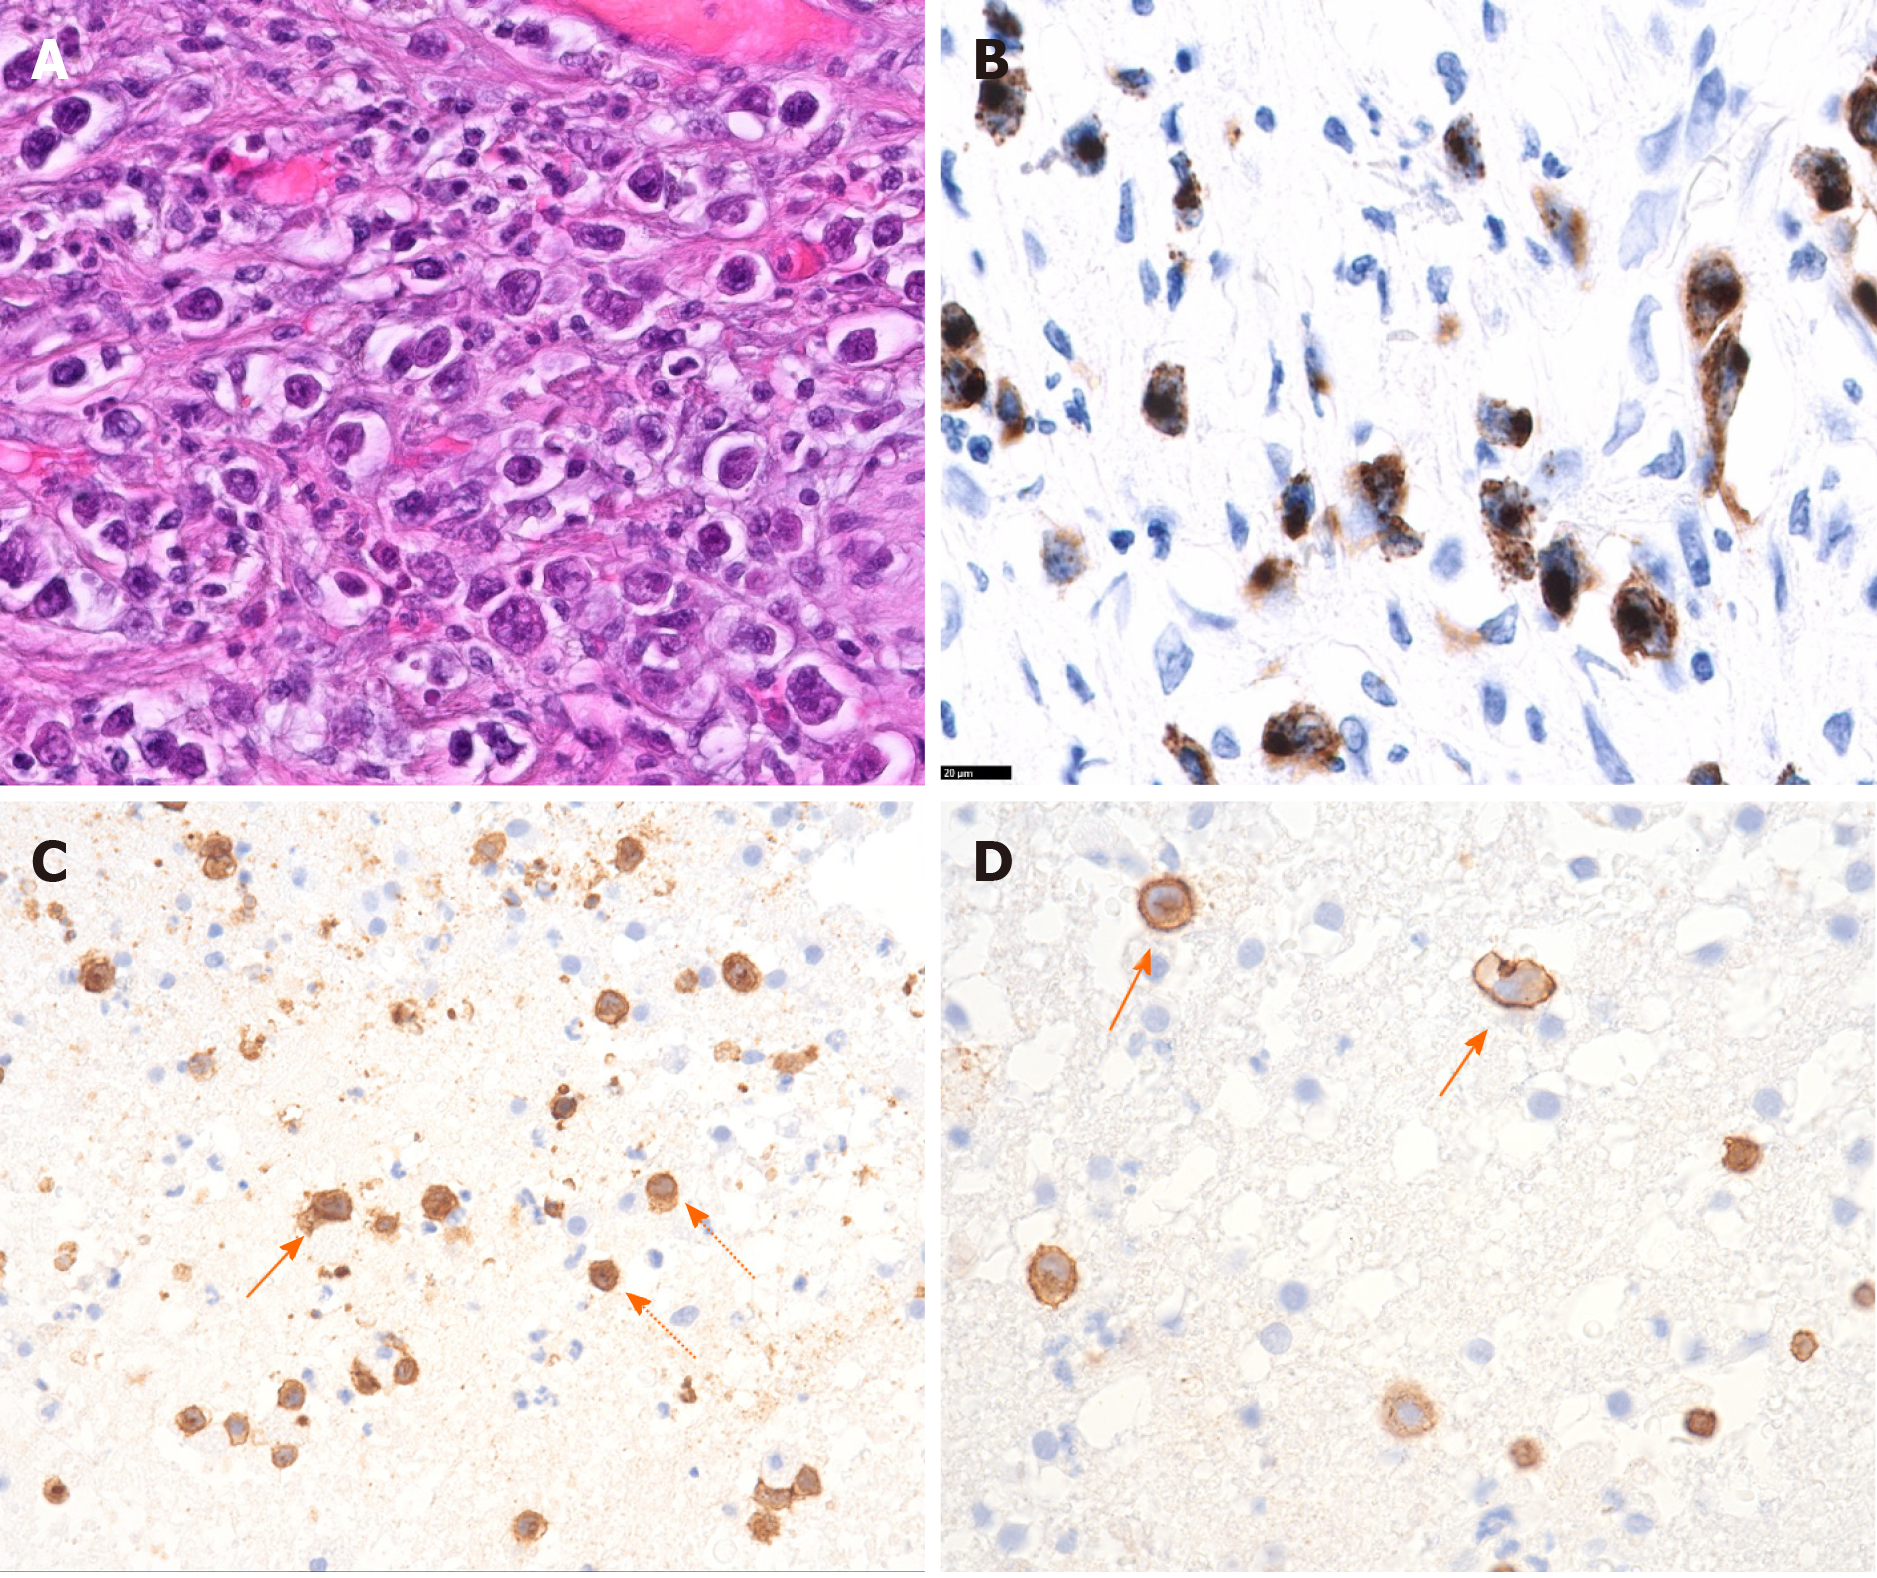
Figure 4 Histological presentation of enteropathy-associated T cell lymphoma.
A and B: Jejunal biopsy. Hematoxylin and eosin staining (A) showing large anaplastic tumor cells and immunohistochemical staining (B) showing granzyme B positive (brown) tumor cells; C and D: Cerebral biopsy. Infiltration of CD3 positive lymphoma cells (arrow) and non-malignant T lymphocytes (dotted arrow). Magnification 600 × (A, B and D) and 400 × (C).
- Citation: Horvath L, Oberhuber G, Chott A, Effenberger M, Tilg H, Gunsilius E, Wolf D, Iglseder S. Multiple cerebral lesions in a patient with refractory celiac disease: A case report. World J Gastroenterol 2020; 26(47): 7584-7592
- URL: https://www.wjgnet.com/1007-9327/full/v26/i47/7584.htm
- DOI: https://dx.doi.org/10.3748/wjg.v26.i47.7584


