Copyright
©The Author(s) 2020.
World J Gastroenterol. Dec 7, 2020; 26(45): 7153-7172
Published online Dec 7, 2020. doi: 10.3748/wjg.v26.i45.7153
Published online Dec 7, 2020. doi: 10.3748/wjg.v26.i45.7153
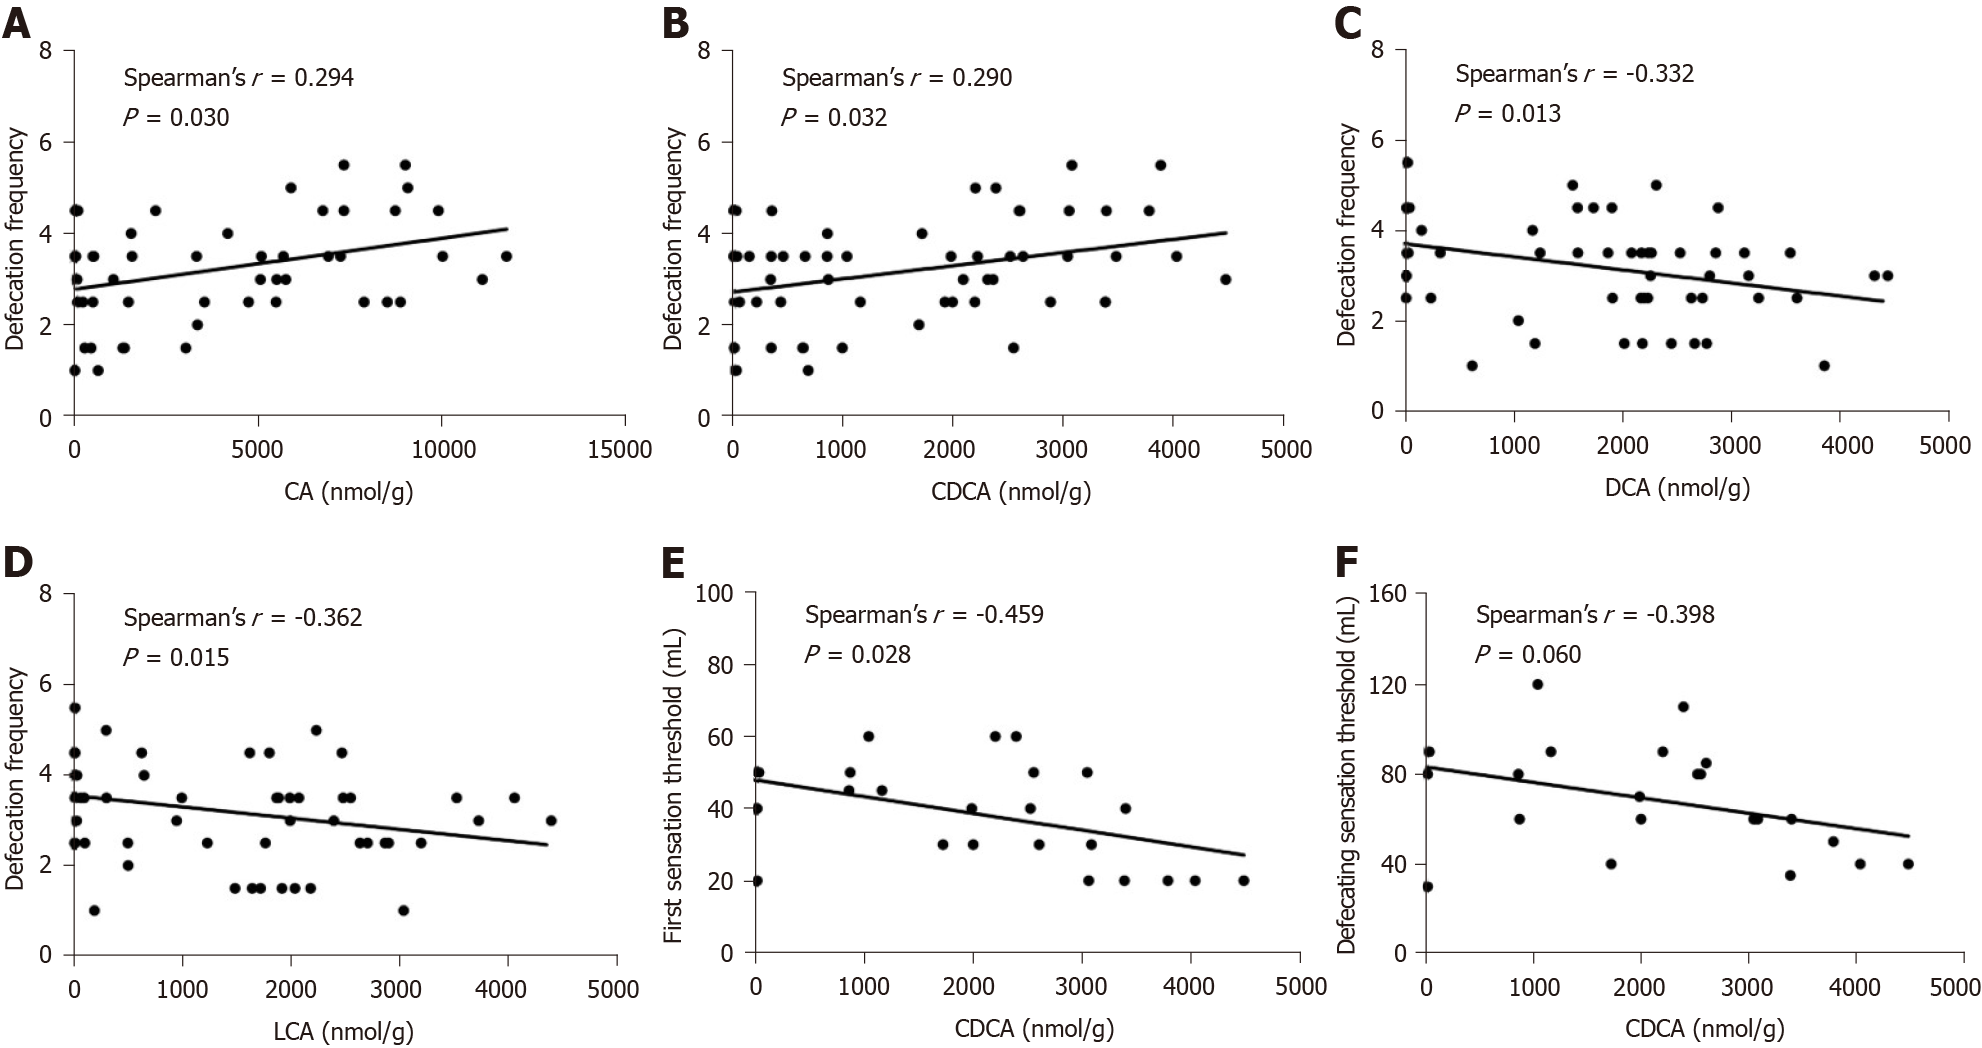
Figure 1 Correlations between fecal bile acids and clinical parameters in patients with diarrhea-predominant irritable bowel syndrome.
A-D: Defecation frequency was positively correlated with the level of cholic acid and chenodeoxycholic acid (CDCA), and negatively correlated with the level of deoxycholic acid and lithocholic acid; E: The first sensation threshold was negatively correlated with CDCA; F: The defecating sensation threshold tended to be negatively correlated with CDCA. CA: Cholic acid; CDCA: Chenodeoxycholic acid; DCA: Deoxycholic acid; LCA: Lithocholic acid.
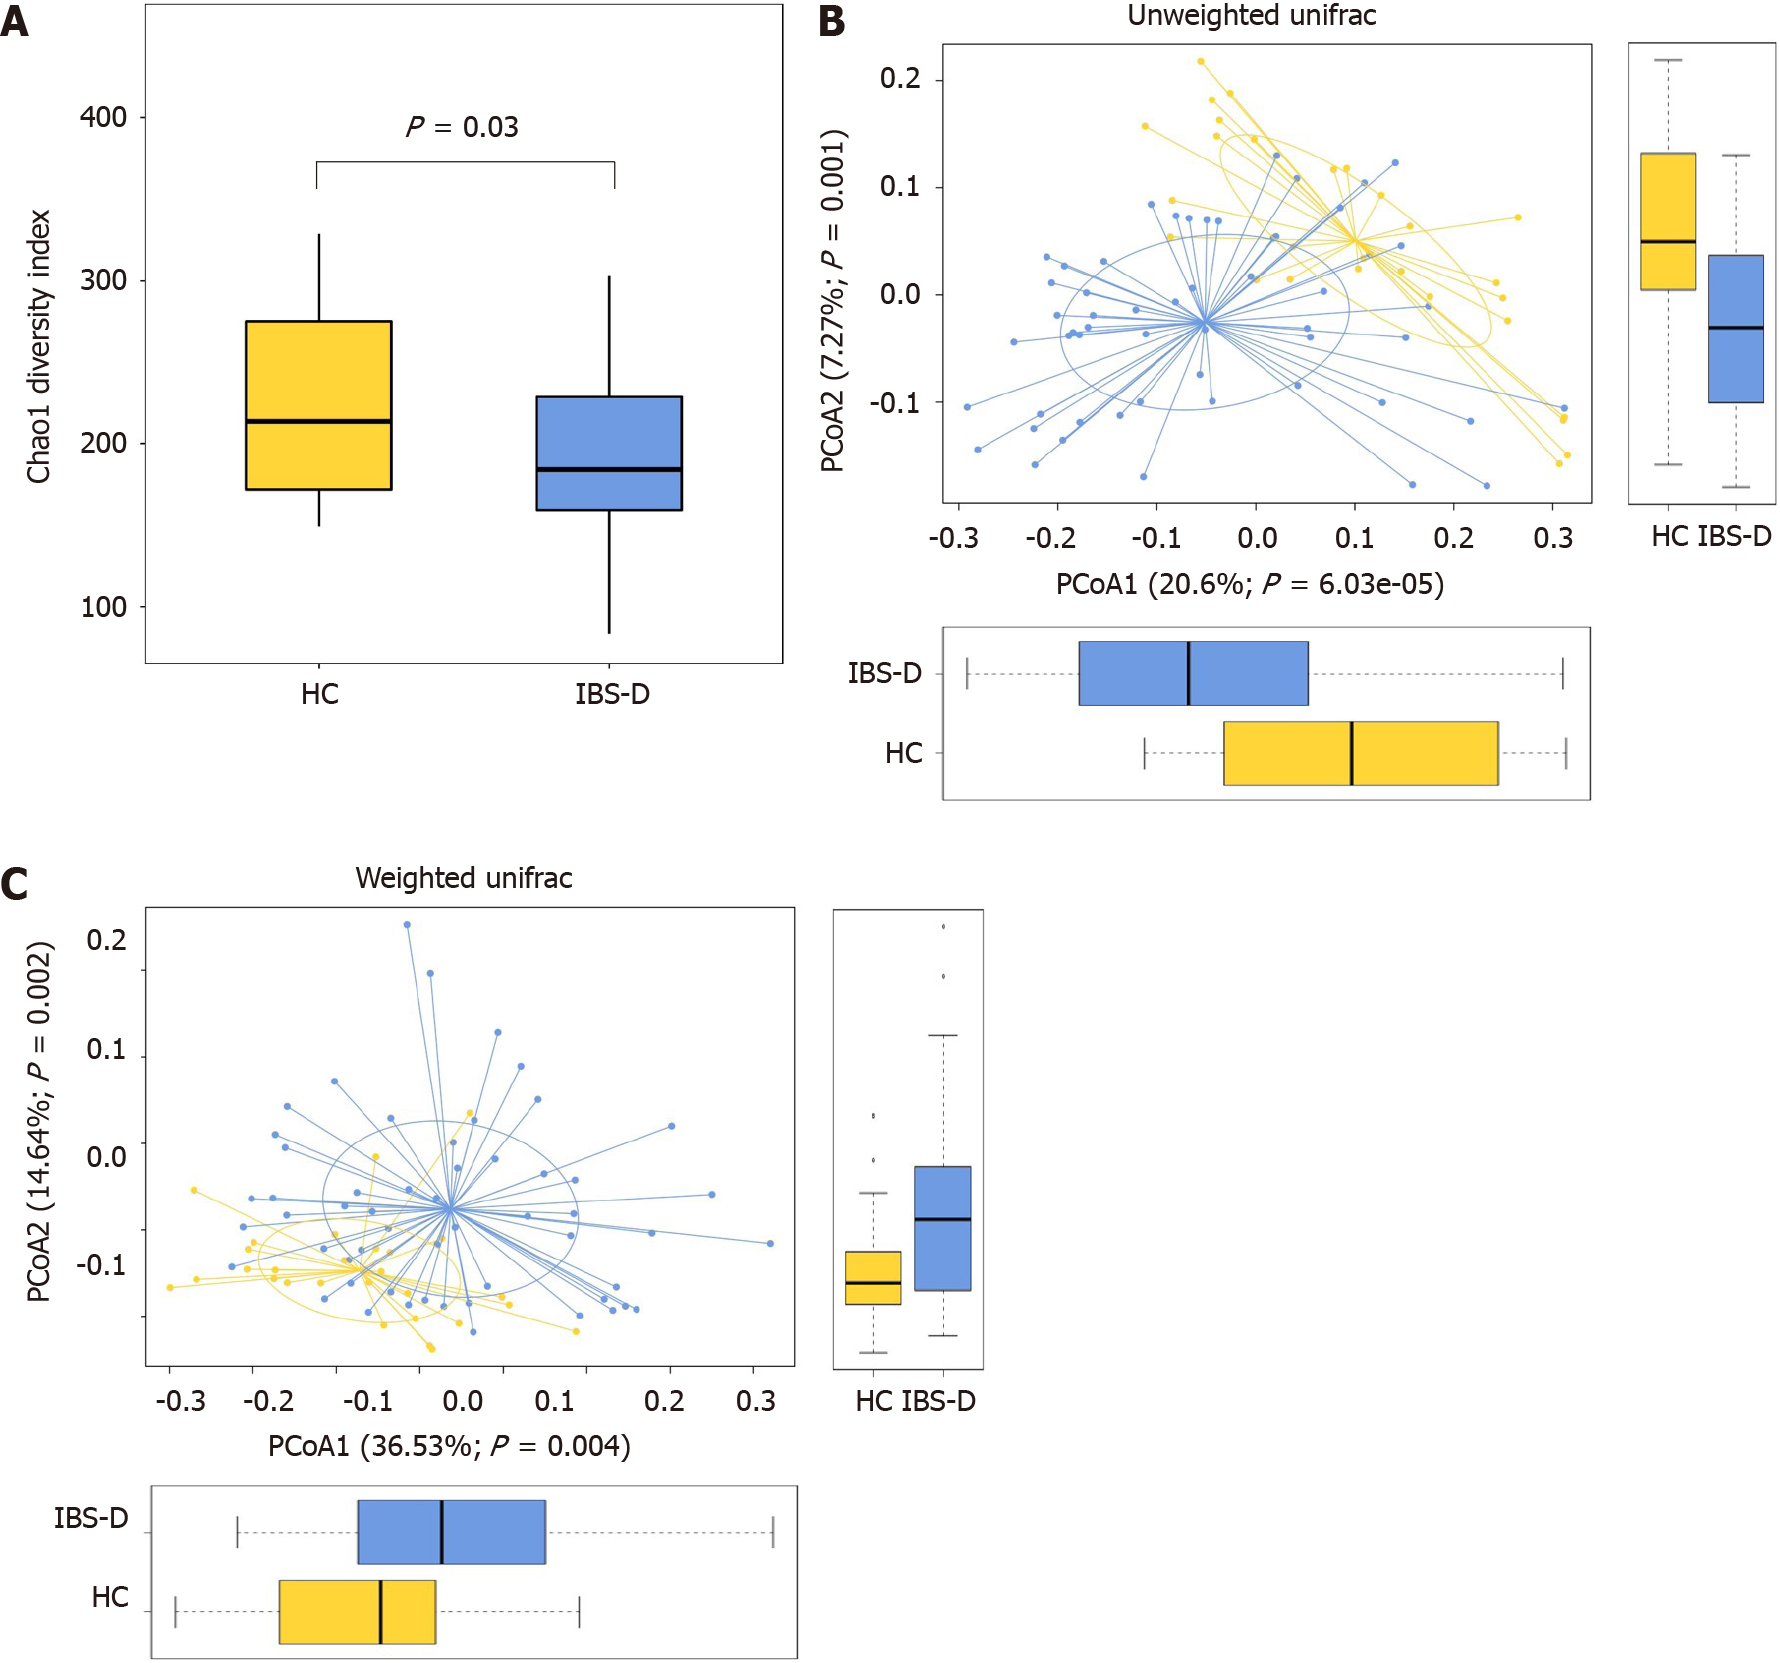
Figure 2 Fecal bacterial structures of patients with diarrhea-predominant irritable bowel syndrome and healthy controls.
A: Chao1 index in the irritable bowel syndrome with predominant diarrhea (IBS-D) group and the healthy control (HC) group, Chao1 index was decreased significantly in the IBS-D group; B and C: Weighted and unweighted principal coordinate analysis of fecal bacterial in the IBS-D and HC groups, both differed significantly between the two groups. Boxes indicate the interquartile range; lines inside the boxes indicate the medians; the two whiskers indicate the maximum and minimum of the data; the points outside the box indicate outliers. PCoA: Principal coordinate analysis.
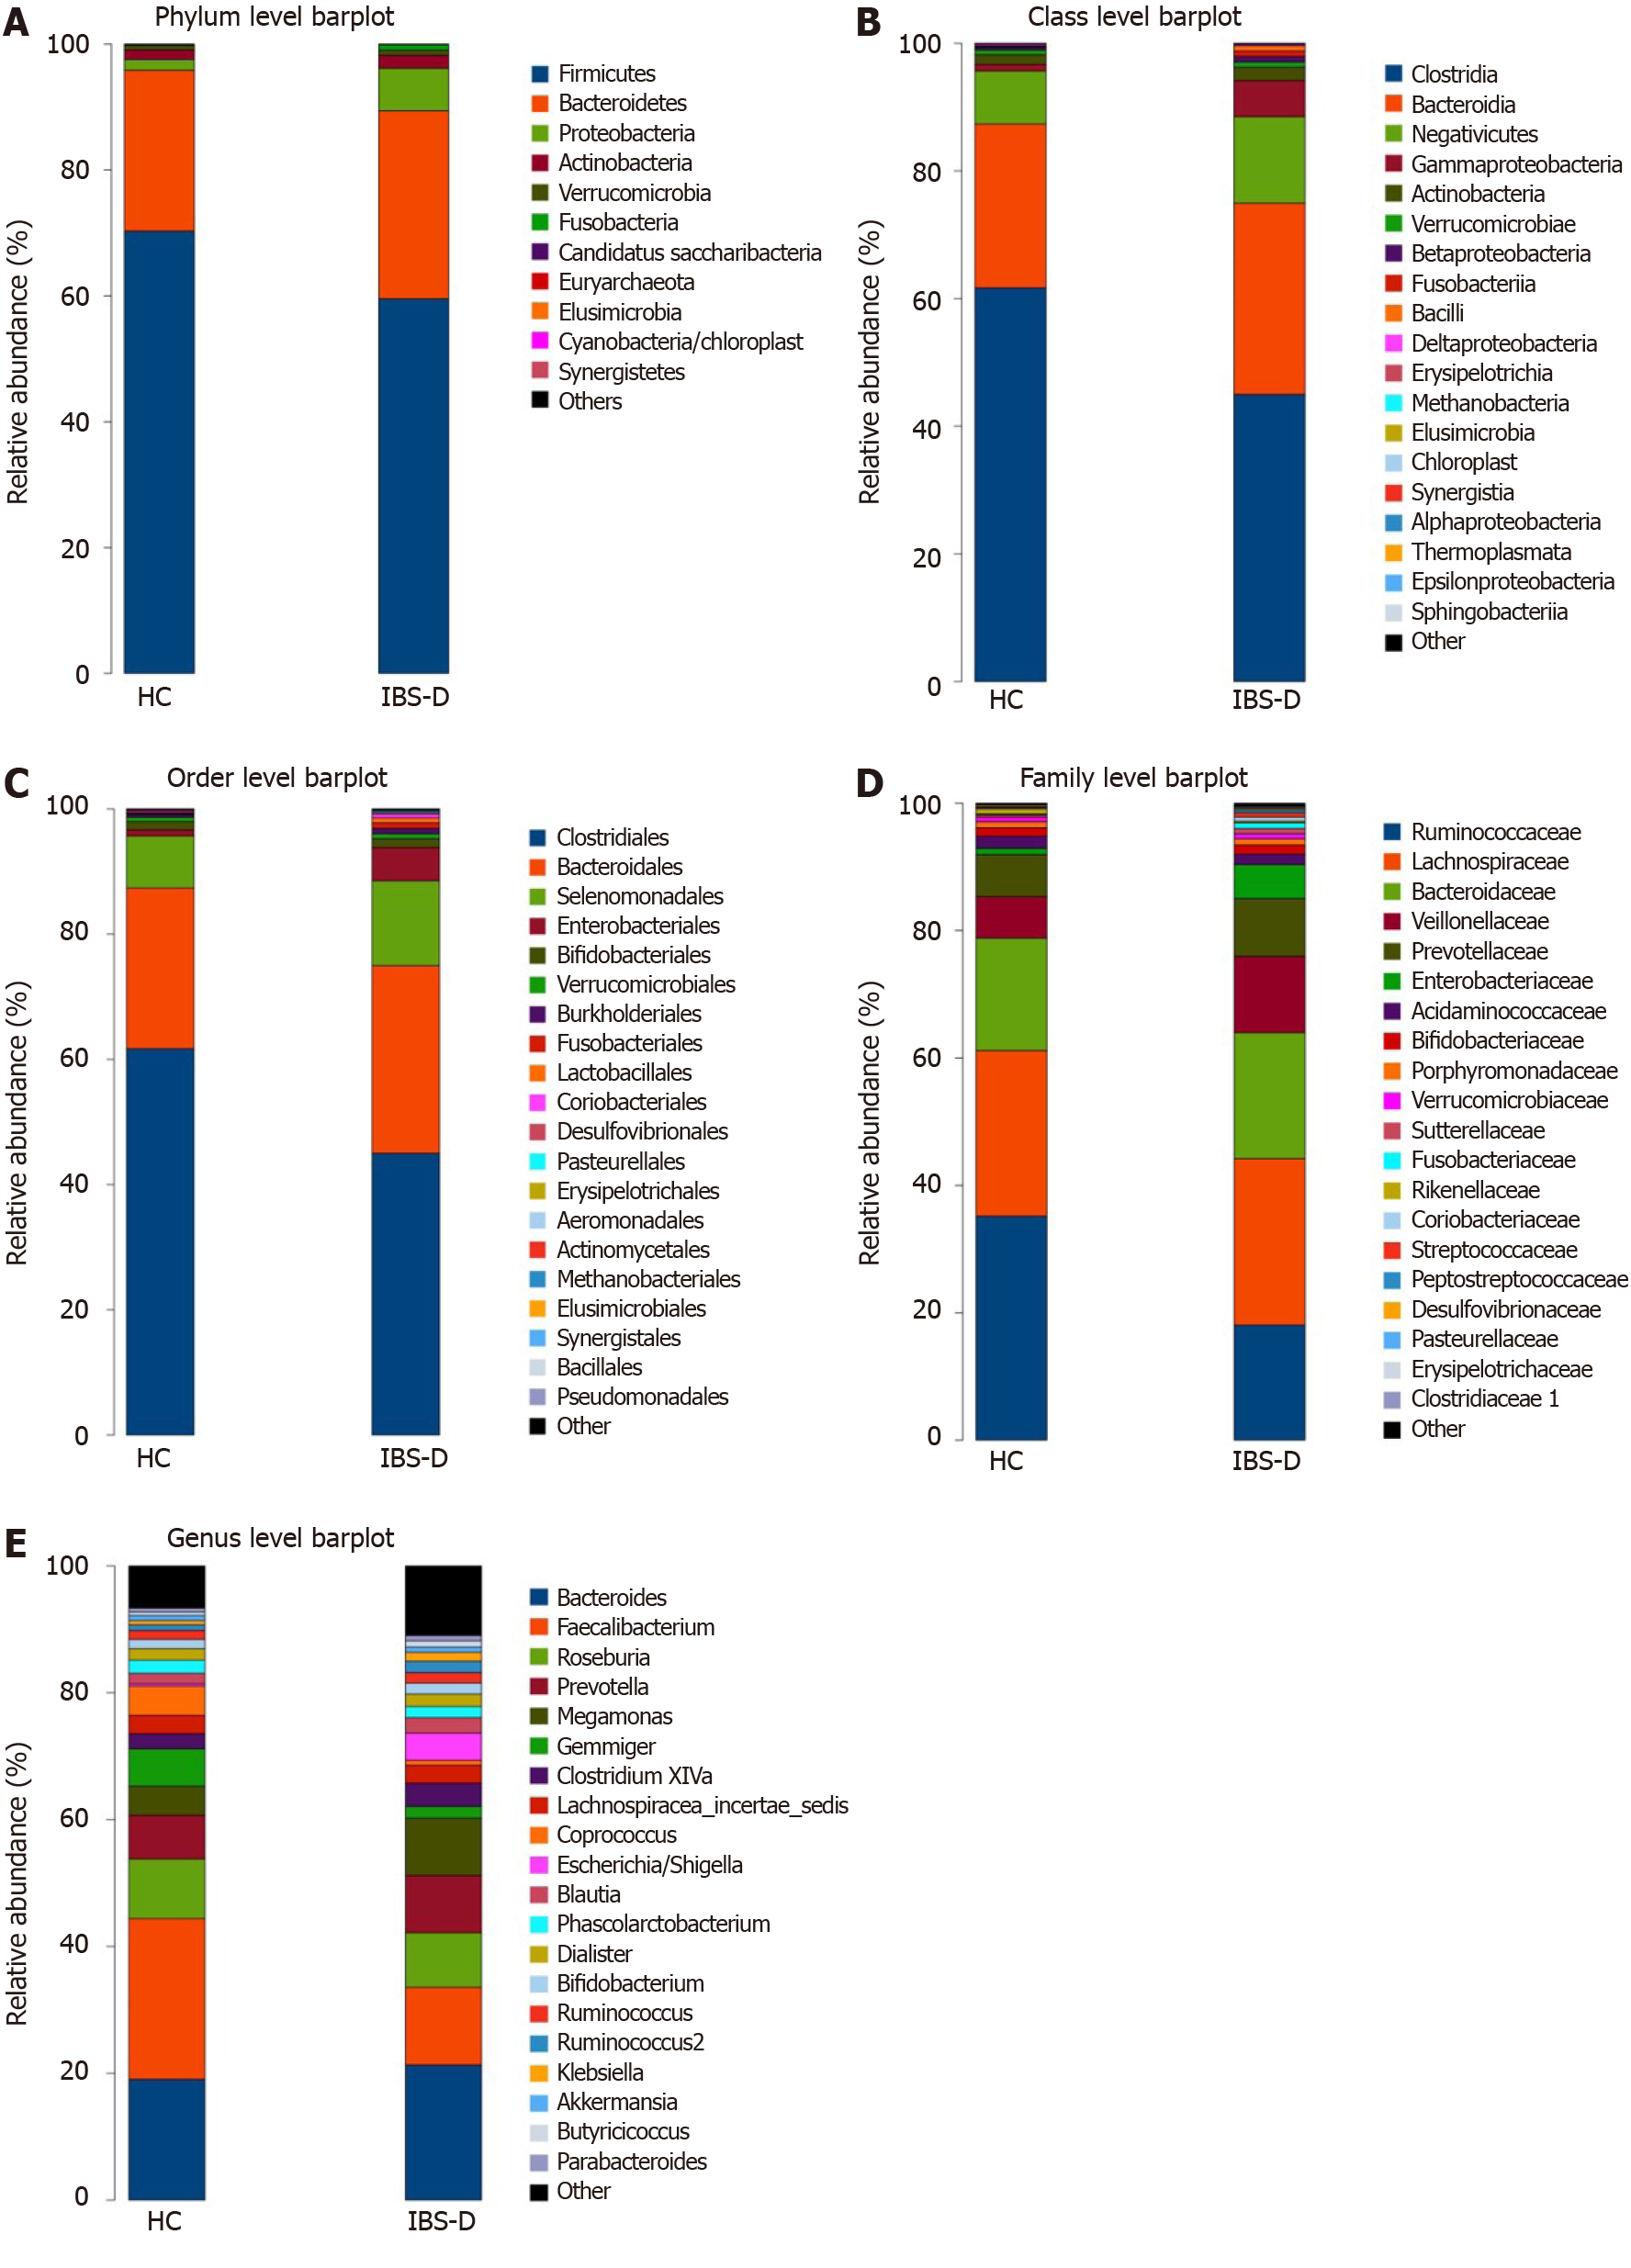
Figure 3 Configuration of fecal bacterial of patients with diarrhea-predominant irritable bowel syndrome and healthy controls.
A-E: Relative bacterial abundance of fecal bacterial at phylum (A), class (B), order (C), family (D), and genus (E) levels in the irritable bowel syndrome with predominant diarrhea group and the healthy control group. IBS-D: Irritable bowel syndrome with predominant diarrhea; HC: Healthy control.
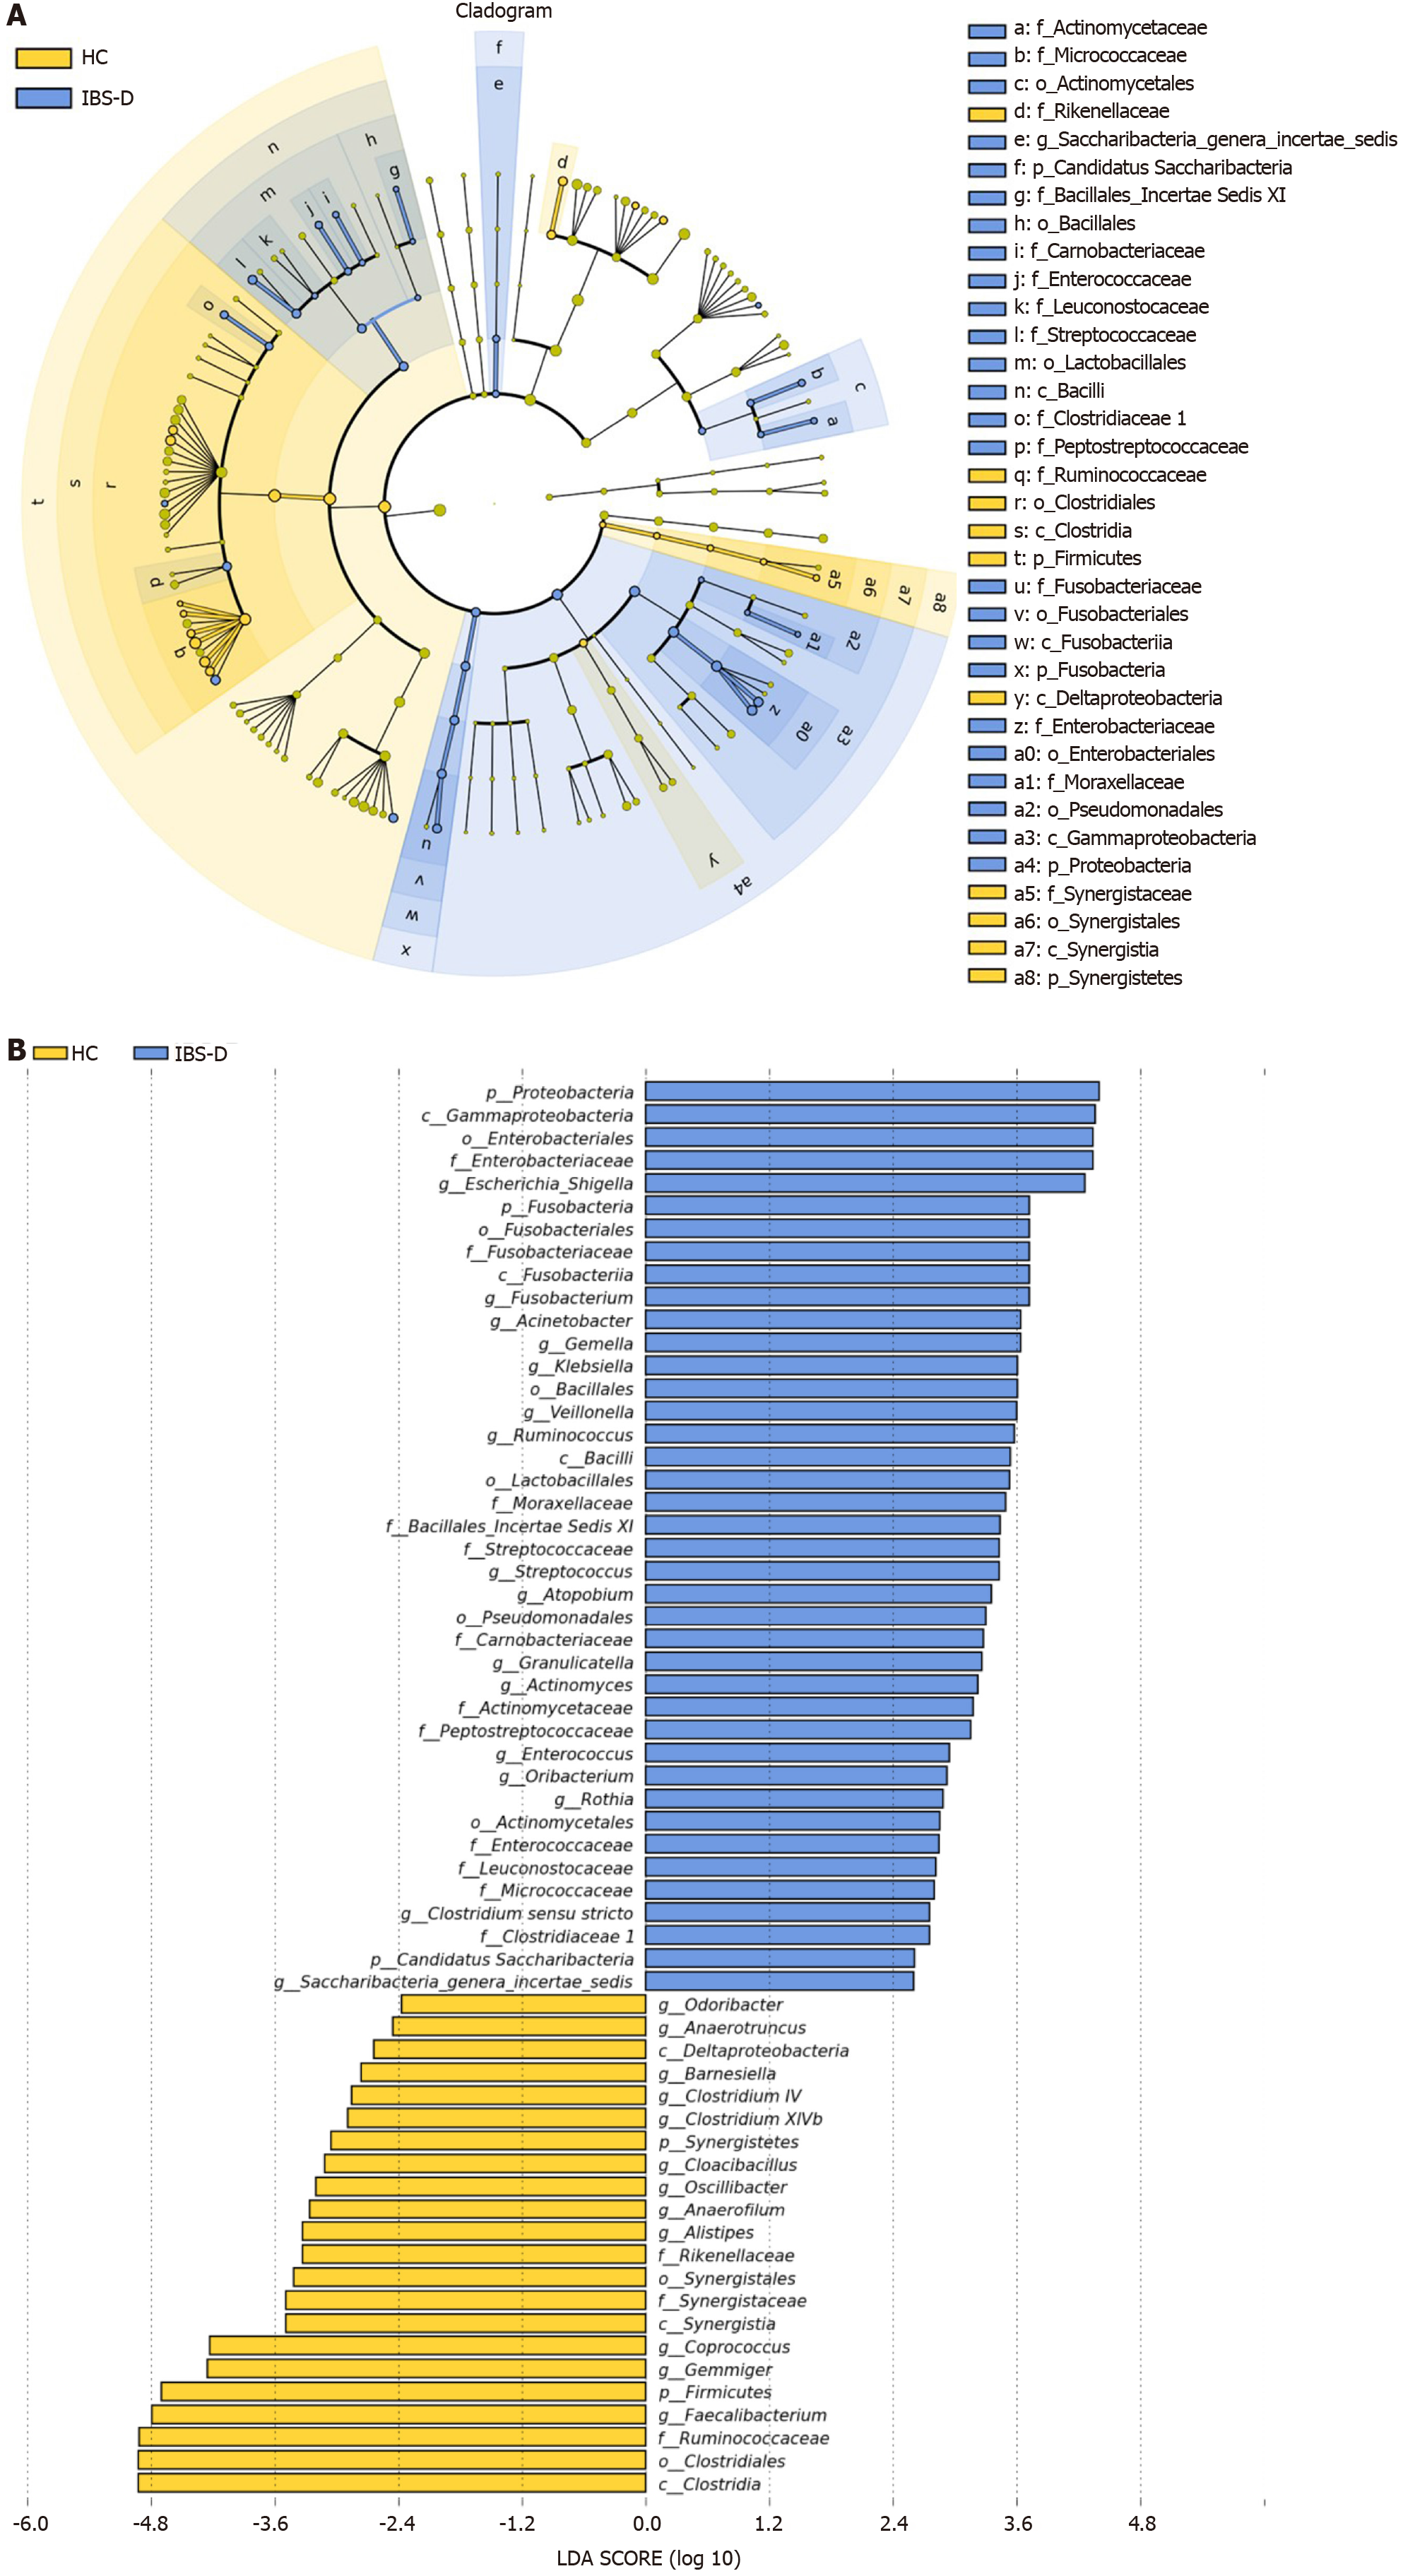
Figure 4 Linear discriminant analysis effect size analysis of fecal bacterial of patients with diarrhea-predominant irritable bowel syndrome and healthy controls.
A: The cladogram showed enriched taxa in the irritable bowel syndrome with predominant diarrhea (IBS-D) group (blue) and the healthy control (HC) group (yellow); the taxa represented by the English letters in the cladogram are shown in the legend on the right; B: Taxa enriched in the IBS-D group are indicated with a positive linear discriminant analysis (LDA) score (blue) and taxa enriched in the HC group are indicated with a negative score (yellow); only taxa with LDA effect size (LEfSe) P values < 0.05 and LDA scores ≥ 2.0 are presented.
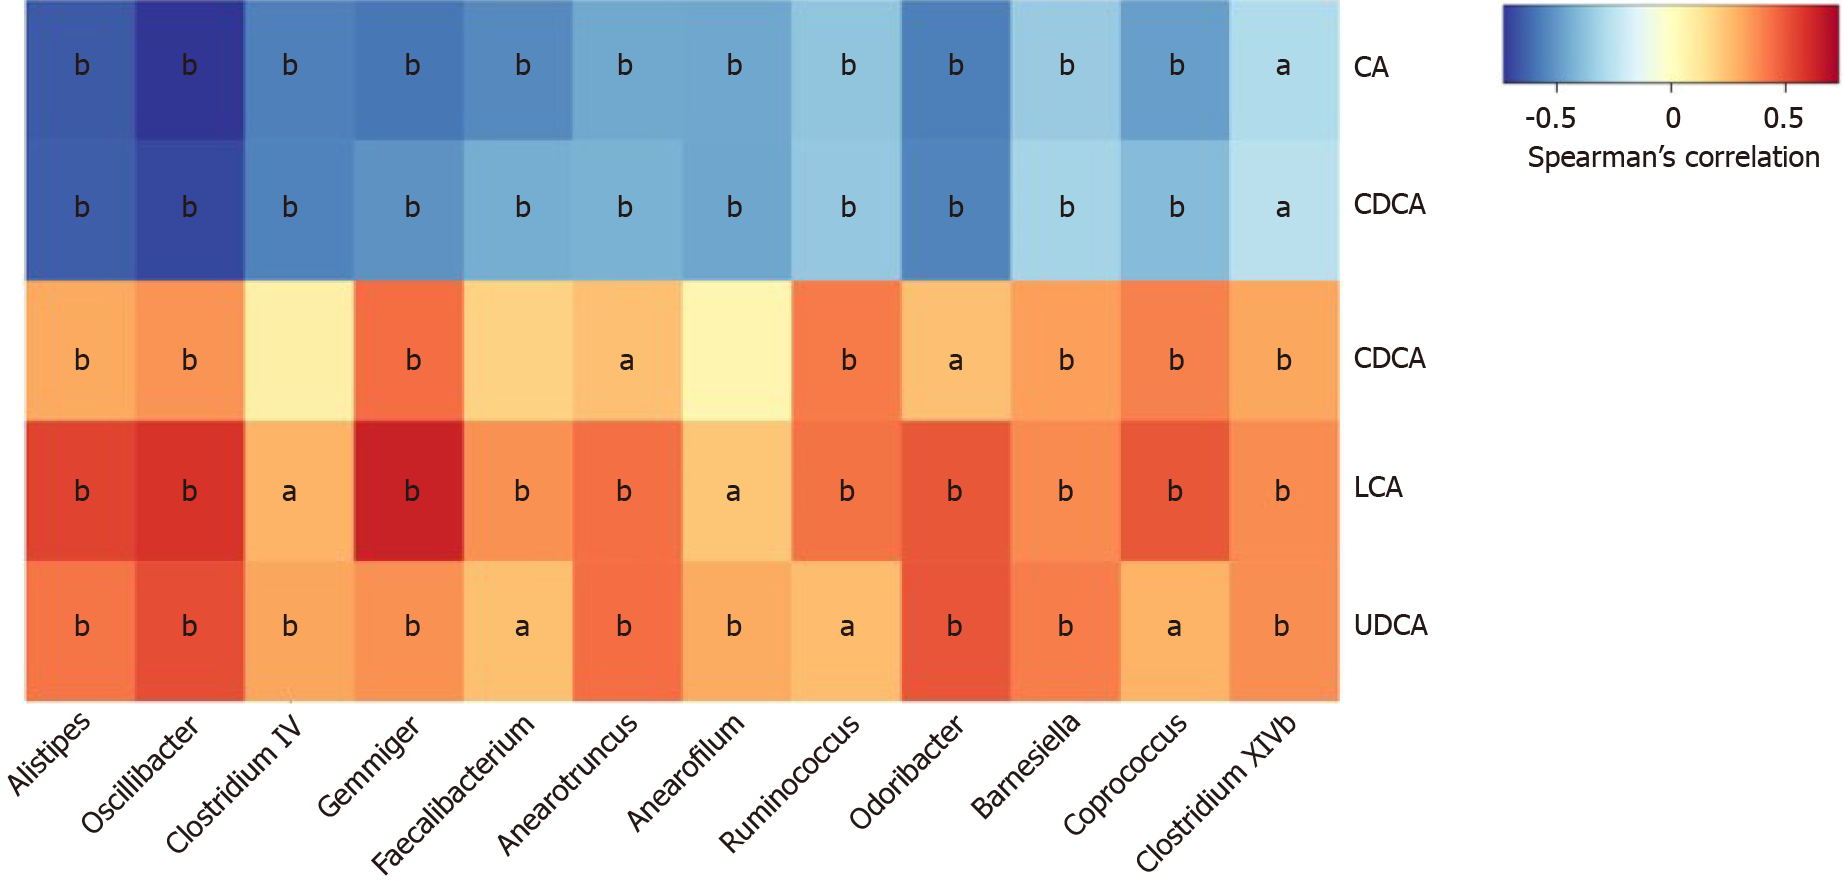
Figure 5 Correlations between fecal bile acids and microbiota composition in all subjects.
The heatmap presents the Spearman correlation coefficients between unconjugated fecal bile acids and the distinguishing genera in all subject. Seven genera belong to the family Ruminococcaceae (Oscillibacter, Clostridium IV, Gemmiger, Anaerofilum, Anaerotruncus, Faecalibacterium, and Ruminococcus); one genus belongs to the family Rikenellaceae (Alistipes); two genera belong to the family Porphyromonadaceae (Odoribacter and Barnesiella); two genera belong to the family Lachnospiraceae (Coprococcus and Clostridium XlVb). All of the genera were decreased significantly in the IBS-D group except for Ruminococcus. aP < 0.05, bP < 0.01. CA: Cholic acid; CDCA: Chenodeoxycholic acid; DCA: Deoxycholic acid; LCA: Lithocholic acid; UDCA: Ursodeoxycholic acid.
- Citation: Wei W, Wang HF, Zhang Y, Zhang YL, Niu BY, Yao SK. Altered metabolism of bile acids correlates with clinical parameters and the gut microbiota in patients with diarrhea-predominant irritable bowel syndrome. World J Gastroenterol 2020; 26(45): 7153-7172
- URL: https://www.wjgnet.com/1007-9327/full/v26/i45/7153.htm
- DOI: https://dx.doi.org/10.3748/wjg.v26.i45.7153


