Copyright
©The Author(s) 2020.
World J Gastroenterol. Nov 28, 2020; 26(44): 7061-7075
Published online Nov 28, 2020. doi: 10.3748/wjg.v26.i44.7061
Published online Nov 28, 2020. doi: 10.3748/wjg.v26.i44.7061
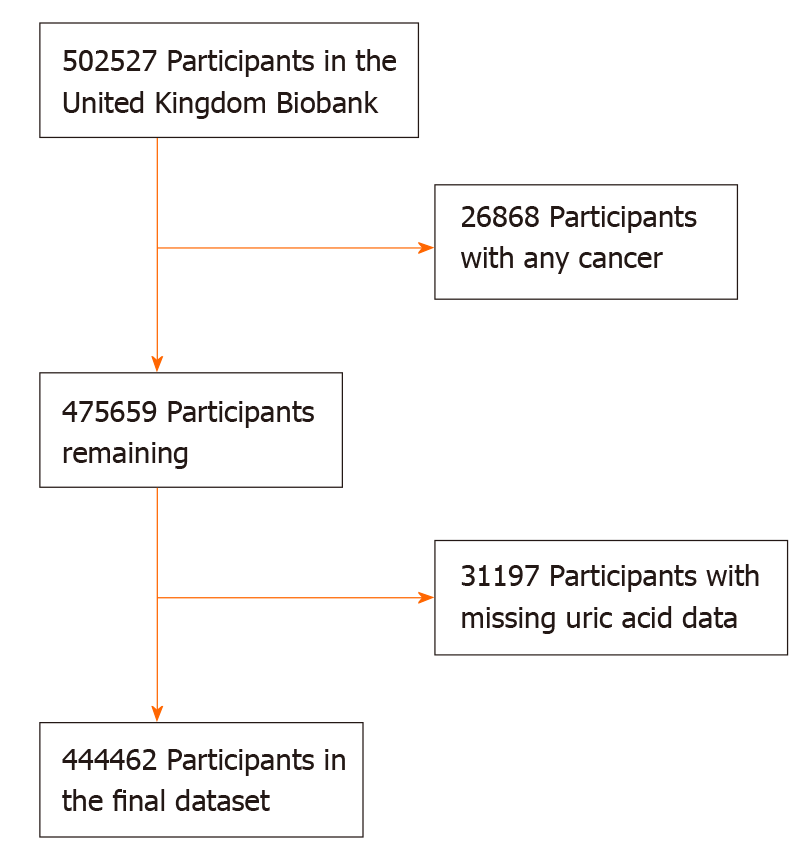
Figure 1 Flow chart of participant inclusion and exclusion.
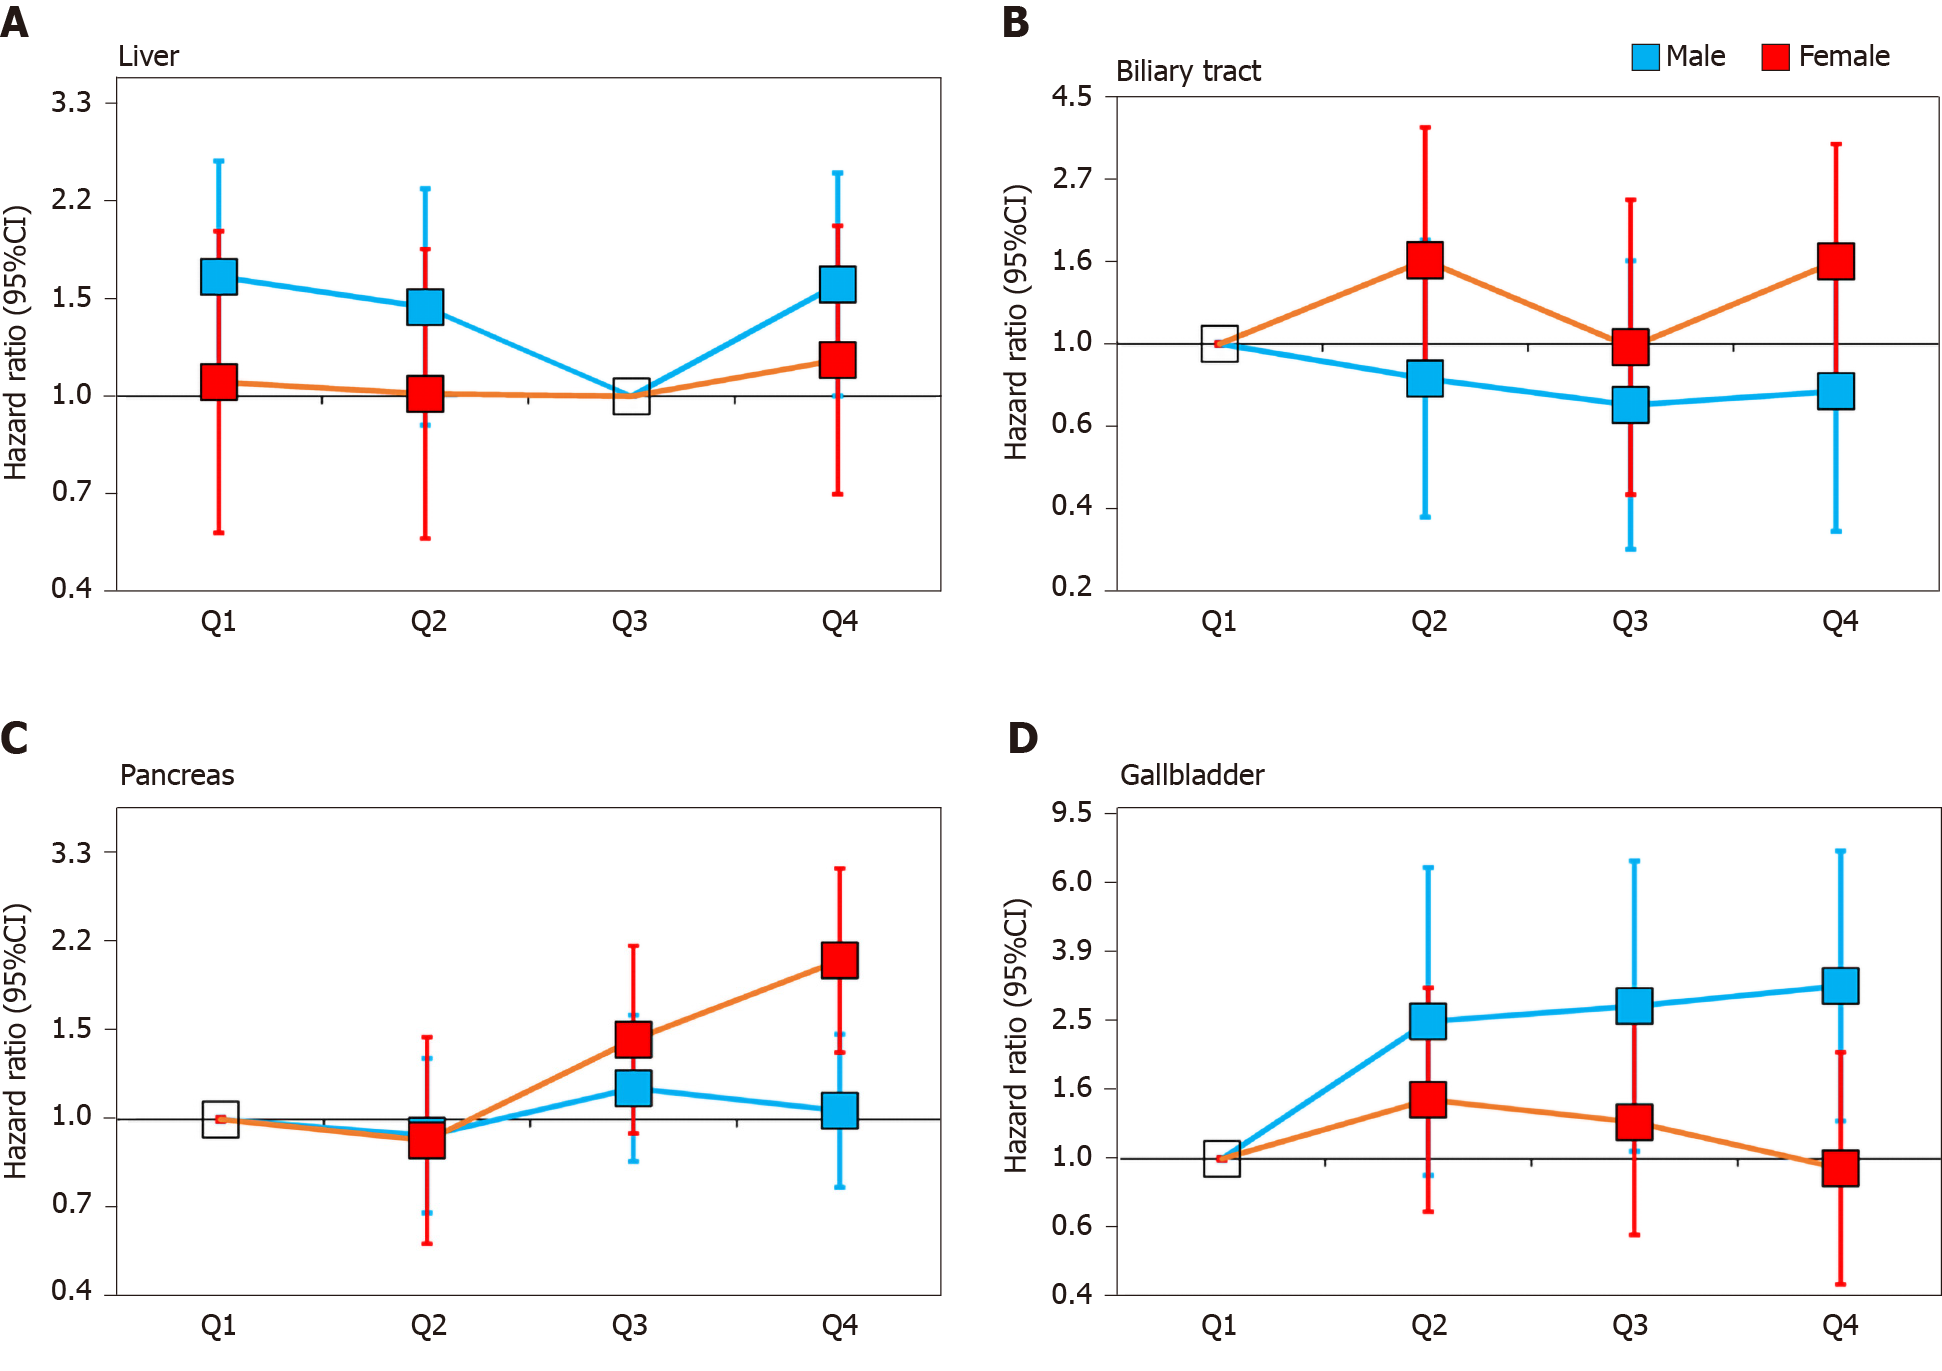
Figure 2 Associations between uric acid and hepatobiliary-pancreatic cancer stratified by gender.
Adjusted for age, education, ethnic, family history of cancer, alcohol intake, smoking status, annual household income, fruit and vegetable intake and physical activity and body mass index. A: Liver; B: Biliary tract; C: Pancreas; D: Gallbladder. CI: Confidence interval.
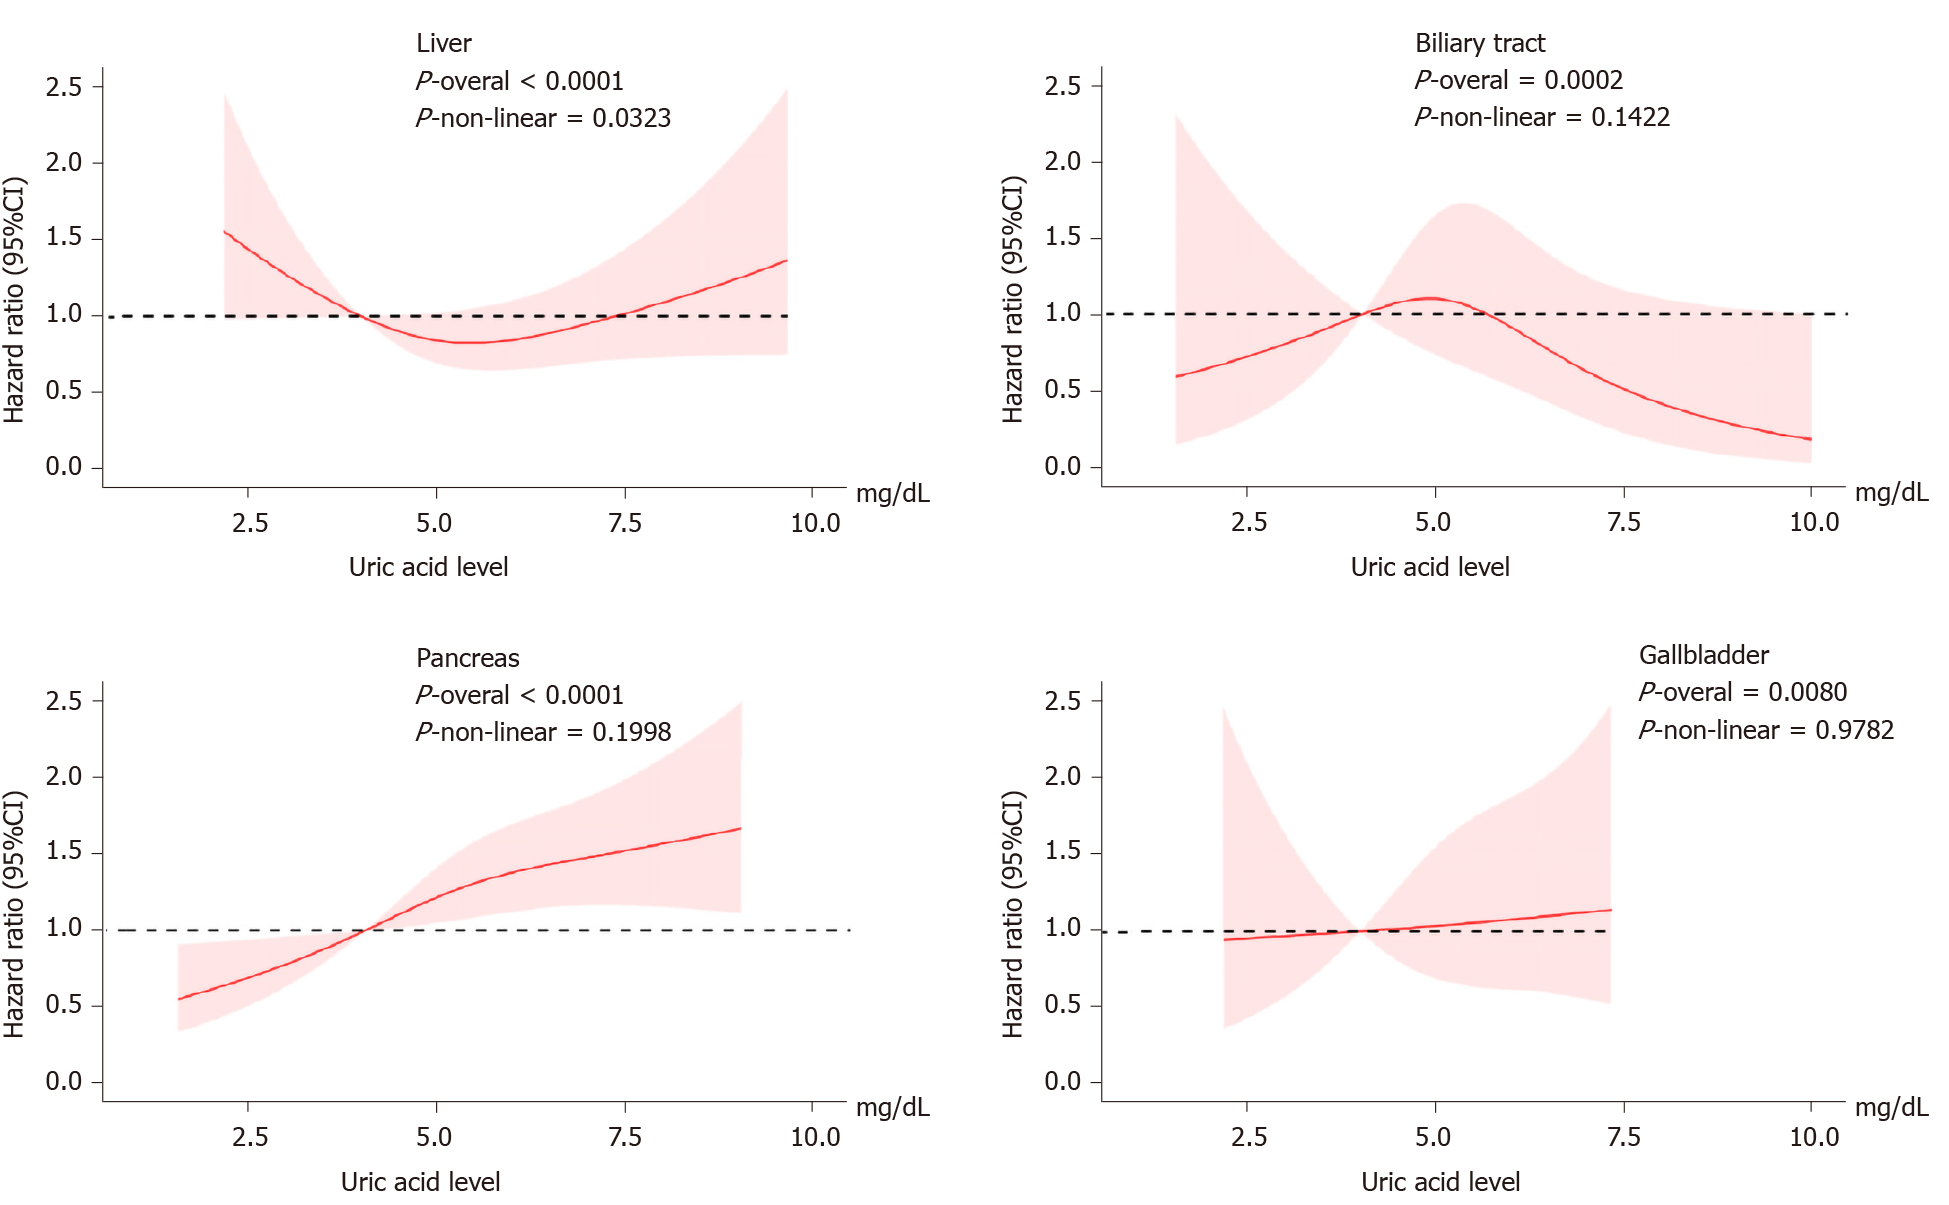
Figure 3 Dose response of uric acid and hepatobiliary-pancreatic cancer risk.
Adjusted for genders, age, education, ethnic, family history of cancer, alcohol intake, smoking status, annual household income, fruit and vegetable intake and physical activity and body mass index. The reference uric acid level for these plots (with hazard ratio fixed as 1.0) was 4.0 mg/dL. CI: Confidence interval.
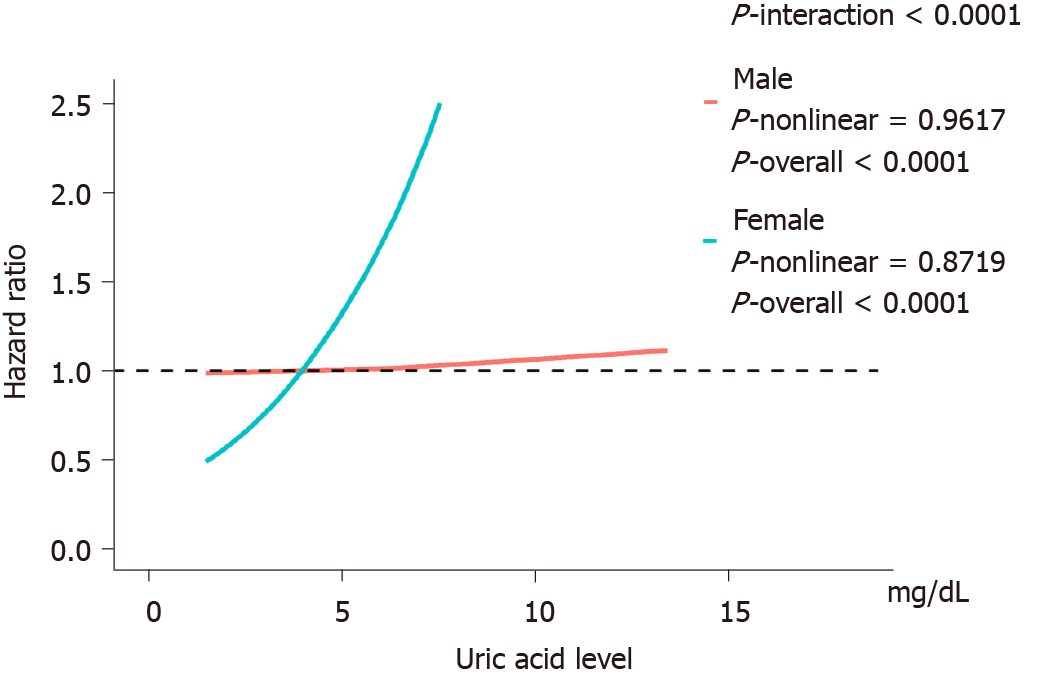
Figure 4 Association between uric acid level and pancreatic cancer with effect modification by gender.
Adjusted for age, education, ethnic, family history of cancer, alcohol intake, smoking status, annual household income, fruit and vegetable intake and physical activity and body mass index. The reference uric acid level for these plots (with hazard ratio fixed as 1.0) was 4.0 mg/dL.
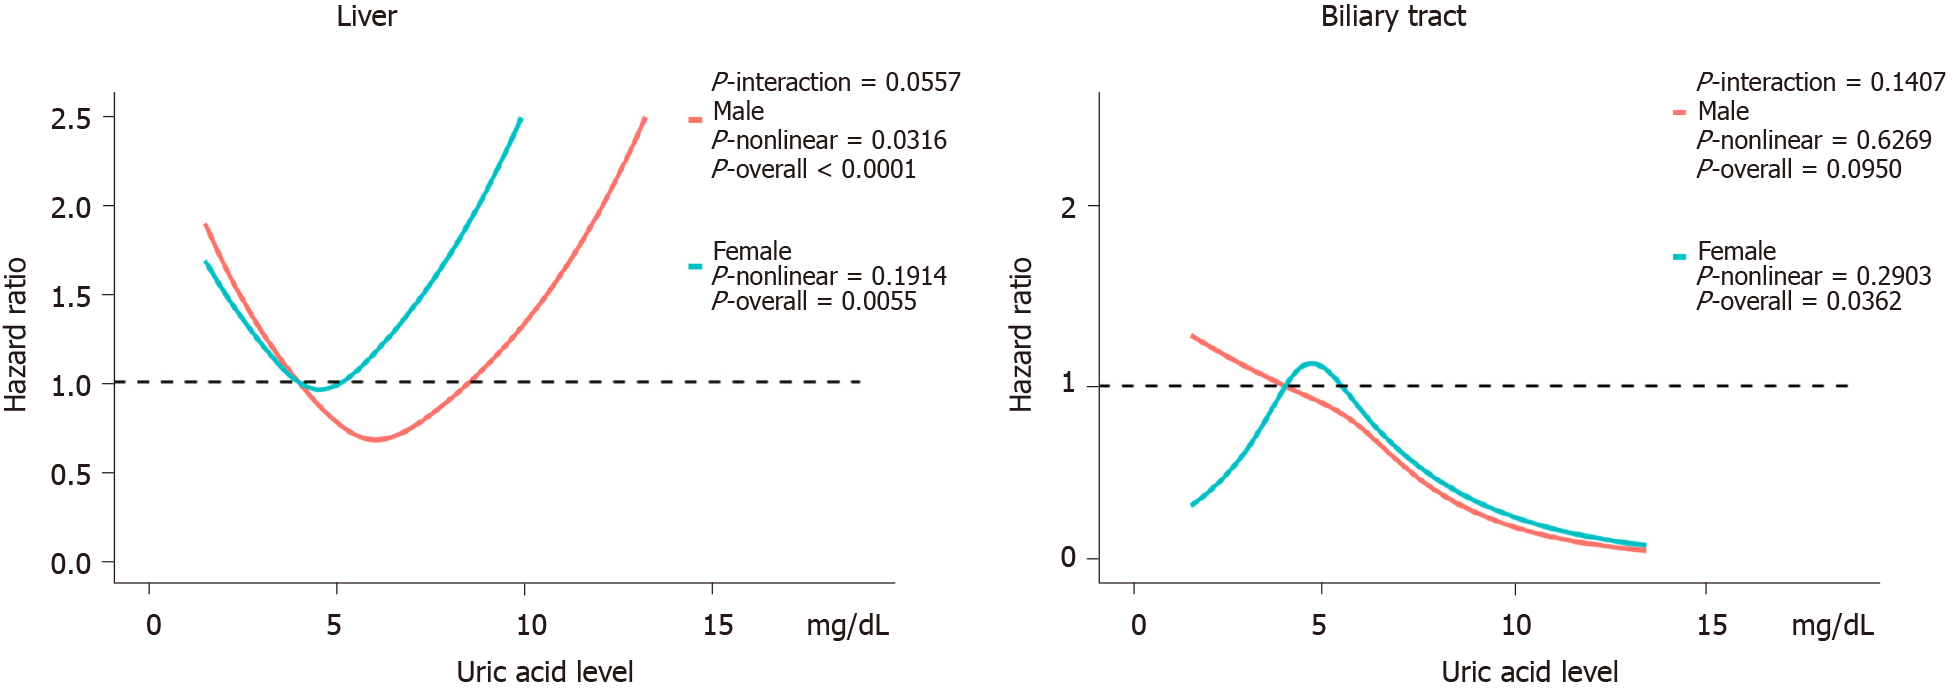
Figure 5 The effect of uric acid on hepatobiliary cancer stratified by gender.
Adjusted for age, education, ethnic, family history of cancer, alcohol intake, smoking status, annual household income, fruit and vegetable intake and physical activity and body mass index. The reference uric acid level for these plots (with hazard ratio fixed as 1.0) was 4.0 mg/dL.
- Citation: Huang CF, Huang JJ, Mi NN, Lin YY, He QS, Lu YW, Yue P, Bai B, Zhang JD, Zhang C, Cai T, Fu WK, Gao L, Li X, Yuan JQ, Meng WB. Associations between serum uric acid and hepatobiliary-pancreatic cancer: A cohort study. World J Gastroenterol 2020; 26(44): 7061-7075
- URL: https://www.wjgnet.com/1007-9327/full/v26/i44/7061.htm
- DOI: https://dx.doi.org/10.3748/wjg.v26.i44.7061


