Copyright
©The Author(s) 2020.
World J Gastroenterol. Nov 28, 2020; 26(44): 6979-6992
Published online Nov 28, 2020. doi: 10.3748/wjg.v26.i44.6979
Published online Nov 28, 2020. doi: 10.3748/wjg.v26.i44.6979
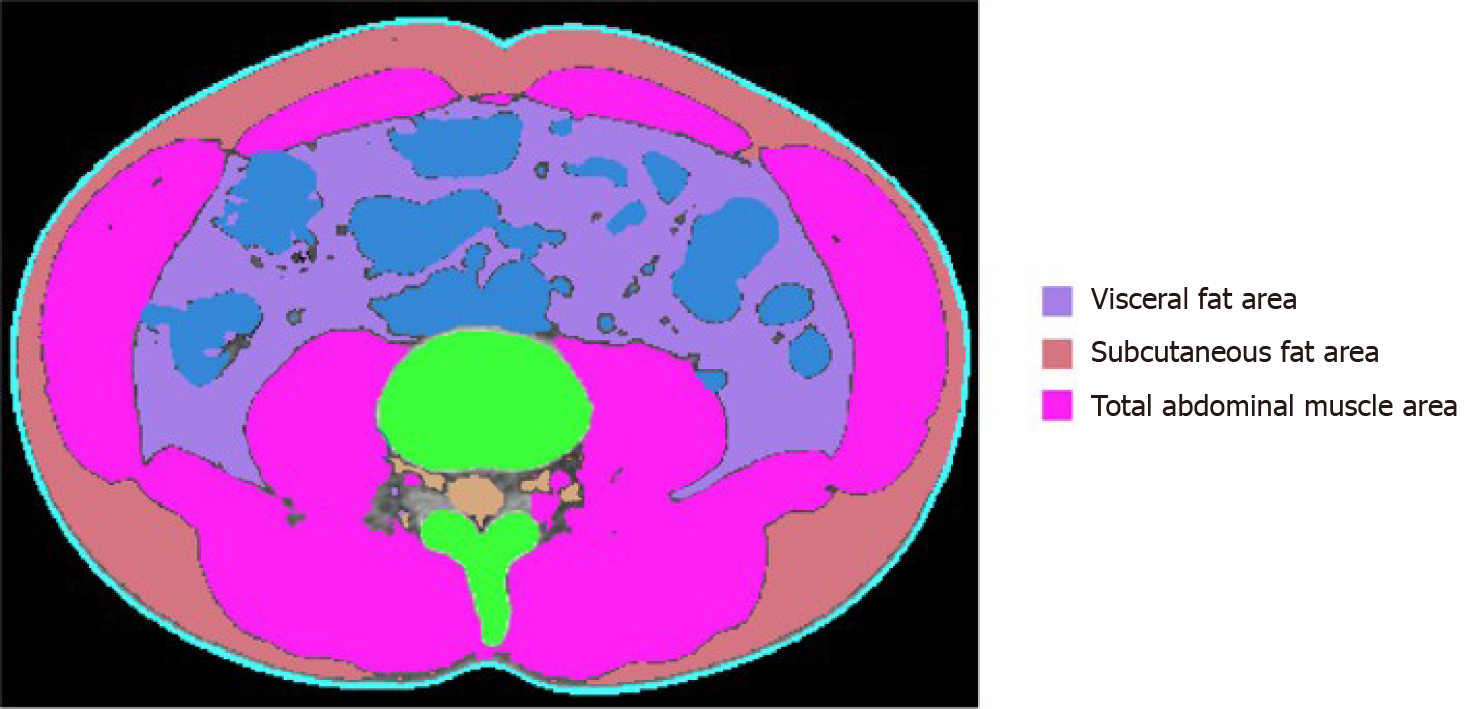
Figure 1 Body morphometric evaluations of abdominal fat and muscle areas.
At the level of the inferior endplate of the L3 vertebra, a segmented axial computed tomography image showed the visceral fat area, subcutaneous fat area, and total abdominal muscle area (cm2), including all muscles on selected axial images, i.e., psoas, paraspinals, transversus abdominis, rectus abdominis, quadratus lumborum, and internal and external obliques.
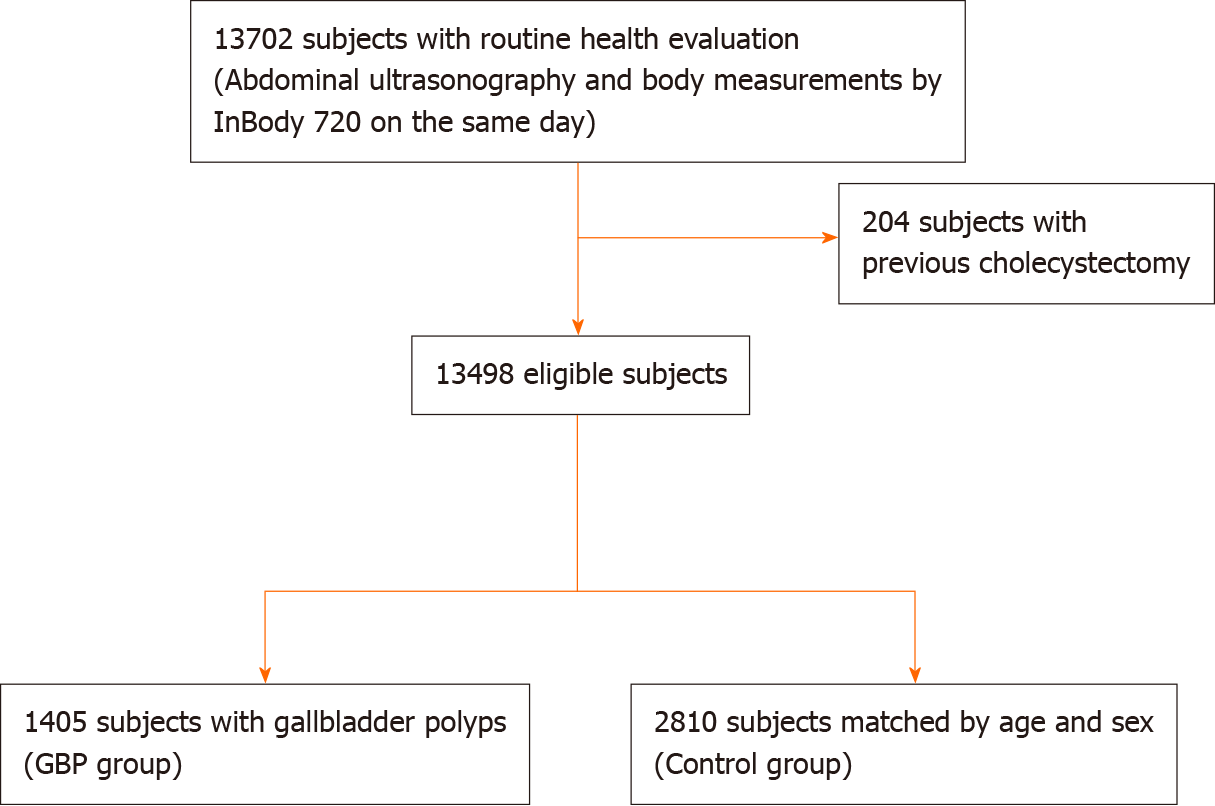
Figure 2 Diagram of showing enrollment of the study population.
GBP: Gallbladder polyp.
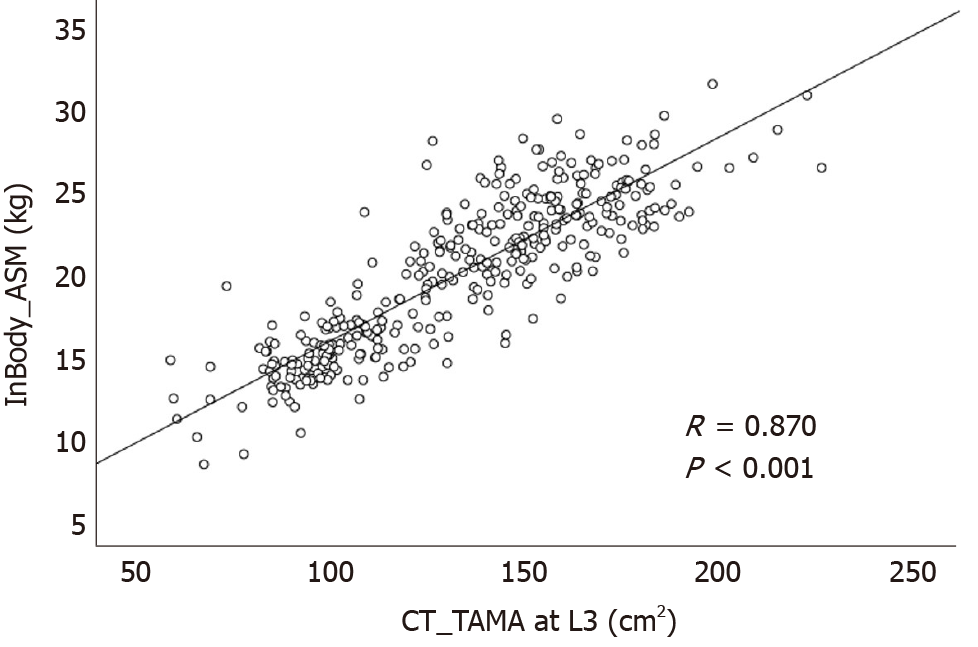
Figure 3 Correlation between the appendicular skeletal muscle mass measured by InBody 720 and the total abdominal muscle area measured by computed tomography scan.
ASM: Appendicular skeletal muscle mass; TAMA: Total abdominal muscle area; CT: Computed tomography.
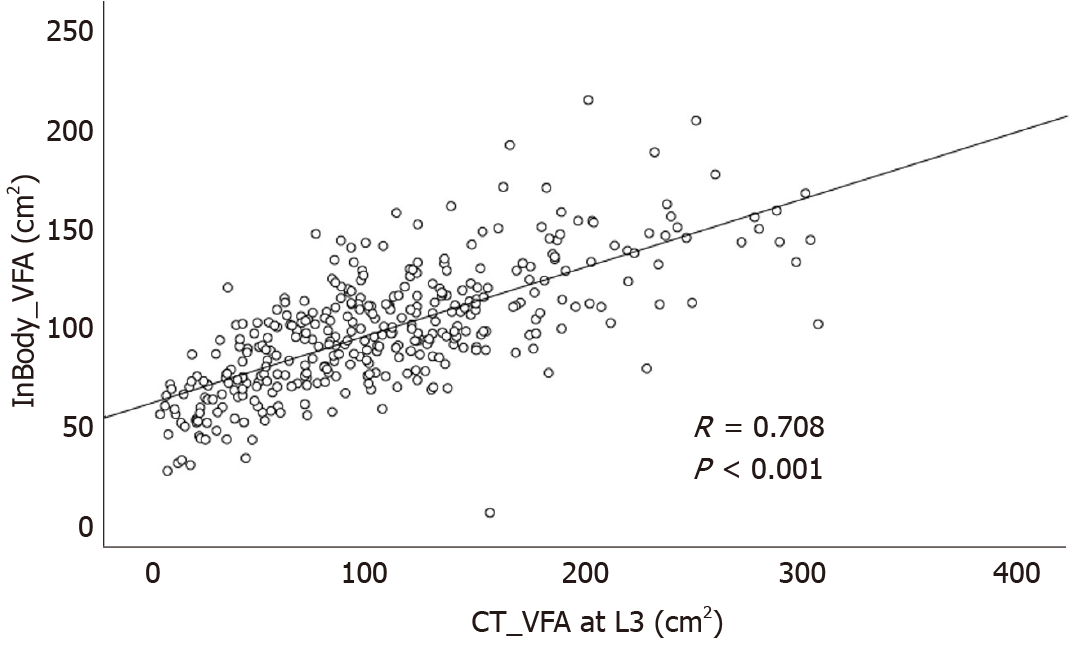
Figure 4 Correlation between the visceral fat area area measured by InBody 720 and computed tomography scan.
VFA: Visceral fat area; CT: Computed tomography.
- Citation: Ahn DW, Jeong JB, Kang J, Kim SH, Kim JW, Kim BG, Lee KL, Oh S, Yoon SH, Park SJ, Lee DH. Fatty liver is an independent risk factor for gallbladder polyps. World J Gastroenterol 2020; 26(44): 6979-6992
- URL: https://www.wjgnet.com/1007-9327/full/v26/i44/6979.htm
- DOI: https://dx.doi.org/10.3748/wjg.v26.i44.6979


