Copyright
©The Author(s) 2020.
World J Gastroenterol. Nov 7, 2020; 26(41): 6346-6360
Published online Nov 7, 2020. doi: 10.3748/wjg.v26.i41.6346
Published online Nov 7, 2020. doi: 10.3748/wjg.v26.i41.6346
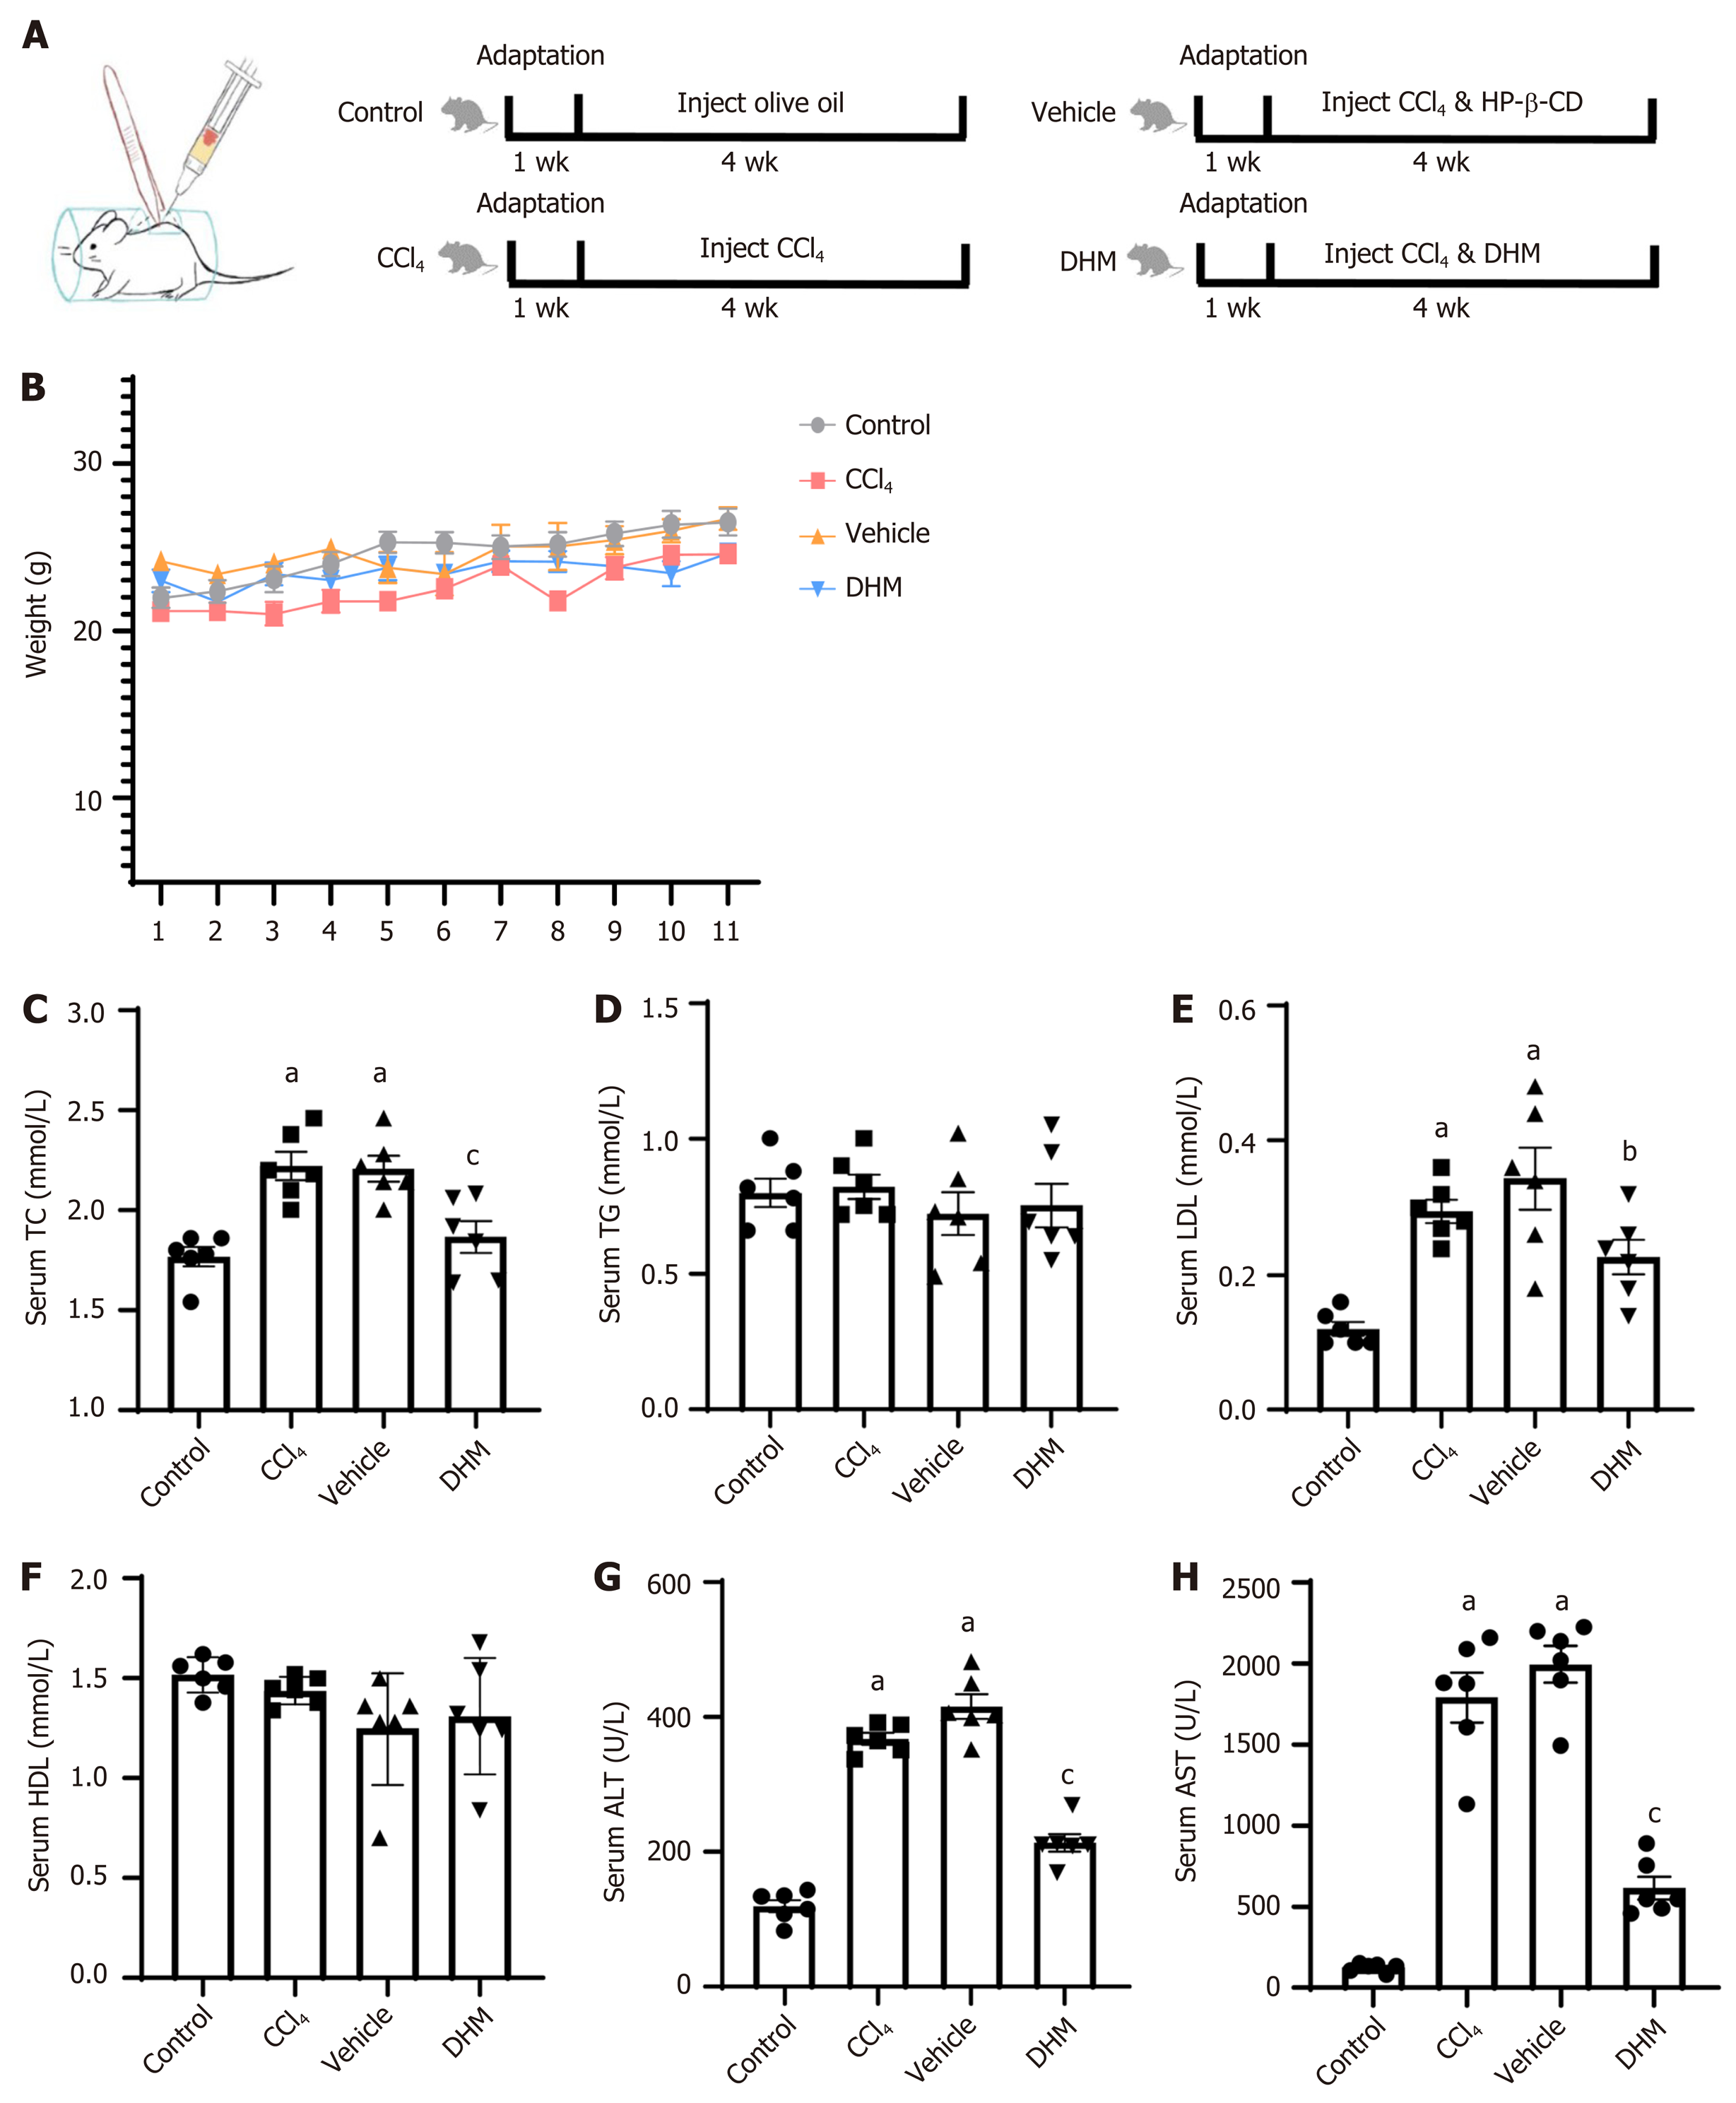
Figure 1 Modeling process, weight monitoring and serological testing.
A: Schematic diagram of subcutaneous injection into the back and modeling flow chart; B: Weight monitoring records; C-H: Statistical graphs of serum total cholesterol, triglyceride, low density lipoprotein, high density lipoprotein, alanine aminotransferase and aspartate aminotransferase, respectively. aP < 0.01 vs control group; bP < 0.05 vs vehicle group; cP < 0.01 vs vehicle group; n = 6. DHM: Dihydromyricetin; HP-β-CD: Hydroxypropyl-β-cyclodextrin; TC: Total cholesterol; TG: Triglyceride; LDL: Low density lipoprotein; HDL: High density lipoprotein; ALT: Alanine aminotransferase; AST: Aspartate aminotransferase.
Figure 2 Lipid deposition occurring in the liver.
A-D: Hematoxylin and eosin staining of a paraffin section of liver tissue; E-H: Oil red O staining of frozen section of liver tissue; I: Nonalcoholic steatohepatitis activity score; J: Oil red O-positive area rate. There was no lipid deposition in the control group; while in the CCl4 and vehicle groups, a large amount of lipid deposition occurred; but lipid deposition was significantly decreased in the dihydromyricetin group. The scale bar refers to 100 μm. aP < 0.01 vs control group; bP < 0.05 vs vehicle group; cP < 0.01 vs vehicle group; n = 6. DHM: Dihydromyricetin; ORO: Oil red O.
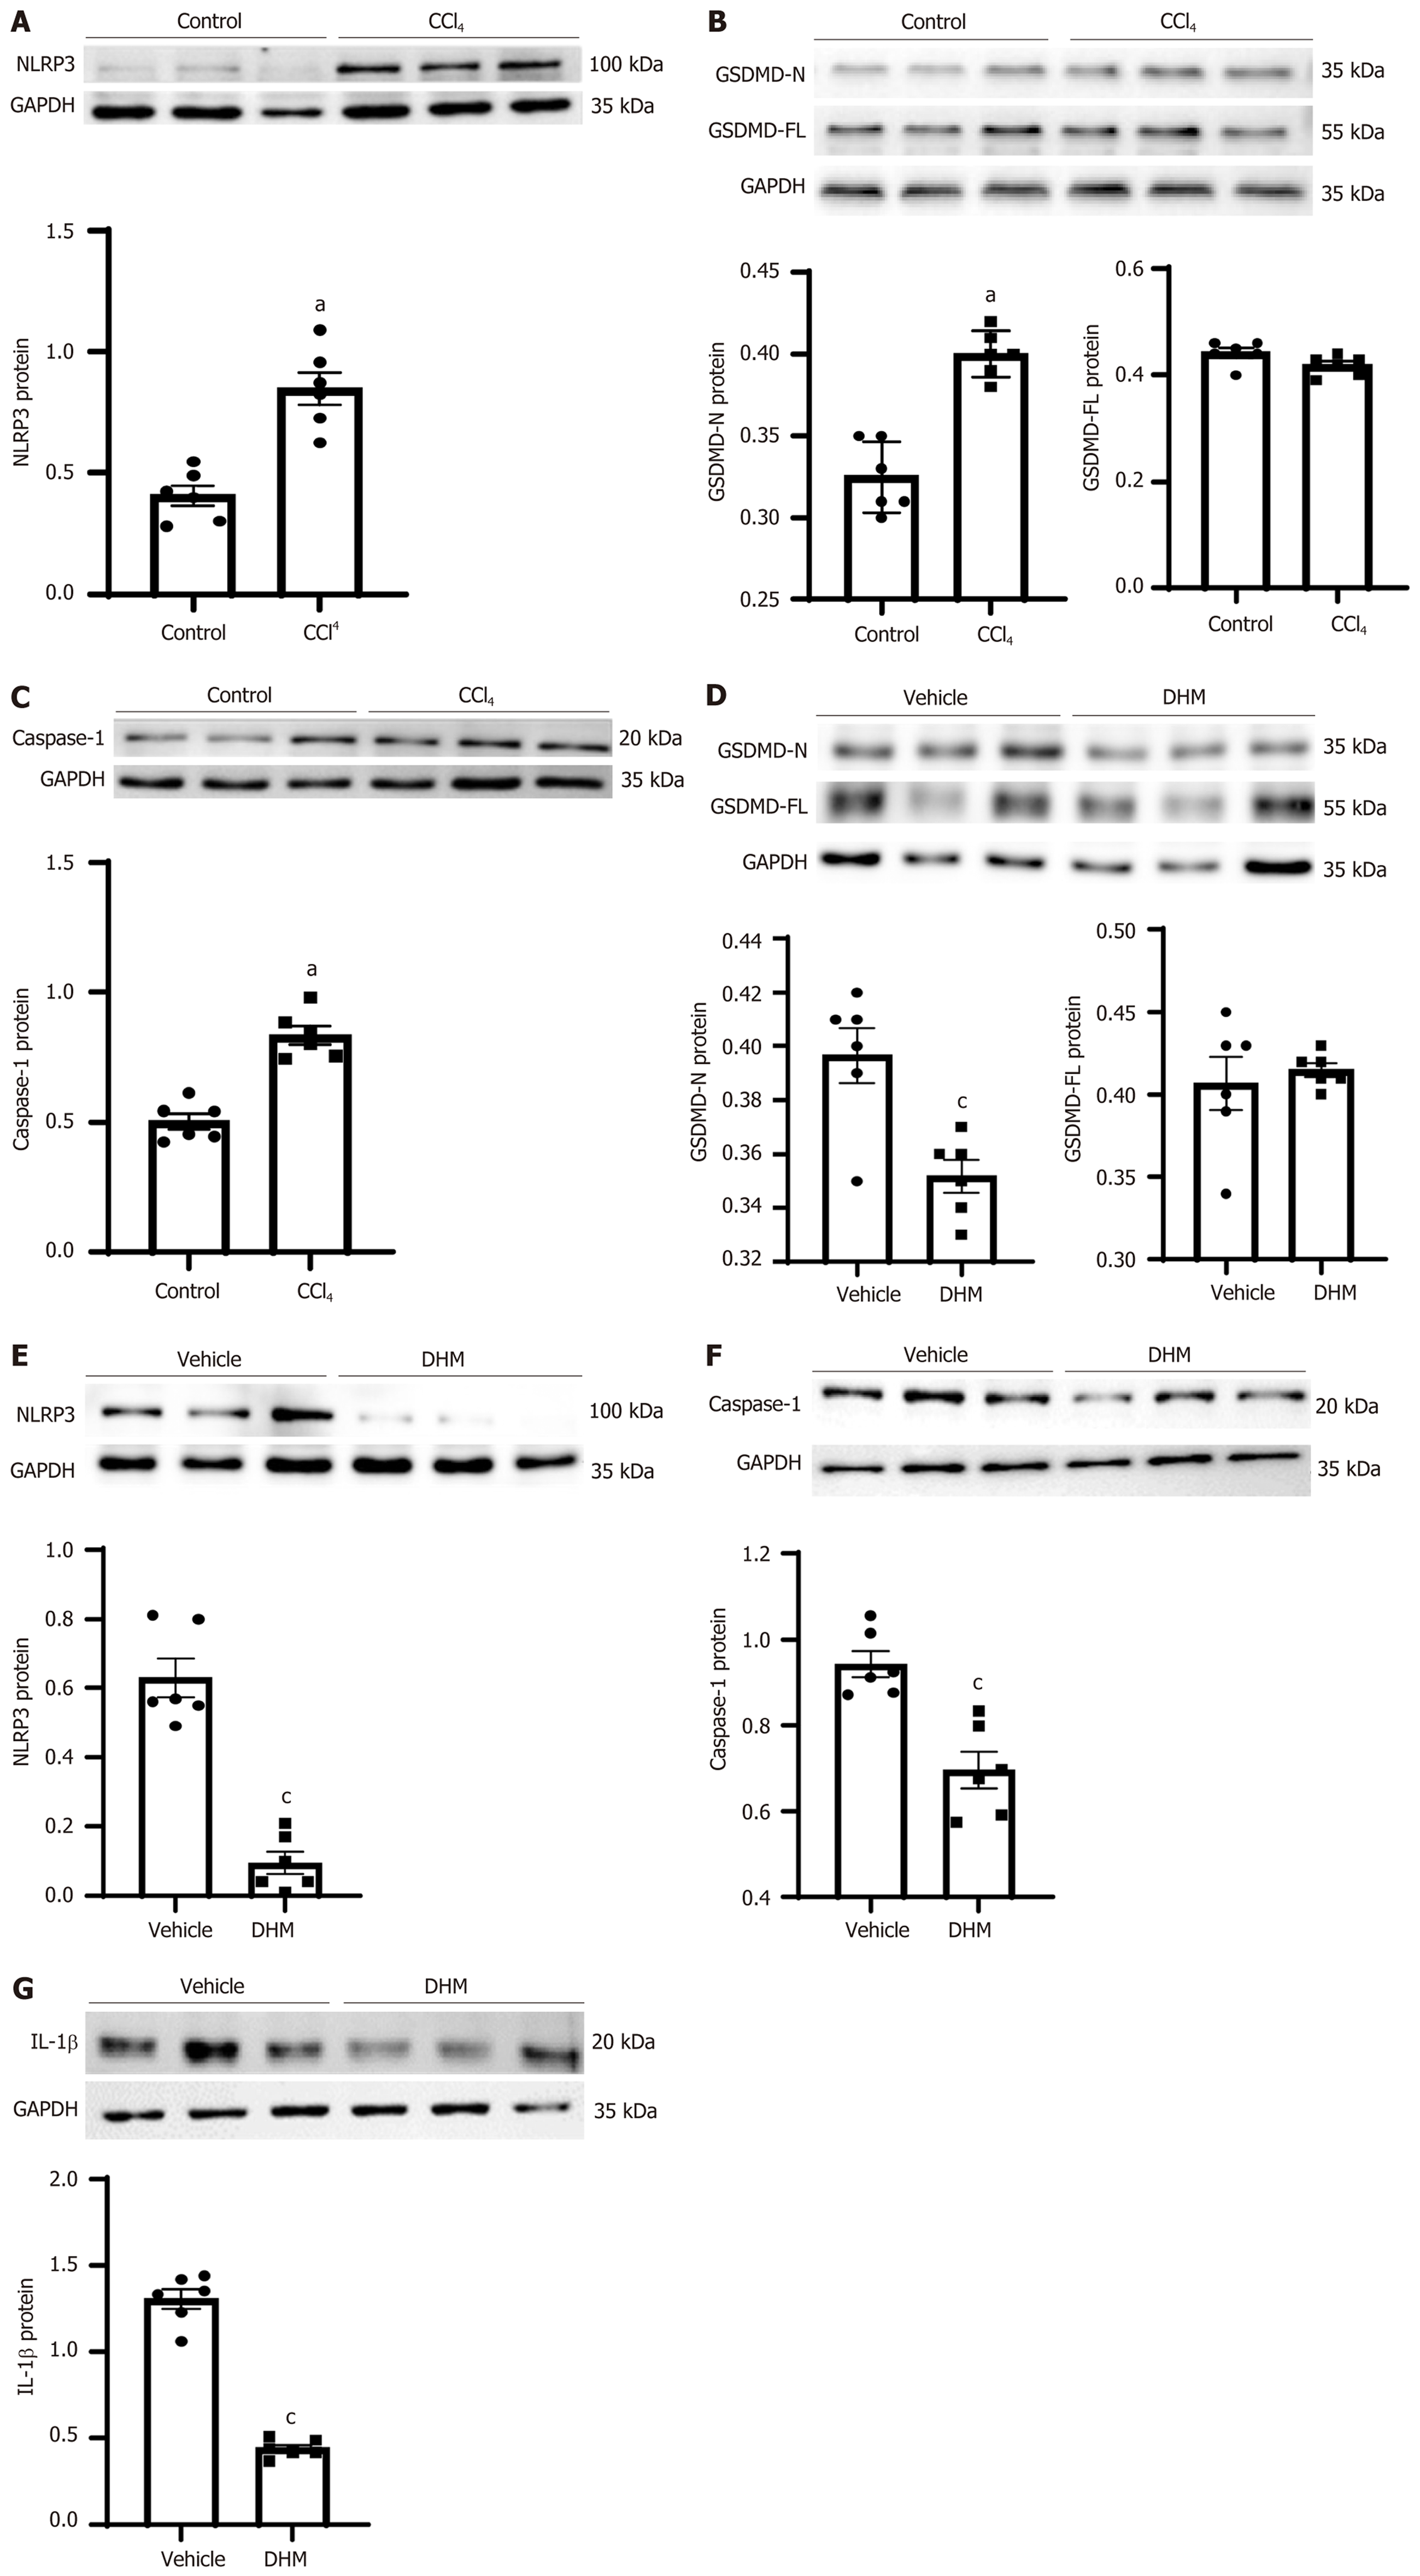
Figure 3 Changes in protein expression of pyrethroid-related molecules.
A-C: The expression levels of NOD-, LRR- and pyrin domain-containing 3 (NLRP3), gasdermin D (GSDMD) and caspase-1 in the control and CCl4 group, respectively; D-G: The expression levels of GSDMD, NLRP3, caspase-1 and IL-1 in the vehicle and dihydromyricetin group, respectively. aP < 0.01 vs control group; cP < 0.01 vs vehicle group; n = 6. NLRP3: NOD-, LRR- and pyrin domain-containing 3; GAPDH: Glyceraldehyde-3-phosphate dehydrogenase; GSDMD: Gasdermin D; DHM: Dihydromyricetin; IL-1β: Interleukin-1β.
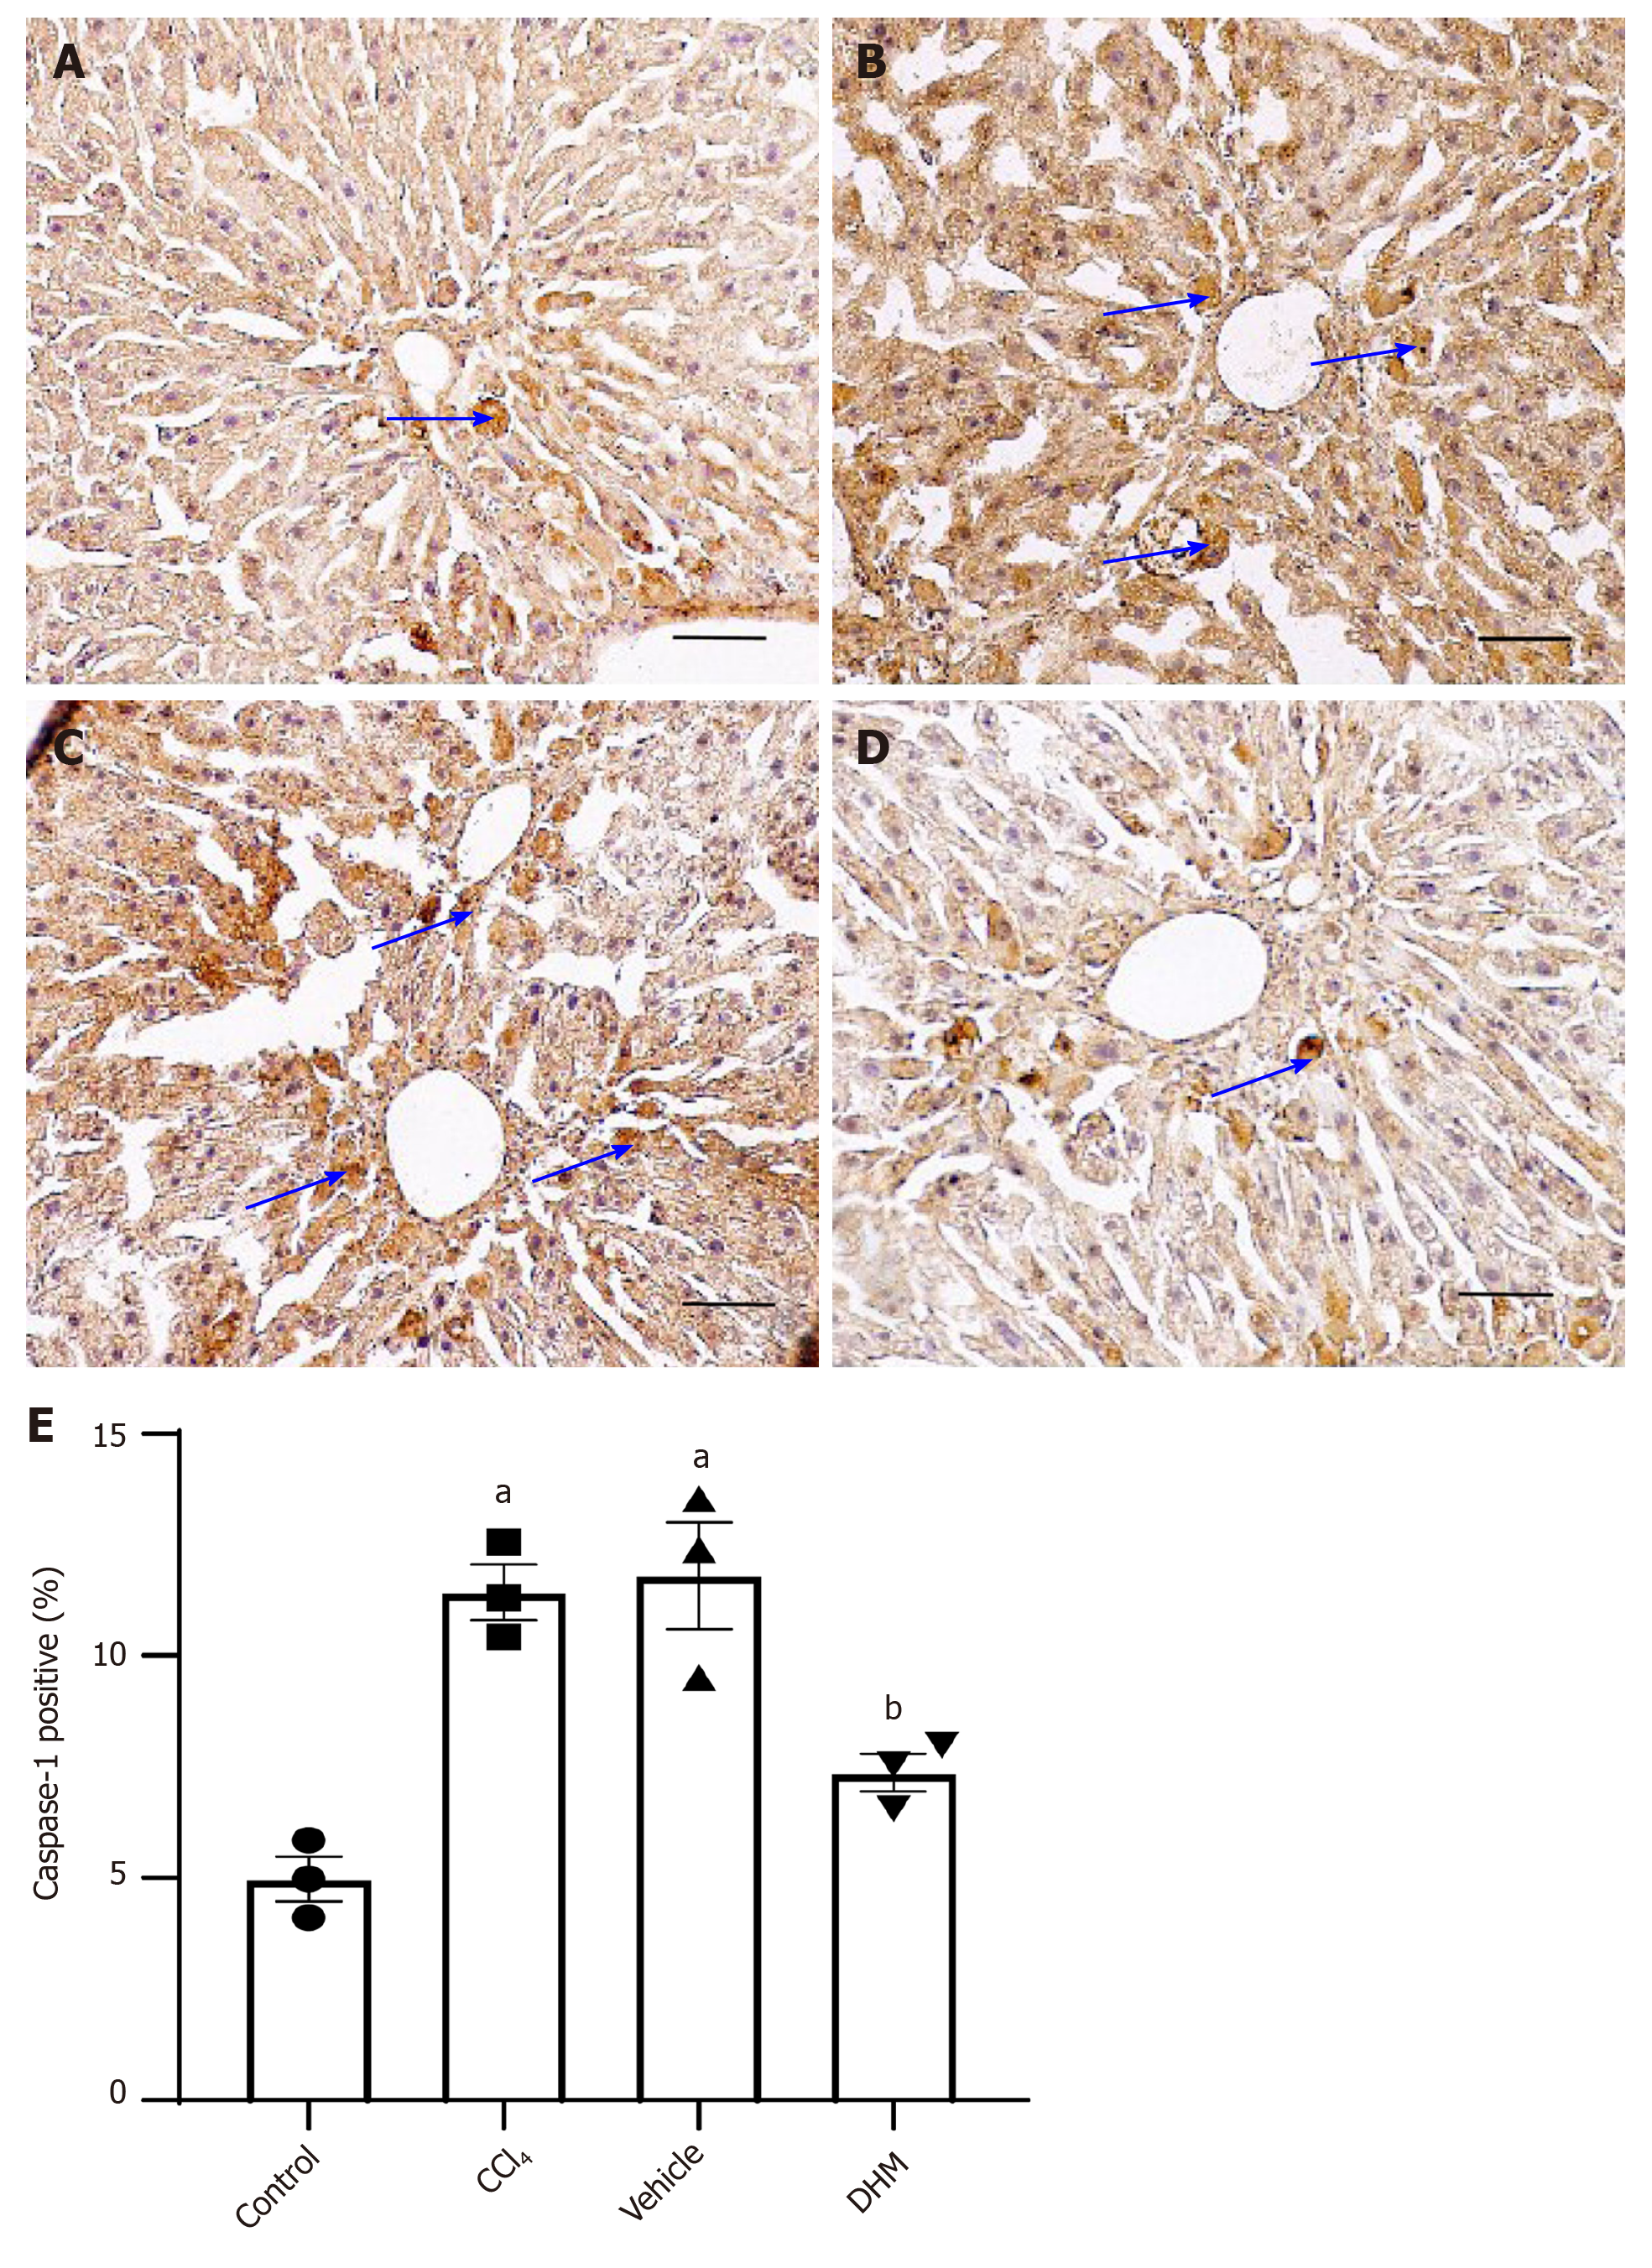
Figure 4 Changes in the expression of caspase-1, the core protein of pyroptosis, were observed by immunohistochemistry.
A-D: The immunohistochemical results of caspase-1 in the control, CCl4, vehicle and dihydromyricetin groups, respectively; E: Statistical graph of the immunohistochemical results of caspase-1 in the above four groups. There was very little caspase-1 in the control group; while in the CCl4 and vehicle groups, a large amount of caspase-1 was observed; but caspase-1 was significantly decreased in the dihydromyricetin group. The scale bar refers to 100 μm. aP < 0.01 vs control group; bP < 0.05 vs vehicle group; n = 3. DHM: Dihydromyricetin.
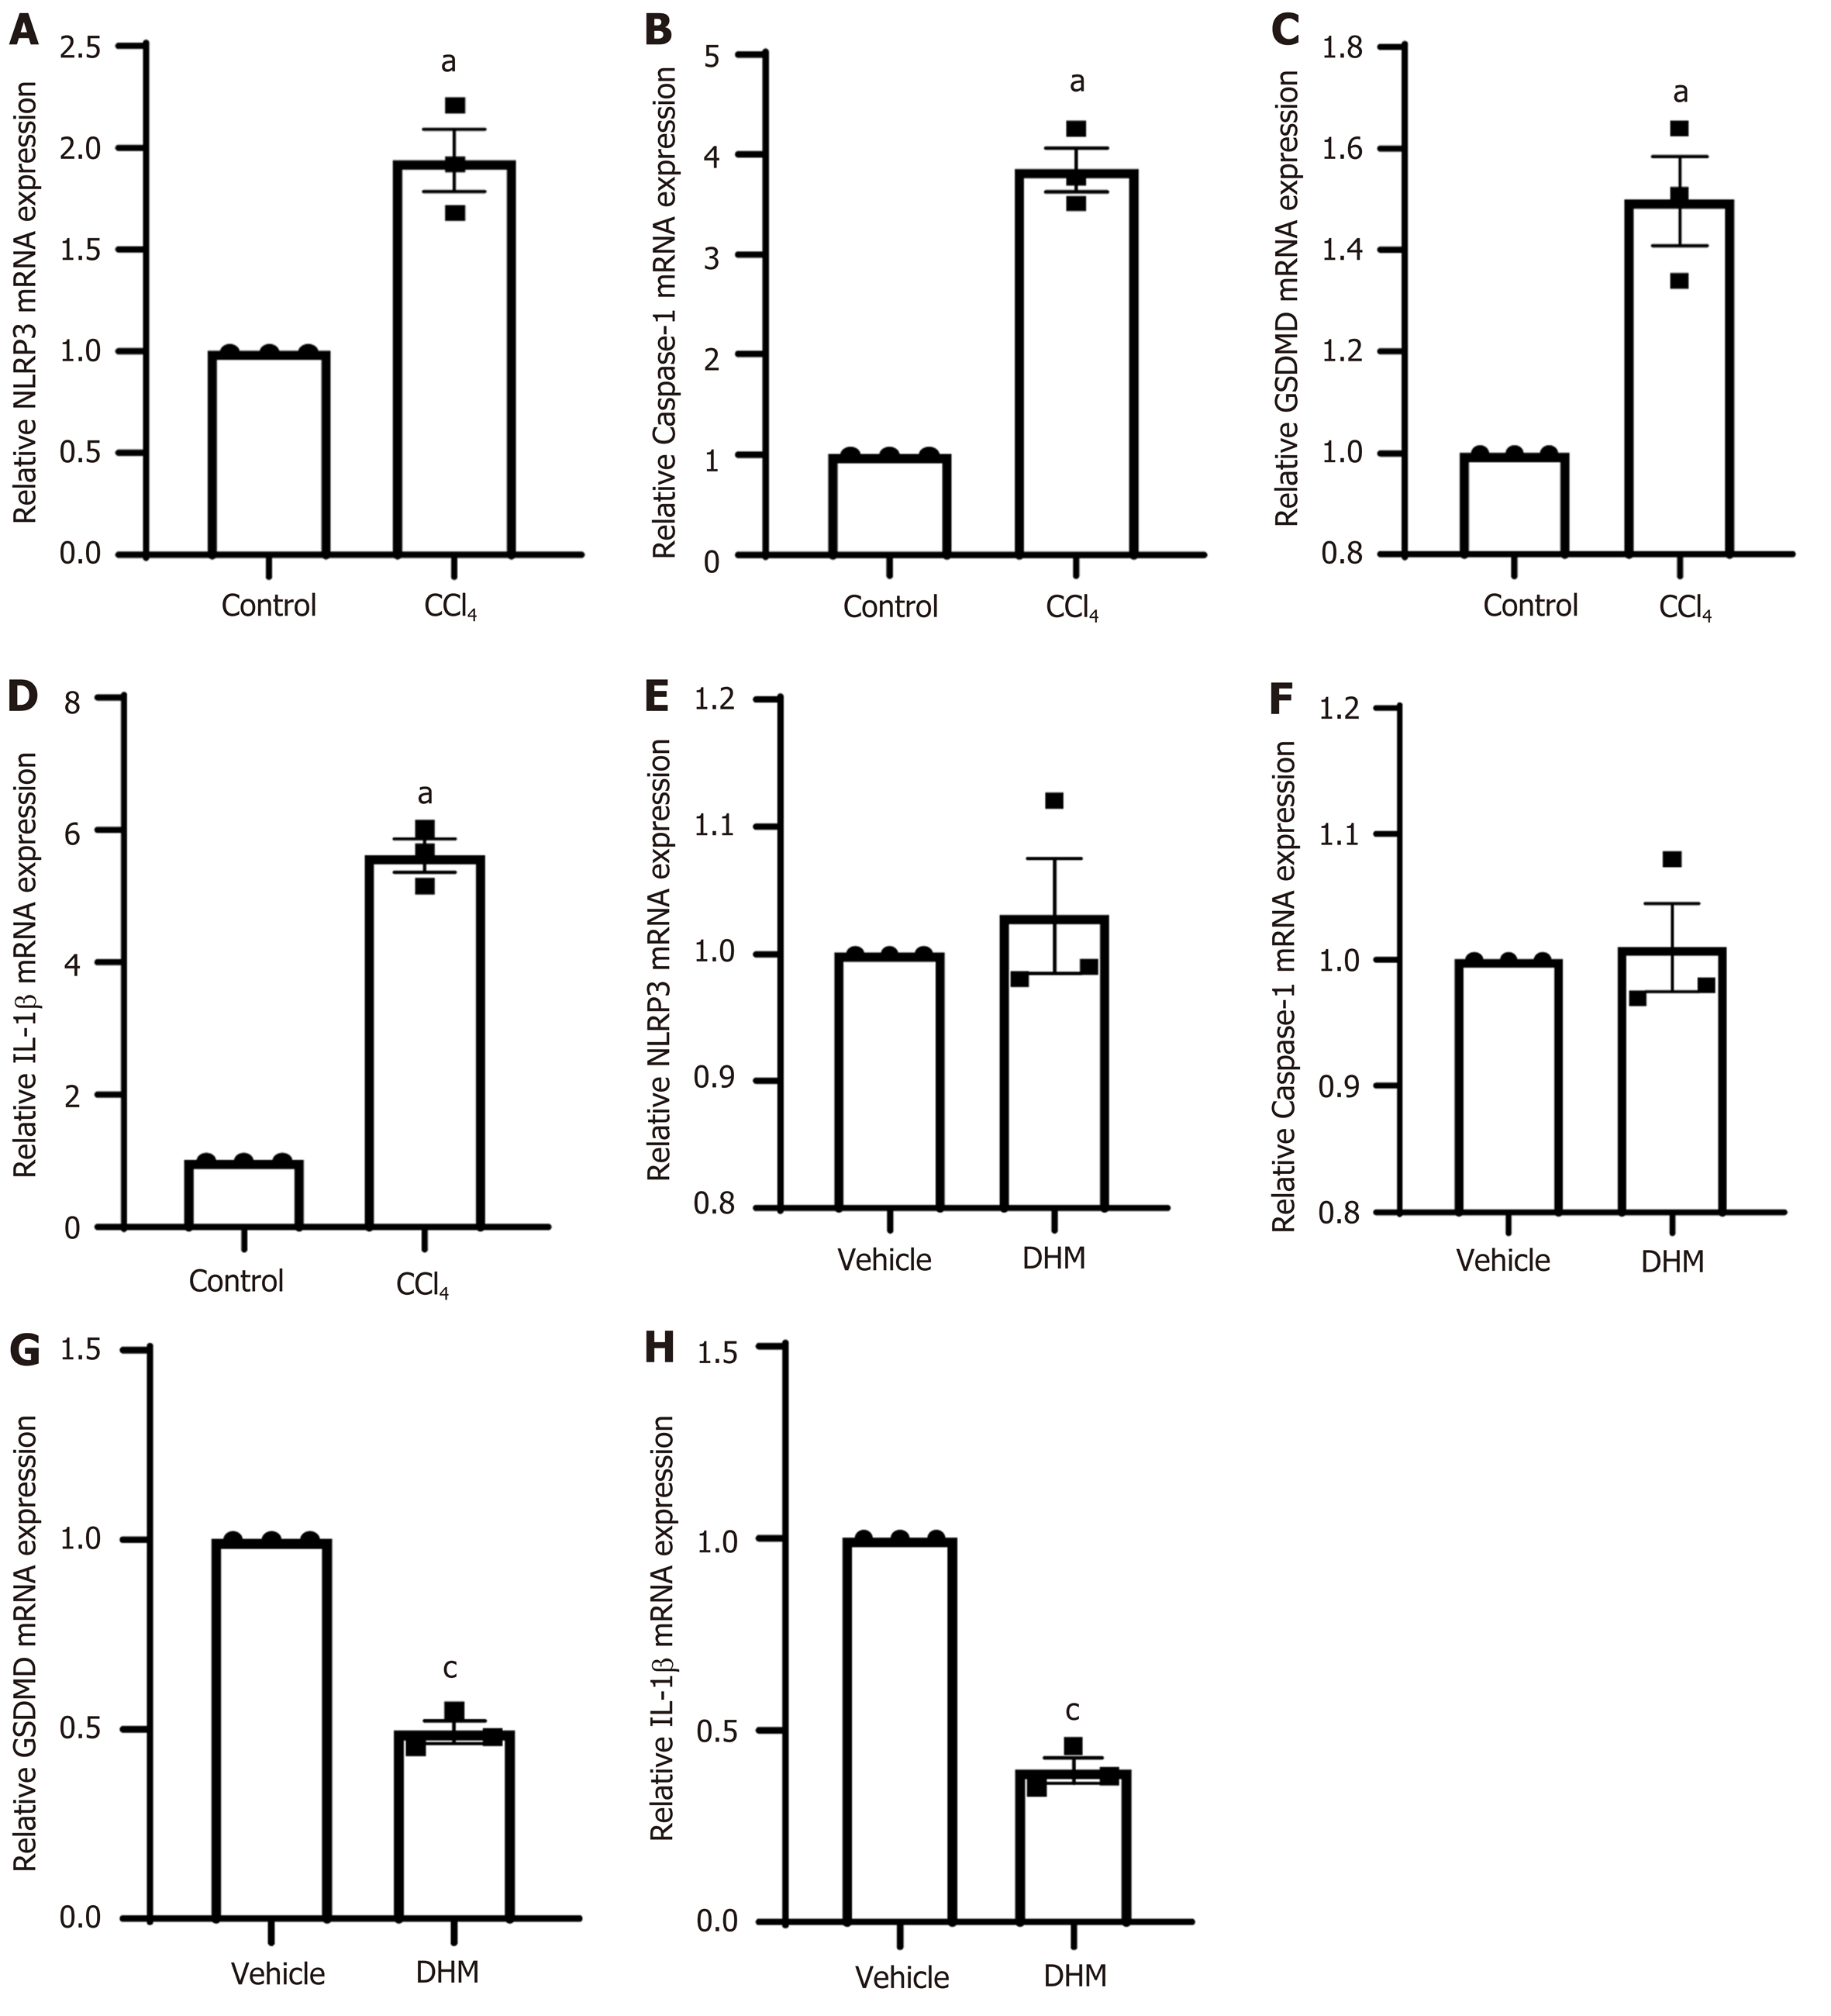
Figure 5 The relative expression levels of pyroptosis-related genes.
A-D: The relative expression levels of NOD-, LRR- and pyrin domain-containing 3 (NLRP3), caspase-1, gasdermin D (GSDMD) and interleukin-1β (IL-1β) in the control and CCl4 group, respectively; E-H: The relative expression levels of NLRP3, caspase-1, GSDMD and IL-1β in the vehicle and dihydromyricetin group, respectively. aP < 0.01 vs control group; cP<0.01 vs vehicle group; n = 3. NLRP3: NOD-, LRR- and pyrin domain-containing 3; GSDMD: Gasdermin D; IL-1β: Interleukin-1β; DHM: Dihydromyricetin.
Figure 6 Working model of the pyroptosis-related pathway.
CCl4 treatment stimulates the formation of NOD-, LRR- and pyrin domain-containing 3 inflammasome, which activates caspase-1. While caspase-1 activates interleukin-1β, it cleaves gasdermin D (GSDMD) into the carboxyl terminal (GSDMD-C) and amino terminal (GSDMD-N). GSDMD-N binds to the lipid membrane and polymerizes into an oligomer with a pore in the middle. This channel allows passage of materials < 10 nm in diameter. More pores are formed, which cause cell membrane damage and rupture, and eventually chronic liver injury. DHM: Dihydromyricetin; NLRP3: NOD-, LRR- and pyrin domain-containing 3; IL-1β: Interleukin-1β; GSDMD: Gasdermin D.
- Citation: Cheng QC, Fan J, Deng XW, Liu HC, Ding HR, Fang X, Wang JW, Chen CH, Zhang WG. Dihydromyricetin ameliorates chronic liver injury by reducing pyroptosis. World J Gastroenterol 2020; 26(41): 6346-6360
- URL: https://www.wjgnet.com/1007-9327/full/v26/i41/6346.htm
- DOI: https://dx.doi.org/10.3748/wjg.v26.i41.6346


