Copyright
©The Author(s) 2020.
World J Gastroenterol. Nov 7, 2020; 26(41): 6346-6360
Published online Nov 7, 2020. doi: 10.3748/wjg.v26.i41.6346
Published online Nov 7, 2020. doi: 10.3748/wjg.v26.i41.6346
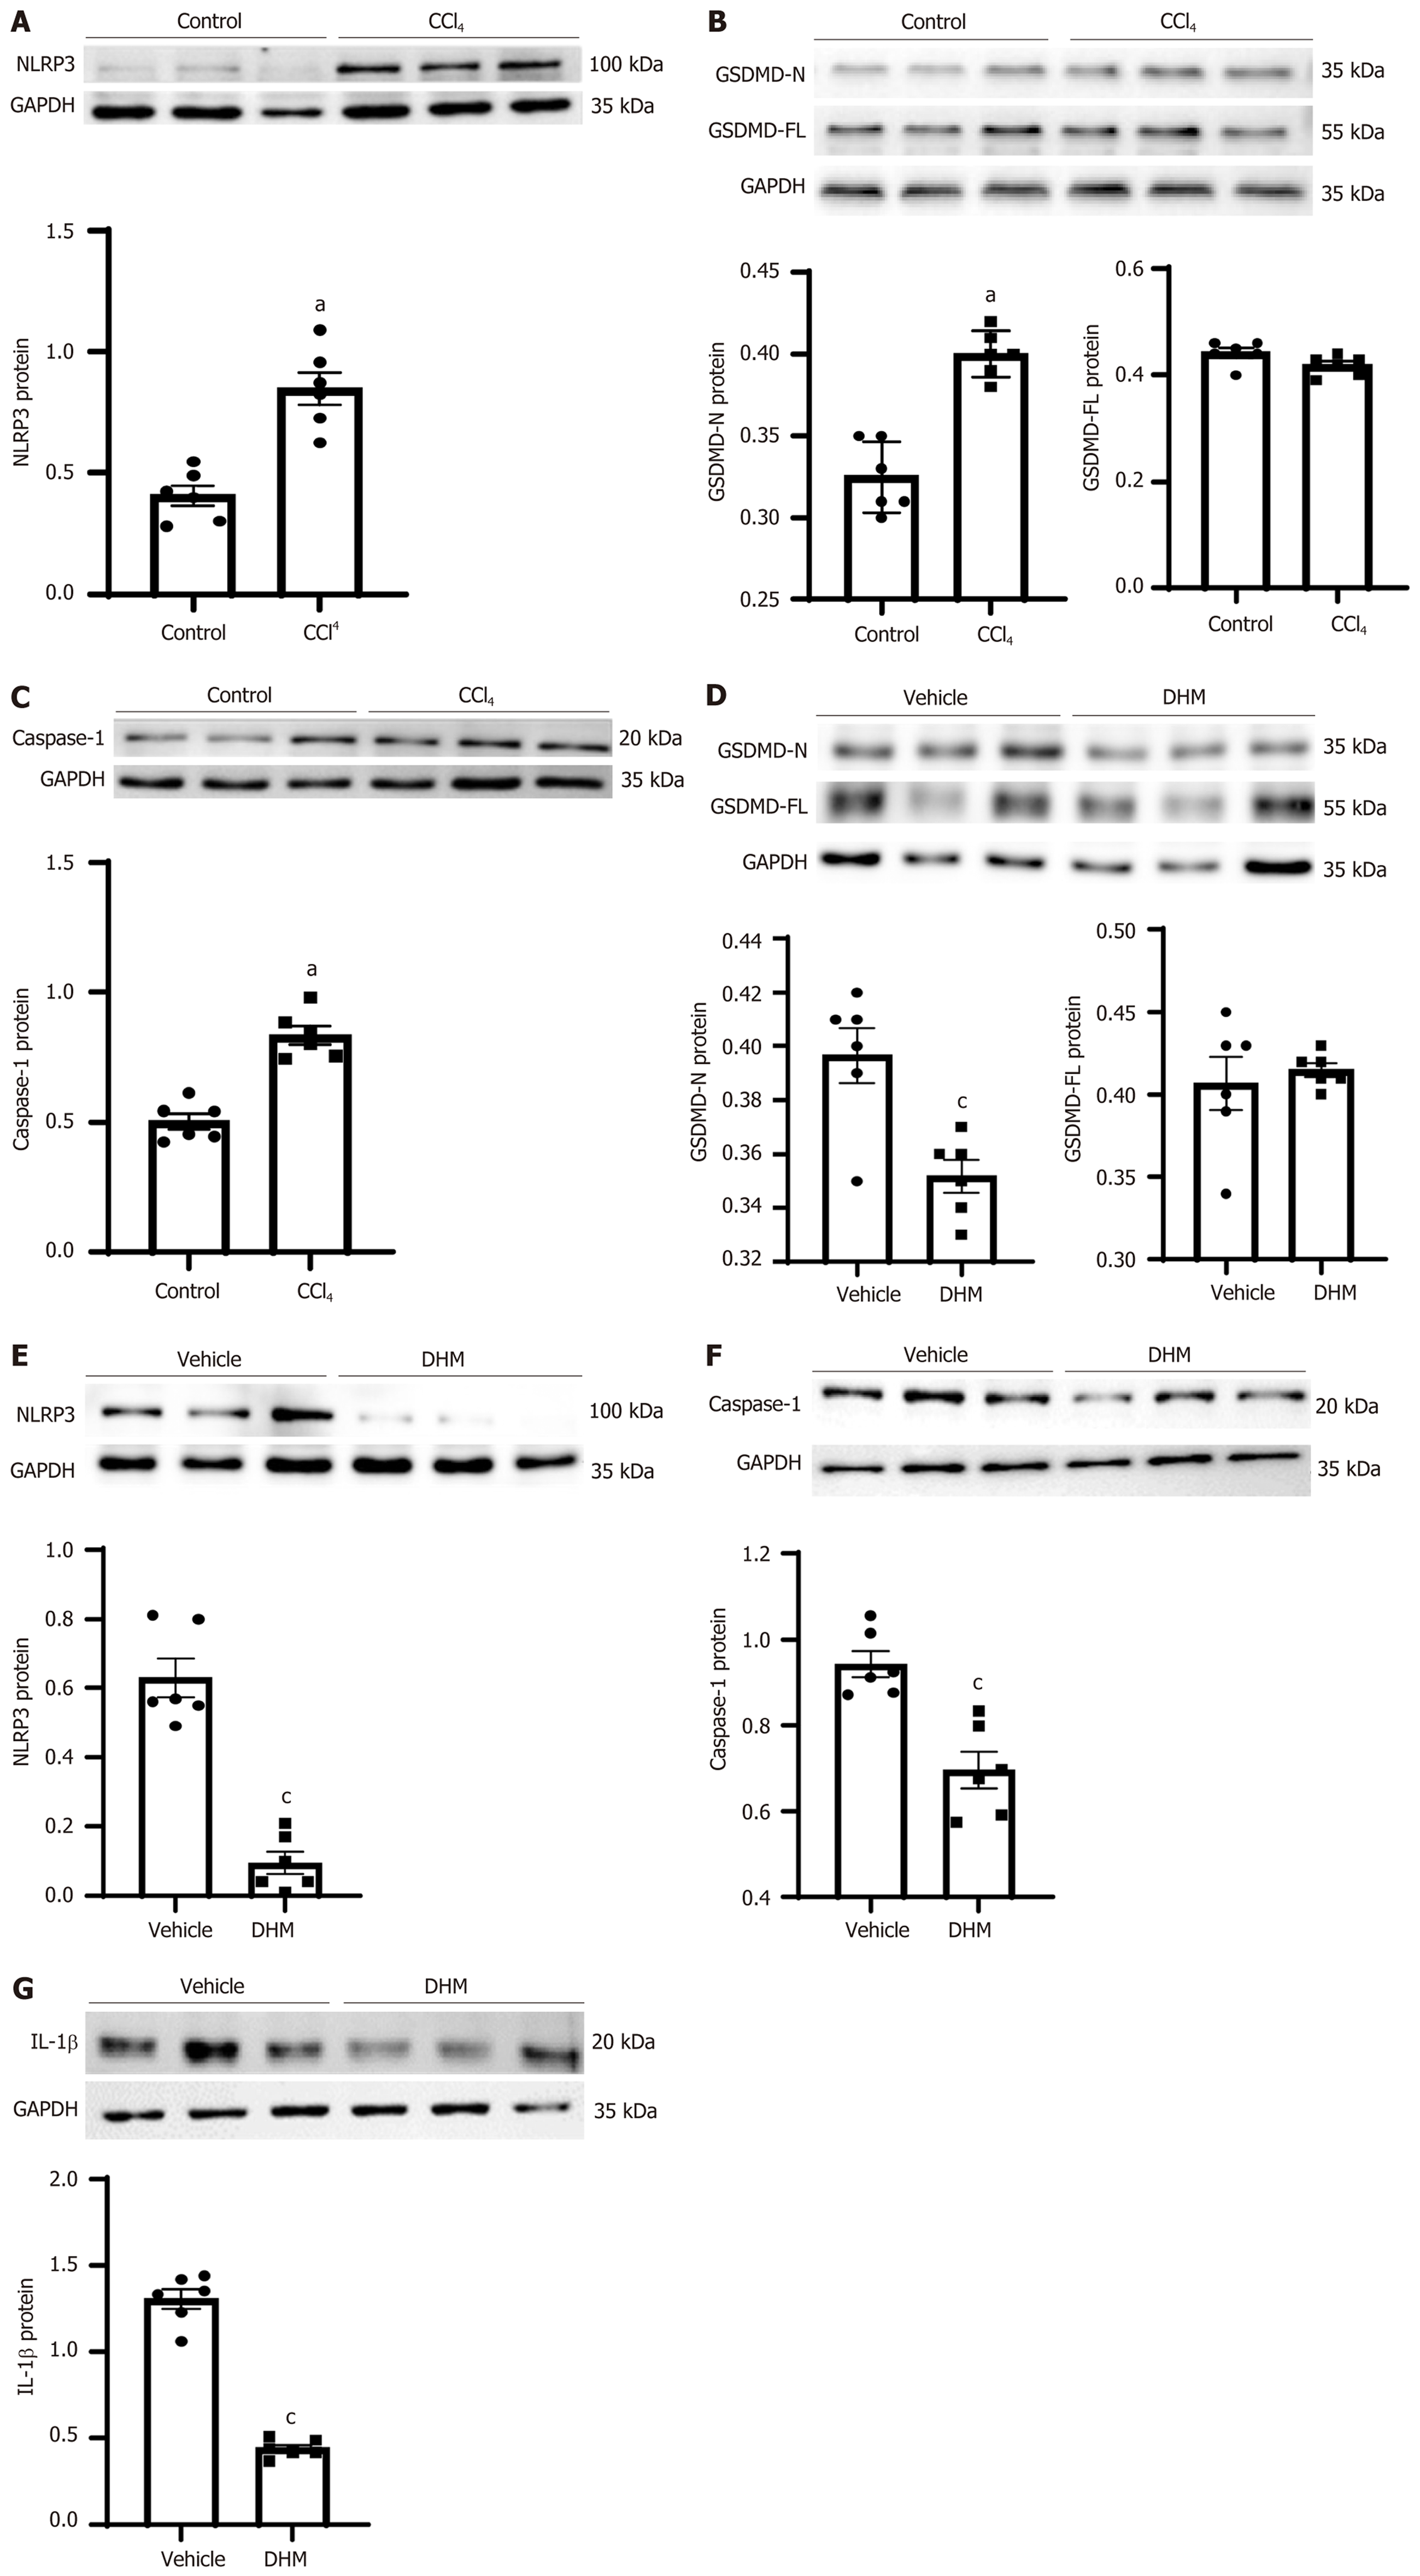
Figure 3 Changes in protein expression of pyrethroid-related molecules.
A-C: The expression levels of NOD-, LRR- and pyrin domain-containing 3 (NLRP3), gasdermin D (GSDMD) and caspase-1 in the control and CCl4 group, respectively; D-G: The expression levels of GSDMD, NLRP3, caspase-1 and IL-1 in the vehicle and dihydromyricetin group, respectively. aP < 0.01 vs control group; cP < 0.01 vs vehicle group; n = 6. NLRP3: NOD-, LRR- and pyrin domain-containing 3; GAPDH: Glyceraldehyde-3-phosphate dehydrogenase; GSDMD: Gasdermin D; DHM: Dihydromyricetin; IL-1β: Interleukin-1β.
- Citation: Cheng QC, Fan J, Deng XW, Liu HC, Ding HR, Fang X, Wang JW, Chen CH, Zhang WG. Dihydromyricetin ameliorates chronic liver injury by reducing pyroptosis. World J Gastroenterol 2020; 26(41): 6346-6360
- URL: https://www.wjgnet.com/1007-9327/full/v26/i41/6346.htm
- DOI: https://dx.doi.org/10.3748/wjg.v26.i41.6346


