Copyright
©The Author(s) 2020.
World J Gastroenterol. Jan 28, 2020; 26(4): 448-455
Published online Jan 28, 2020. doi: 10.3748/wjg.v26.i4.448
Published online Jan 28, 2020. doi: 10.3748/wjg.v26.i4.448
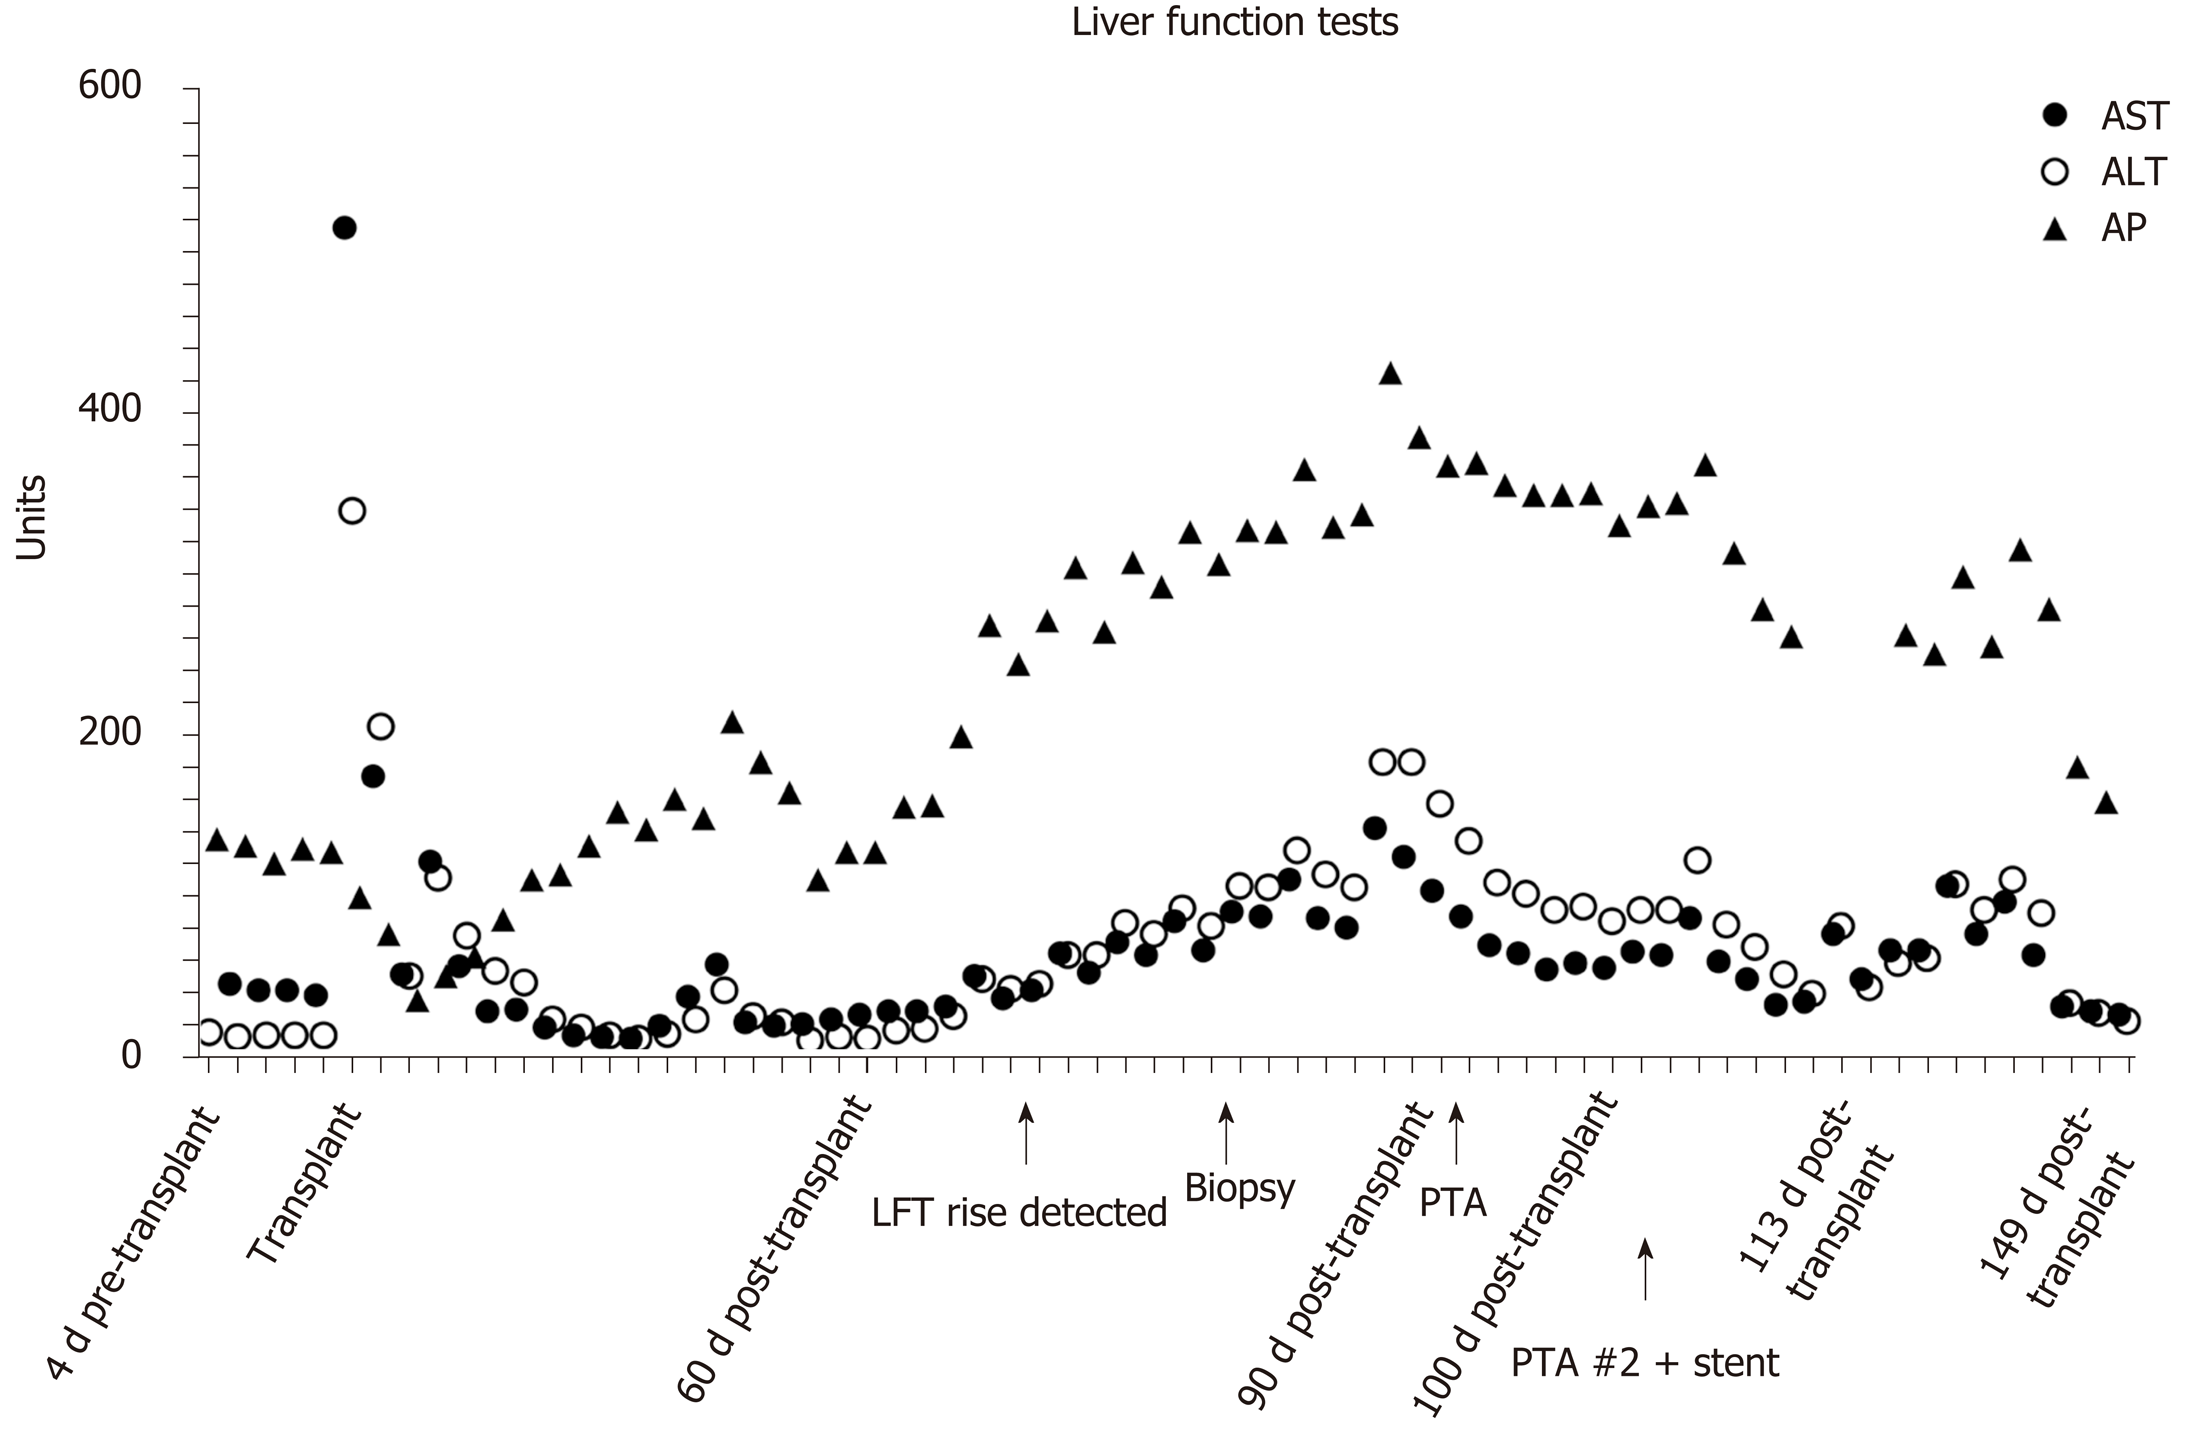
Figure 1 Liver function tests from the time of liver transplant.
PTA: Percutaneous transluminal angioplasty; LFT: Liver function test; AST: Aspartate aminotransferase; ALT: Alanine aminotransferase; AP: Antipsychotics.
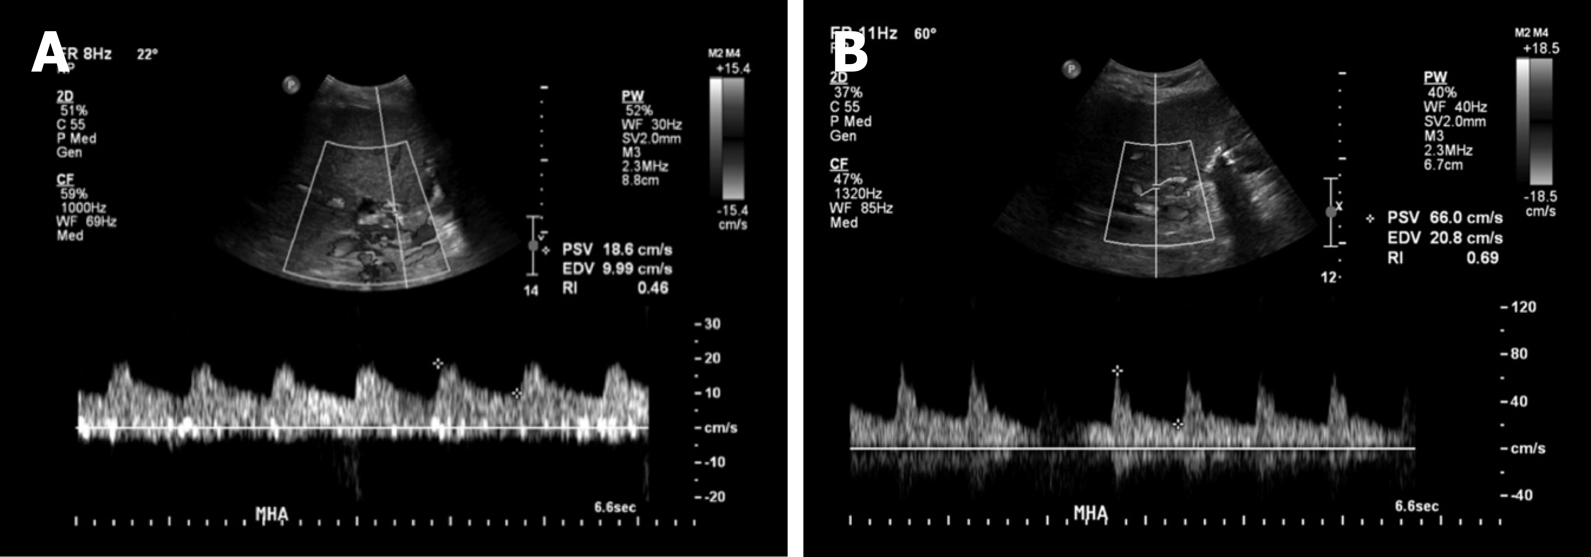
Figure 2 Images of doppler ultrasound in the main hepatic artery.
A: Doppler ultrasound in the main hepatic artery prior to intervention (day 80 post-transplant) demonstrating parvus et tardus waveform with low resistive index and low peak systolic velocity; B: After stenting (day 115 post-transplant, day 15 post stenting) showing normal waveform, normal peak systolic velocity, and normal resistive index.
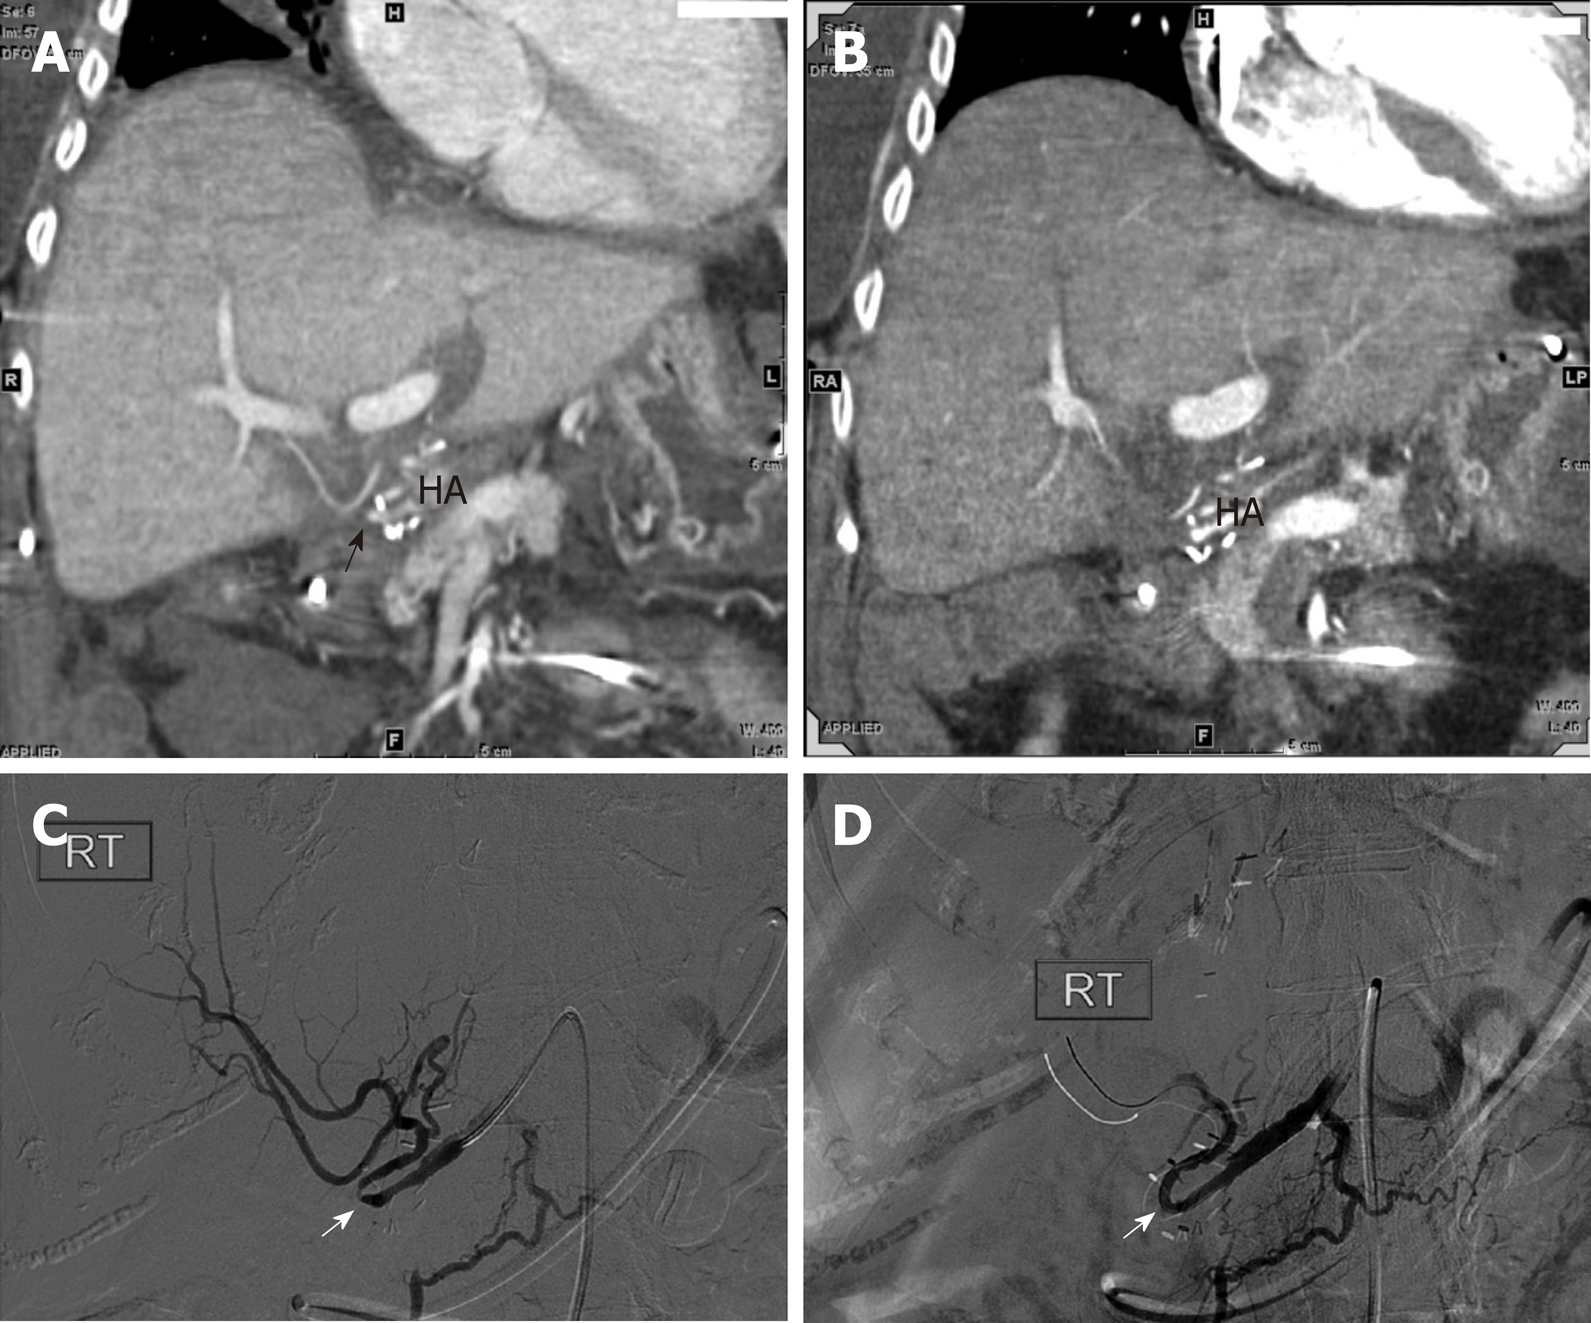
Figure 3 Images of computed tomography angiogram.
A: Computed tomography angiogram performed 60 d post-transplant showing small and irregular proper hepatic artery with stenosis (arrow); B: Ninety days post-transplant, showing small and irregular proper hepatic artery with stenosis (arrow); C and D: Hepatic artery angiography on post-transplant day 91 revealed a tight stenosis around a hairpin turn (white arrow) treated effectively with percutaneous transluminal angioplasty.
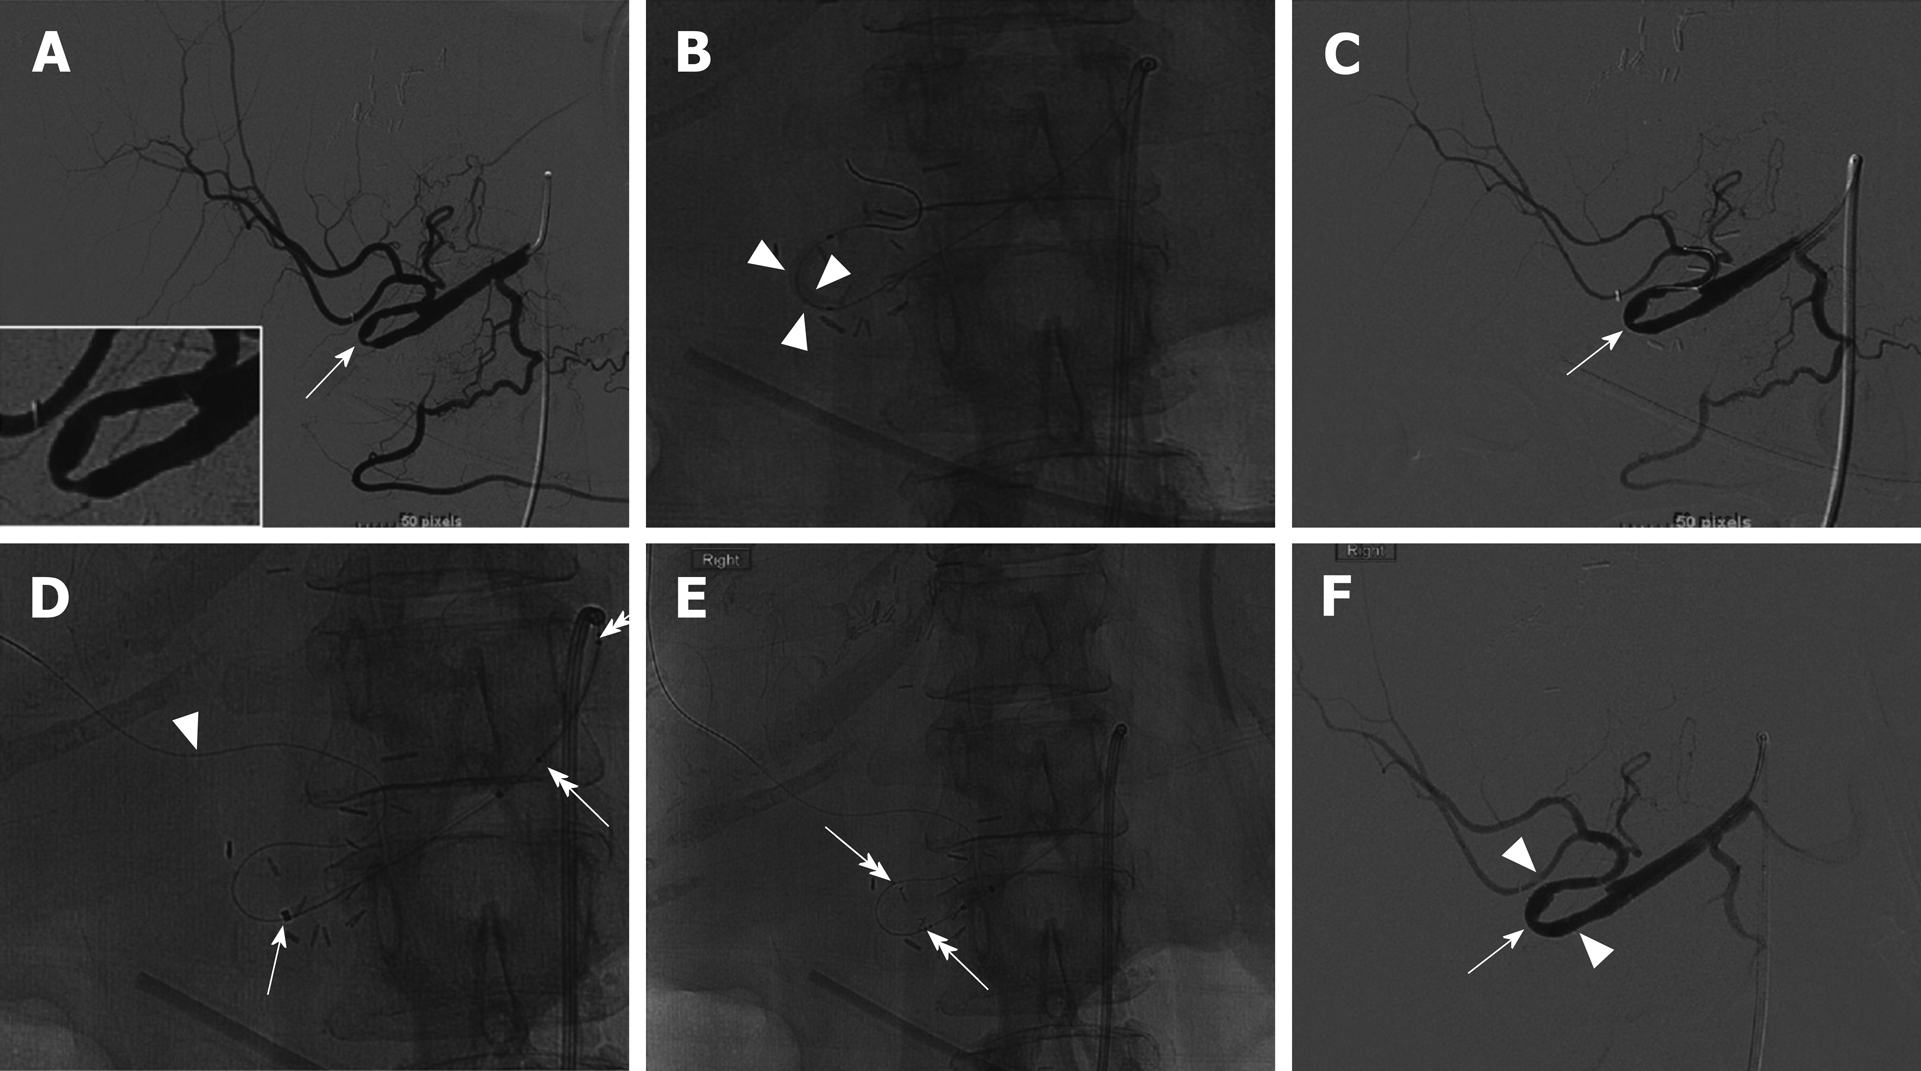
Figure 4 Angiography on day 100 post-transplant.
A: Angiography on day 100 post-transplant showed recurrent hepatic artery stenosis (arrow, insert); B and C: Balloon dilation (arrowheads) performed within the hairpin turn did not resolve the stenosis (C, arrow); D: Synchro support wire passed distally for stability (arrowhead) with advancement of Navien support catheter (arrow); E: Wingspan stent advanced around hairpin. Stent end markers are easily visualized (double head arrows); F: Post-stent angiography demonstrates resolution of the stenosis (arrow) and brisk flow into the hepatic arteries.
- Citation: Barahman M, Alanis L, DiNorcia J, Moriarty JM, McWilliams JP. Hepatic artery stenosis angioplasty and implantation of Wingspan neurovascular stent: A case report and discussion of stenting in tortuous vessels. World J Gastroenterol 2020; 26(4): 448-455
- URL: https://www.wjgnet.com/1007-9327/full/v26/i4/448.htm
- DOI: https://dx.doi.org/10.3748/wjg.v26.i4.448


