Copyright
©The Author(s) 2020.
World J Gastroenterol. Jul 21, 2020; 26(27): 3899-3916
Published online Jul 21, 2020. doi: 10.3748/wjg.v26.i27.3899
Published online Jul 21, 2020. doi: 10.3748/wjg.v26.i27.3899
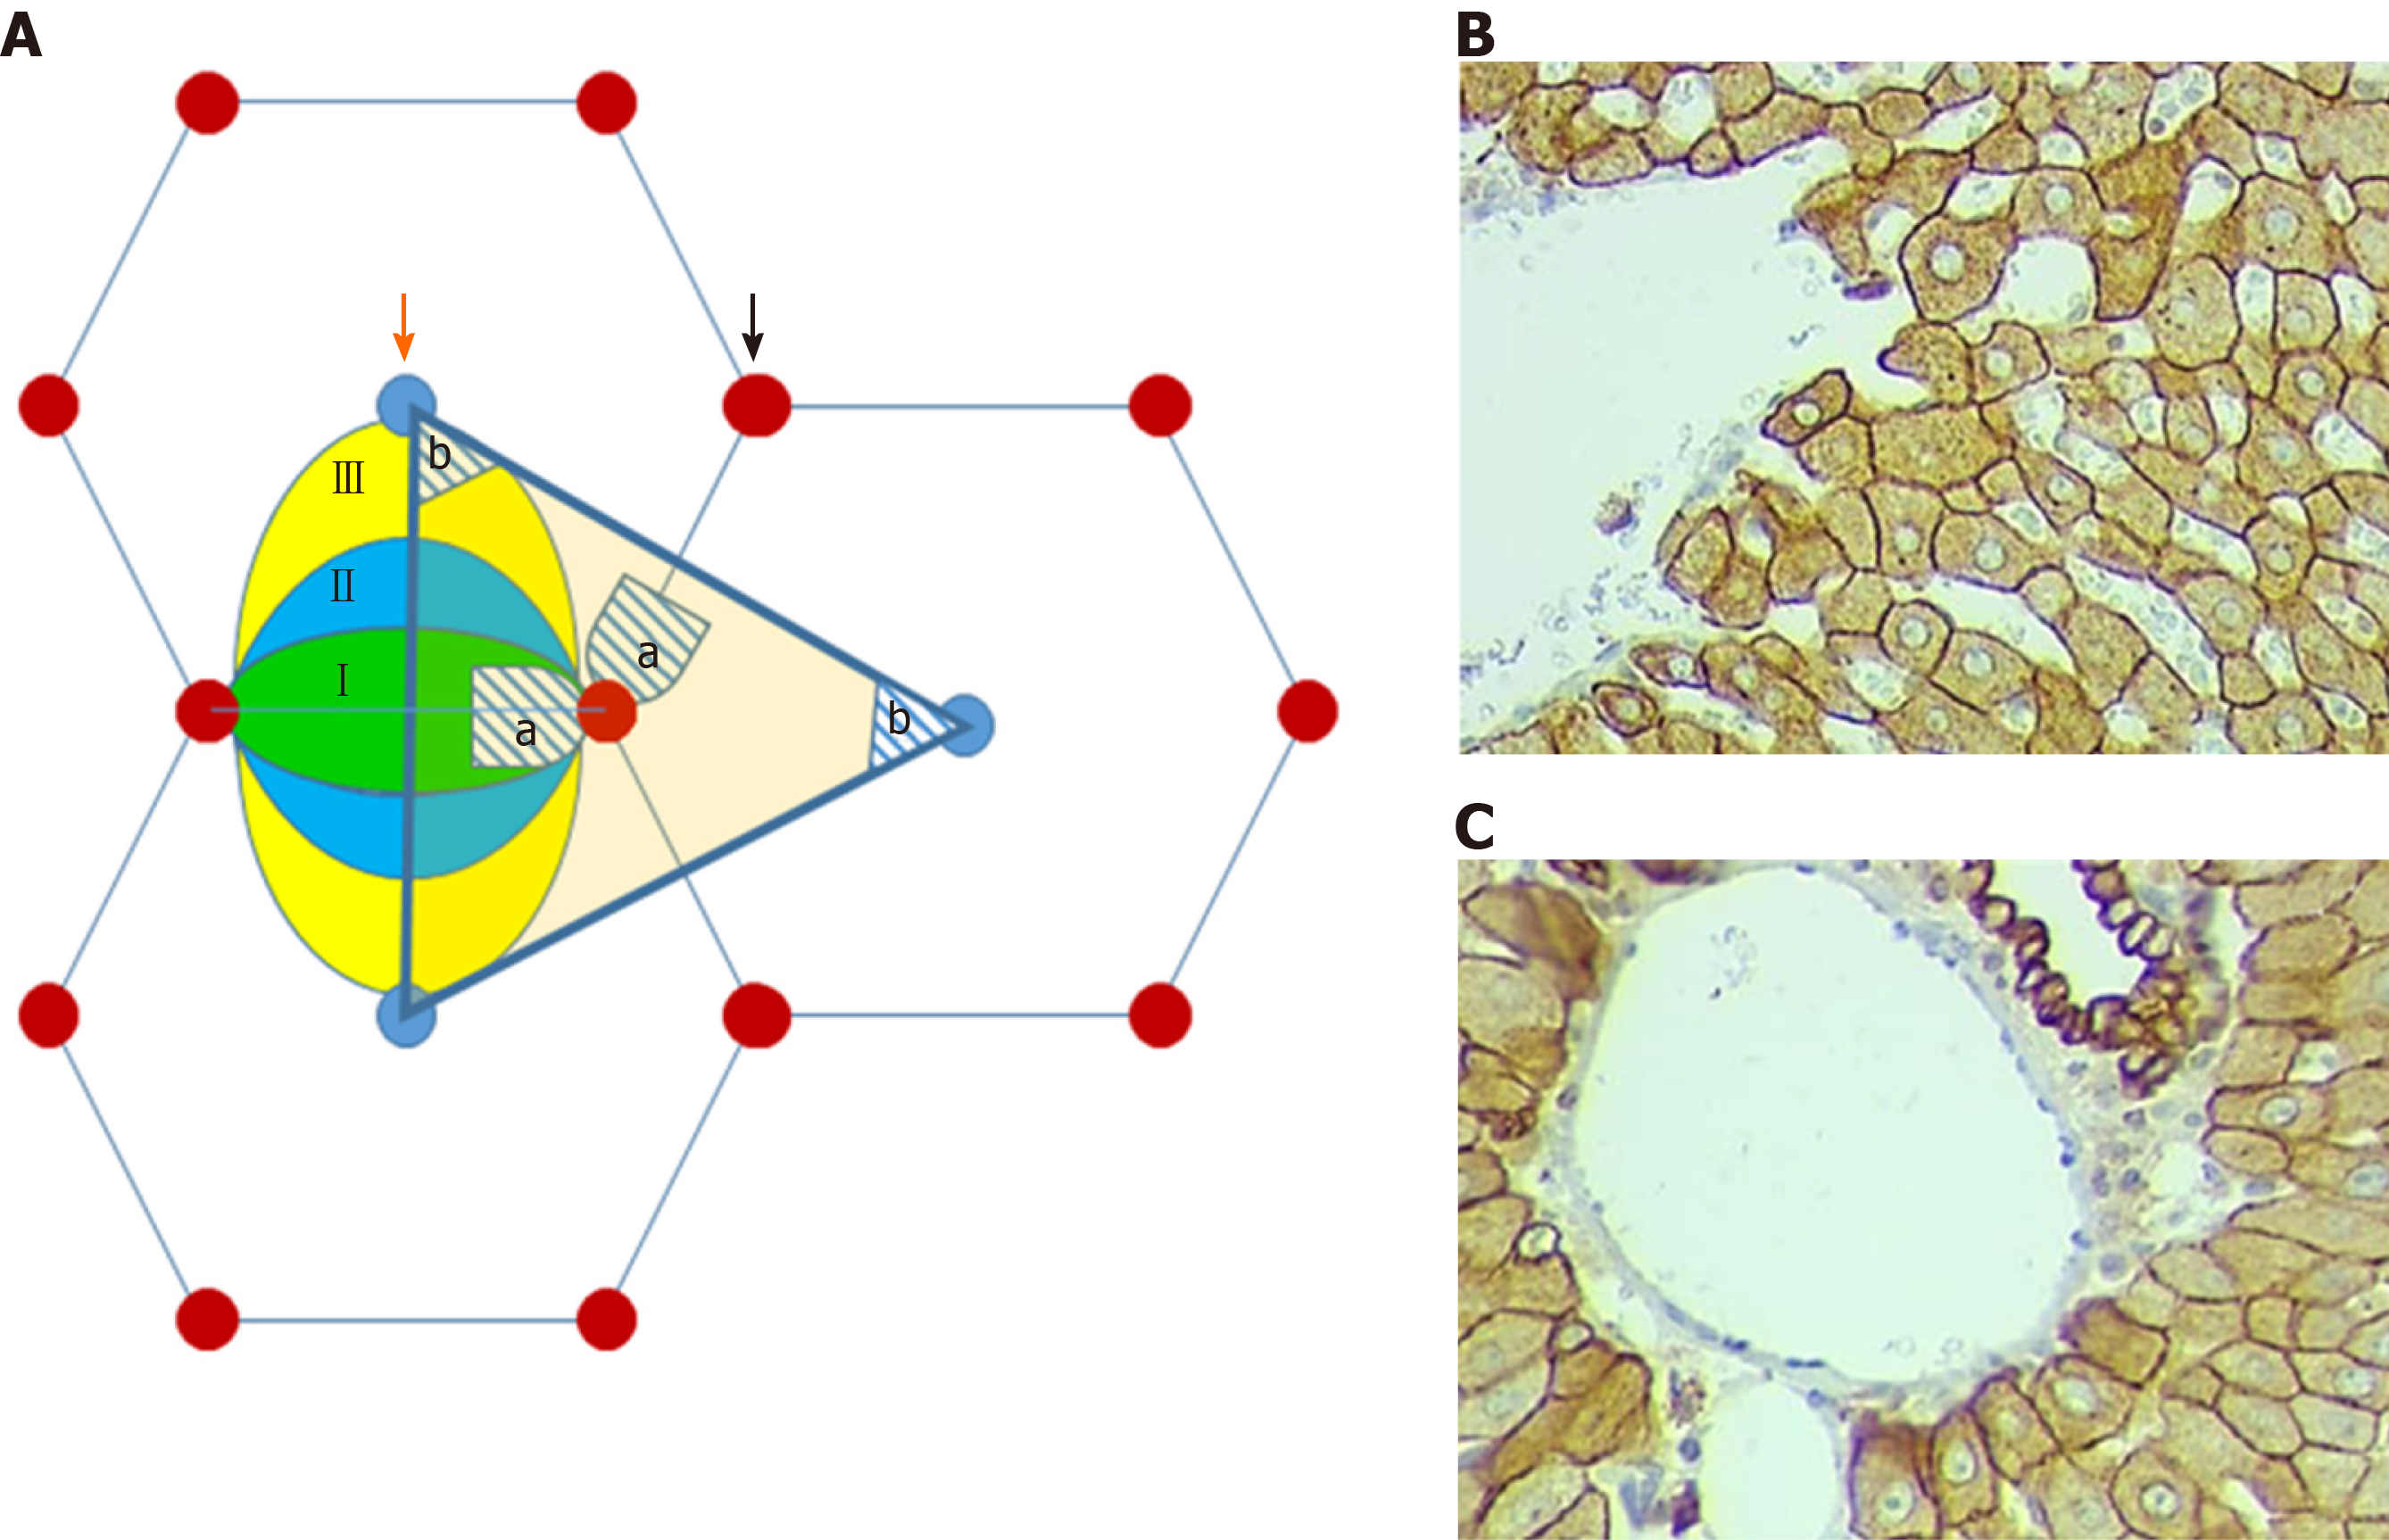
Figure 1 Schematic and histological figures of liver lobule.
A: Schematic illustration of mutual compatibility of “classical” and “portal” lobules with hepatic acini. I, II, III – the zones of the acinus. The hatched periportal area “a” – localized in the 1st zone of the acinus. The hatched pericentral area “b” – localized in the 3rd zone of the acinus. Orange arrow – central vein; black arrow – portal triad. B: Pericentral hepatocytes (CK8) ObX40; OcX20; C: Periportal hepatocytes (CK8). ObX40; OcX20.
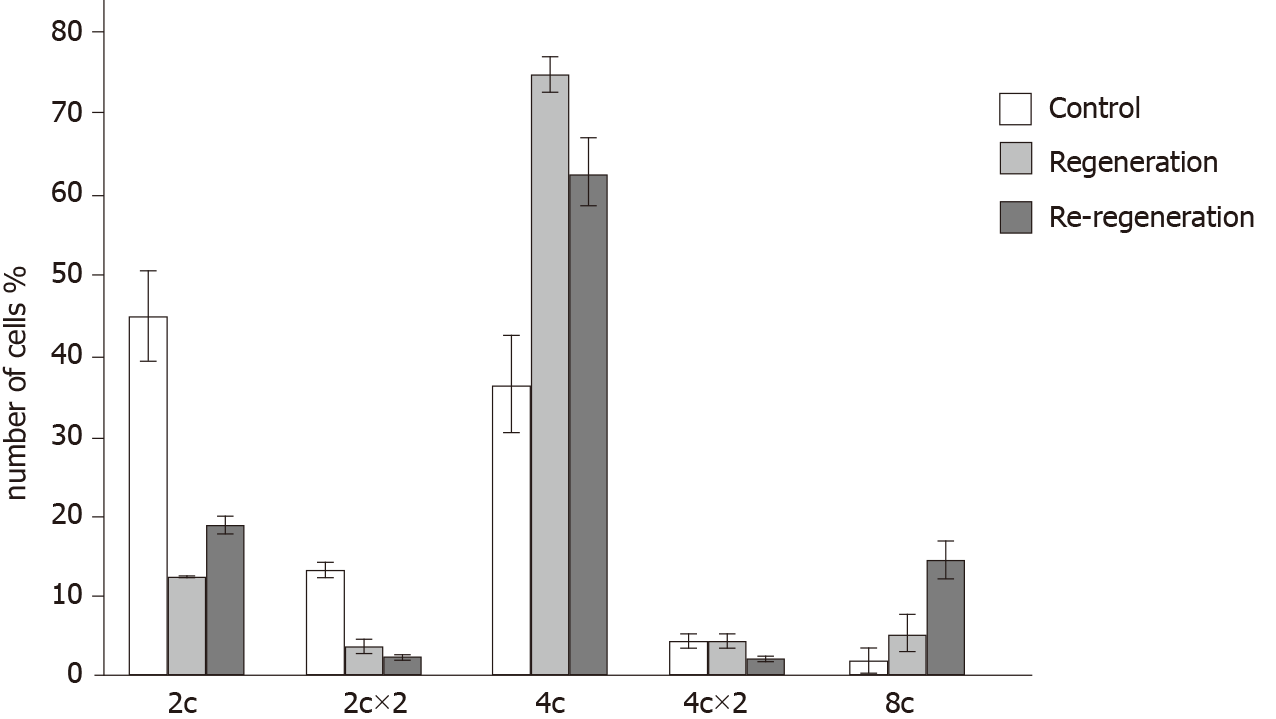
Figure 2 Hepatocytes’ ploidy in normal (control), regenerated (SG1) and re-regeneration (SG2).
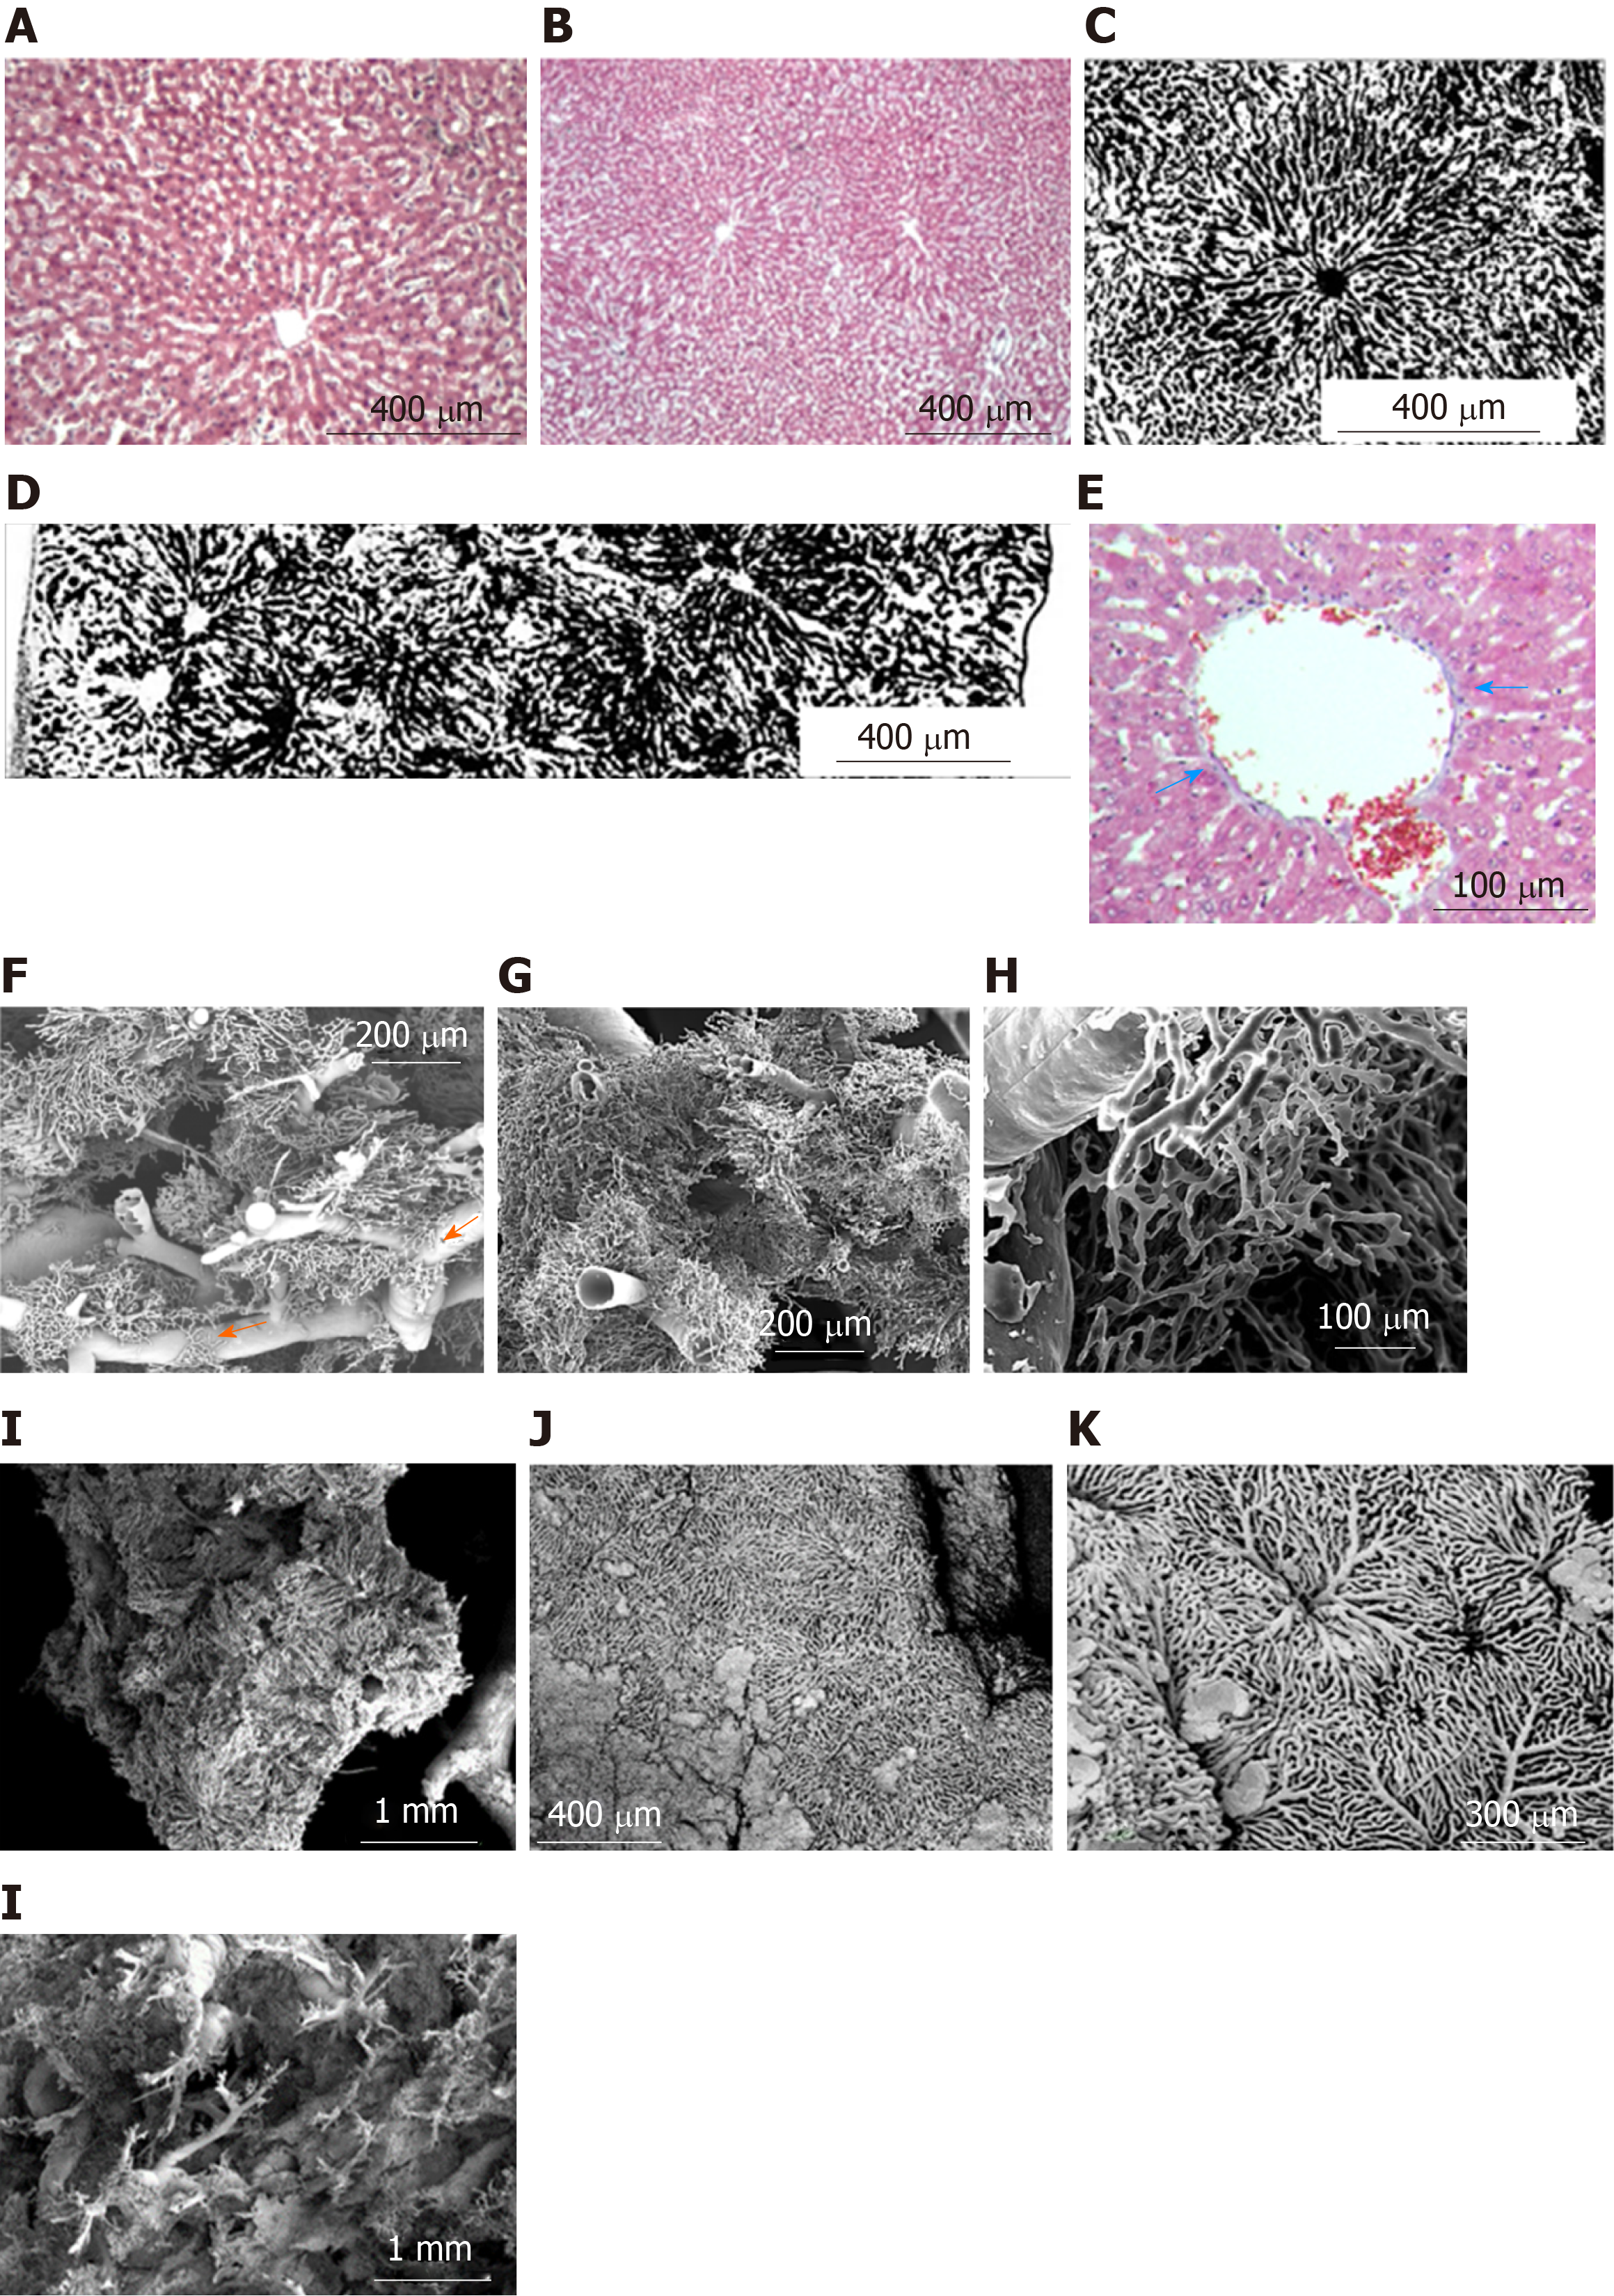
Figure 3 Histology and scanning electron microscopy of corrosion casts of the livers from control group.
A and B: Liver lobules histology (H&E); C: Liver lobule (histology after Indian ink – gelatin injection); D: Adjacent lobules with intercommunicated sinusoidal meshwork (histology after Indian ink – gelatin injection); E: Connective-tissue sheath (arrow) around the tributary of hepatic vein (Masson’s Trichrome); F: Scanning electron microscopy (SEM) of corrosion casts of small branches of portal vein and sinusoids; periportal plexus (arrow); G-L: SEM of corrosion casts of sinusoids and related vessels; J and K: SEM of corrosion casts of superficial (sub-capsular) vessels of the liver.
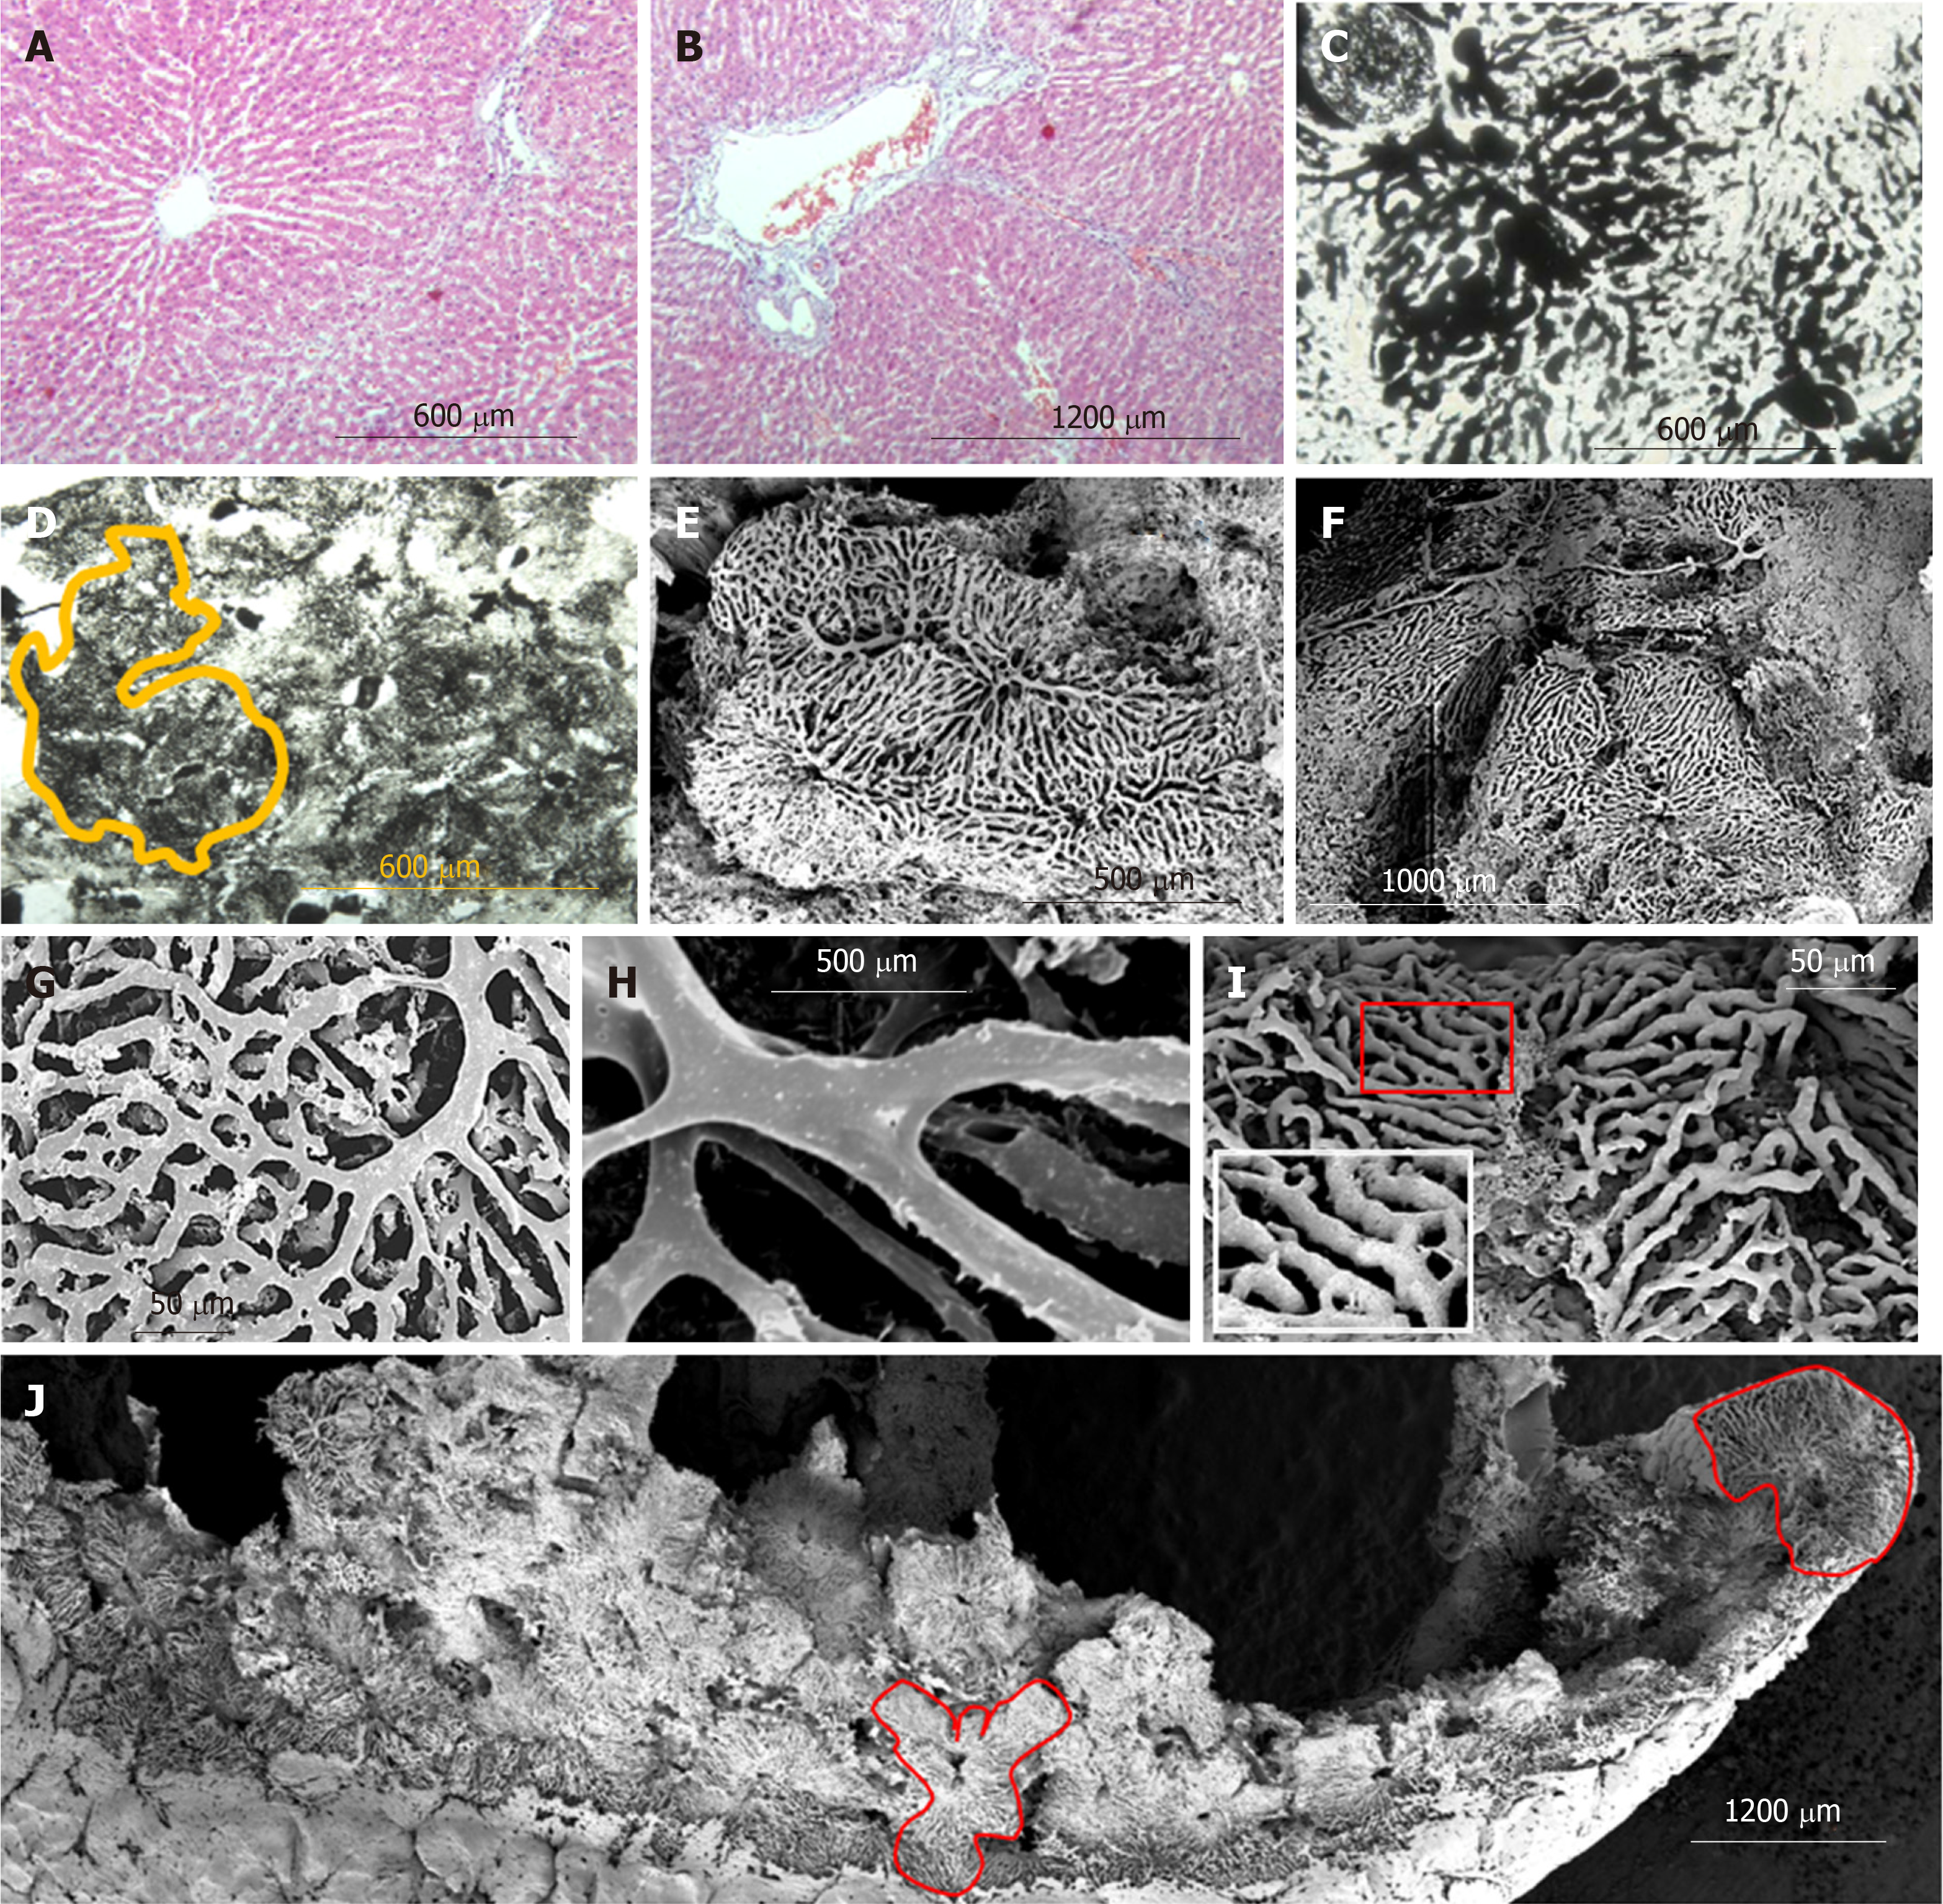
Figure 4 Histology and scanning electron microscopy of corrosion casts of regenerated liver (SG1).
A and B: Liver tissue histology (Masson’s Trichrome); C: Liver lobules (histology after Indian ink – gelatin injection); D: “mega-lobule” formed by adjacent lobules with intercommunicated sinusoidal meshwork (bordered by yellow line) (histology after Indian ink – gelatin injection); E-J: Scanning electron microscopy (SEM) of corrosion casts of liver vessels; E and F: “mega-lobules”; G-I: SEM of corrosion casts of sinusoids; J: SEM of vascular corrosion casts of liver lobe; “mega-lobules” (bordered by red line).
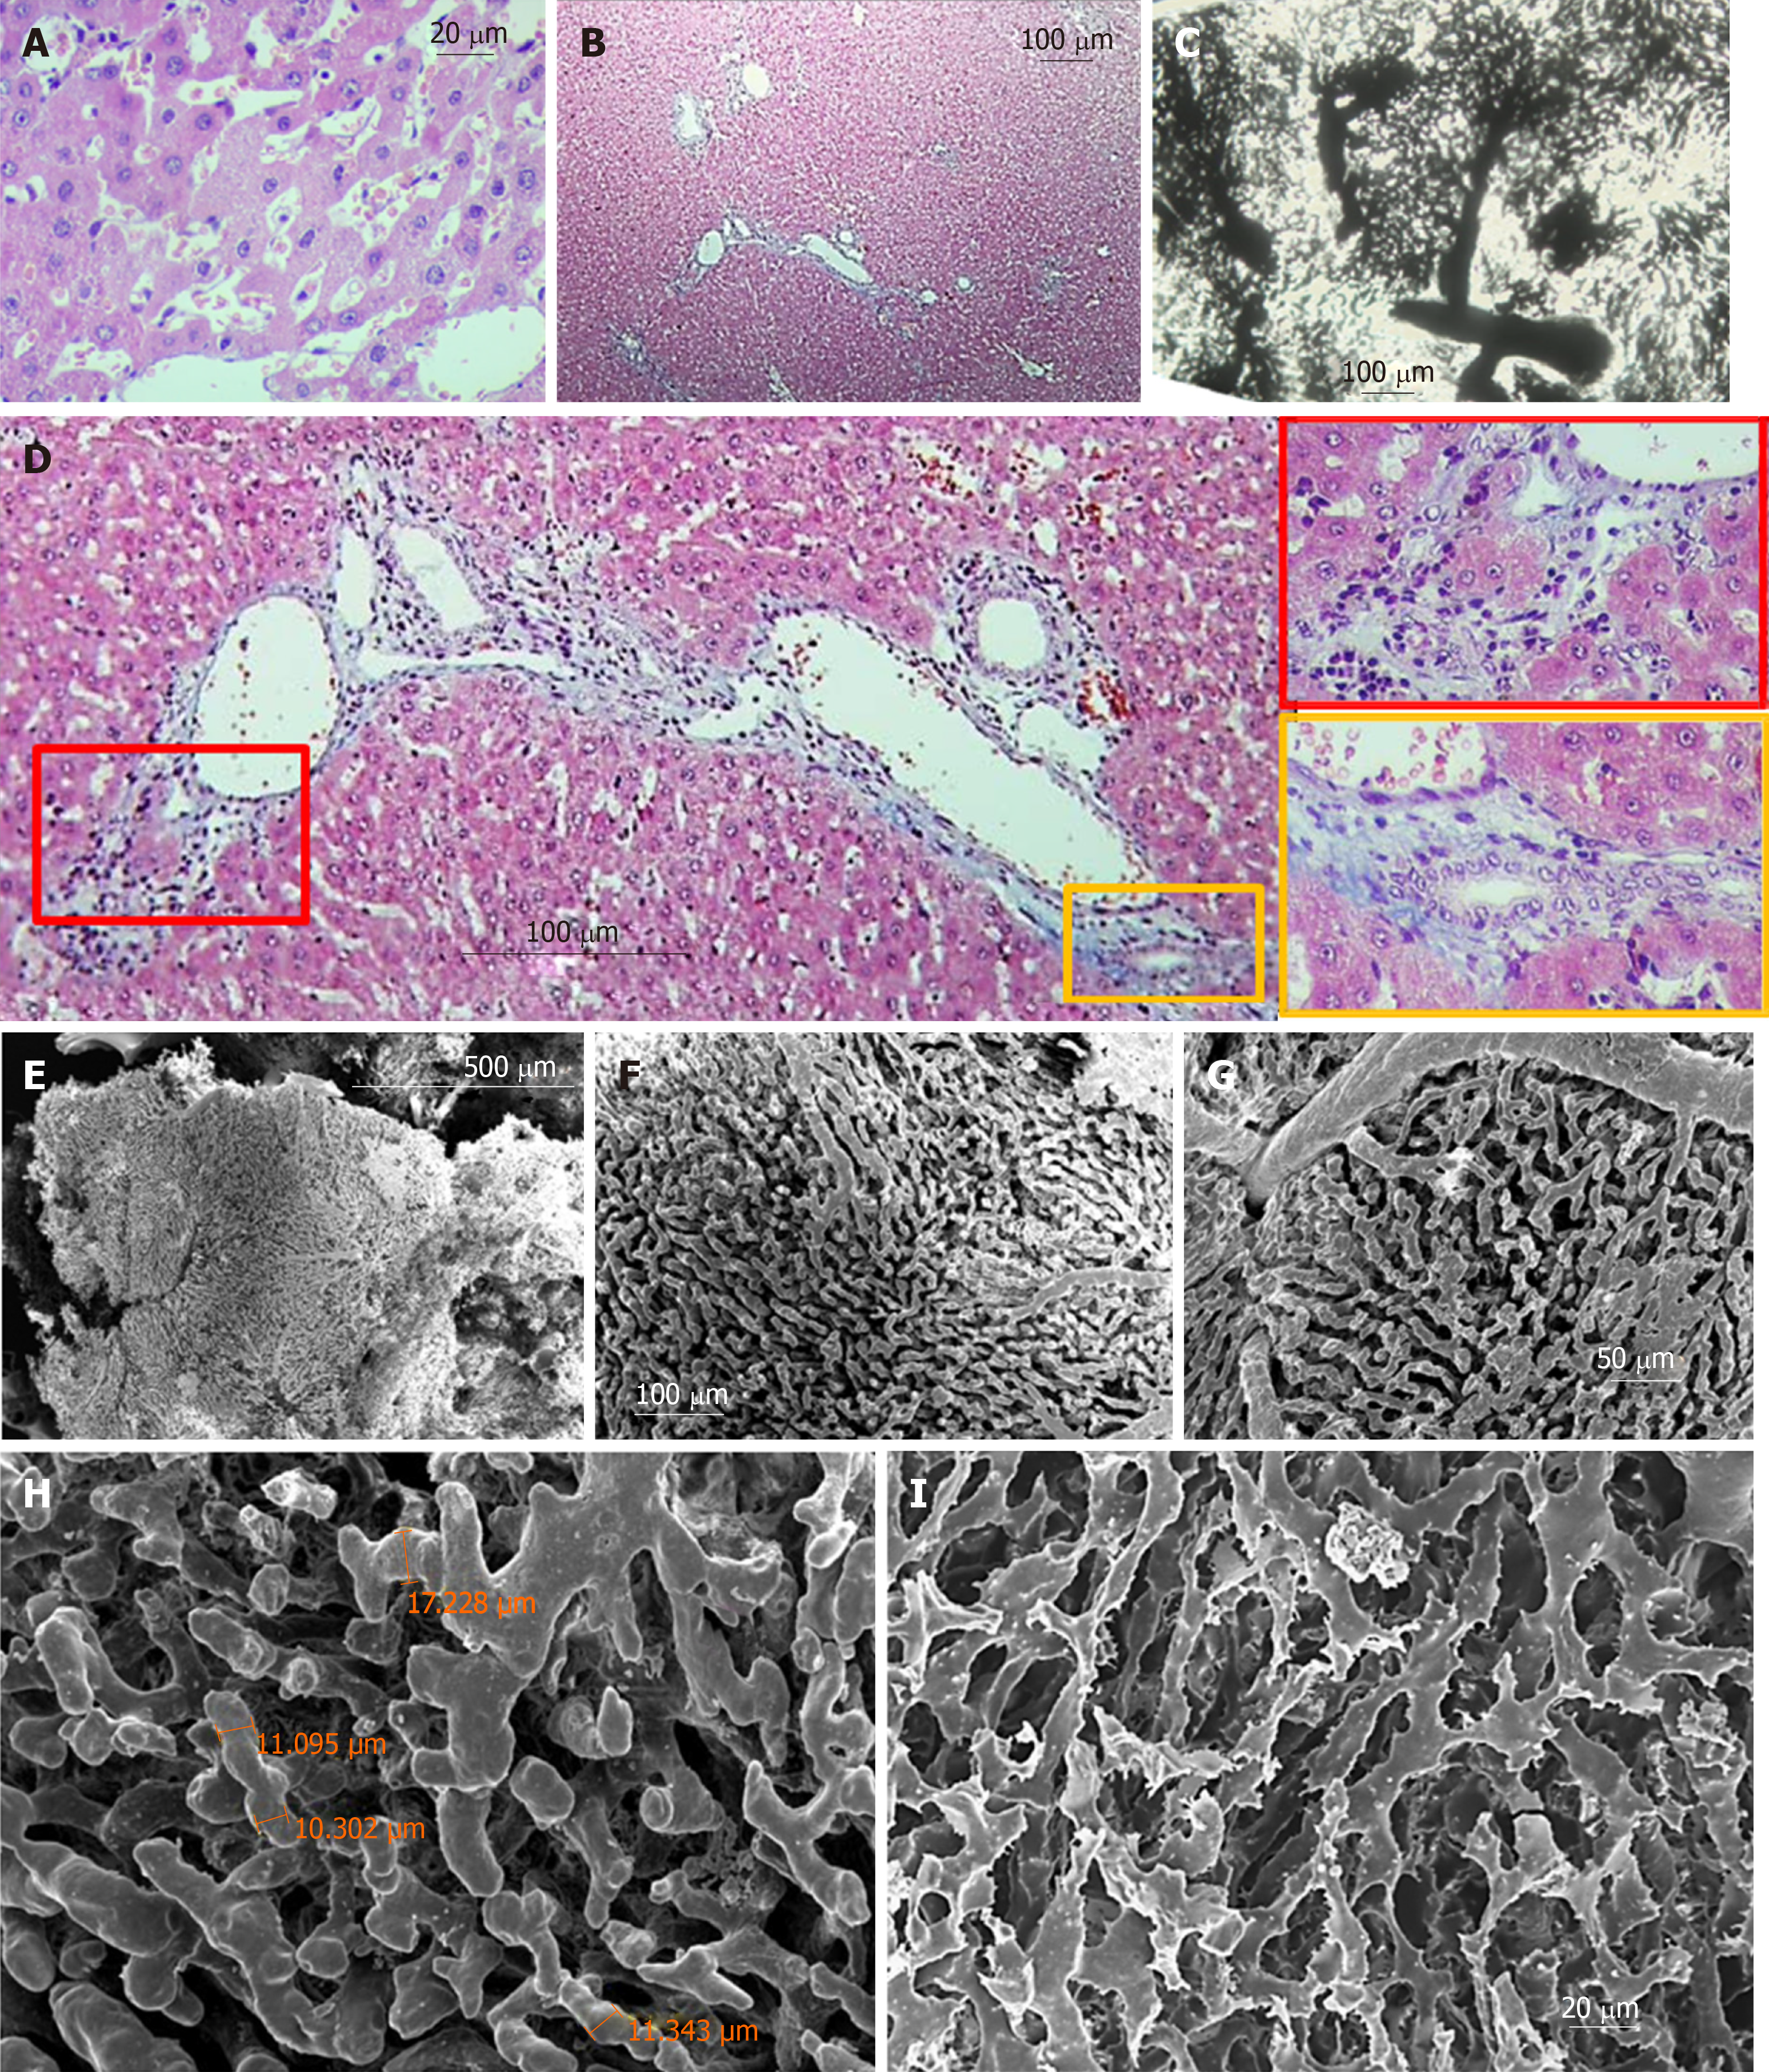
Figure 5 Histology and scanning electron microscopy of corrosion casts of livers from re-regenerated liver (SG2).
A: Liver tissue histology (H&E); B and D: Connective-tissue fibers around the portal triad and perilobular branches (Masson’s Trichrome); C: Liver lobules (histology after Indian ink – gelatin injection); E-I: Scanning electron microscopy (SEM) of liver vascular corrosion casts; E and F: “mega-lobules”; G-I: SEM of corrosion casts of sinusoids
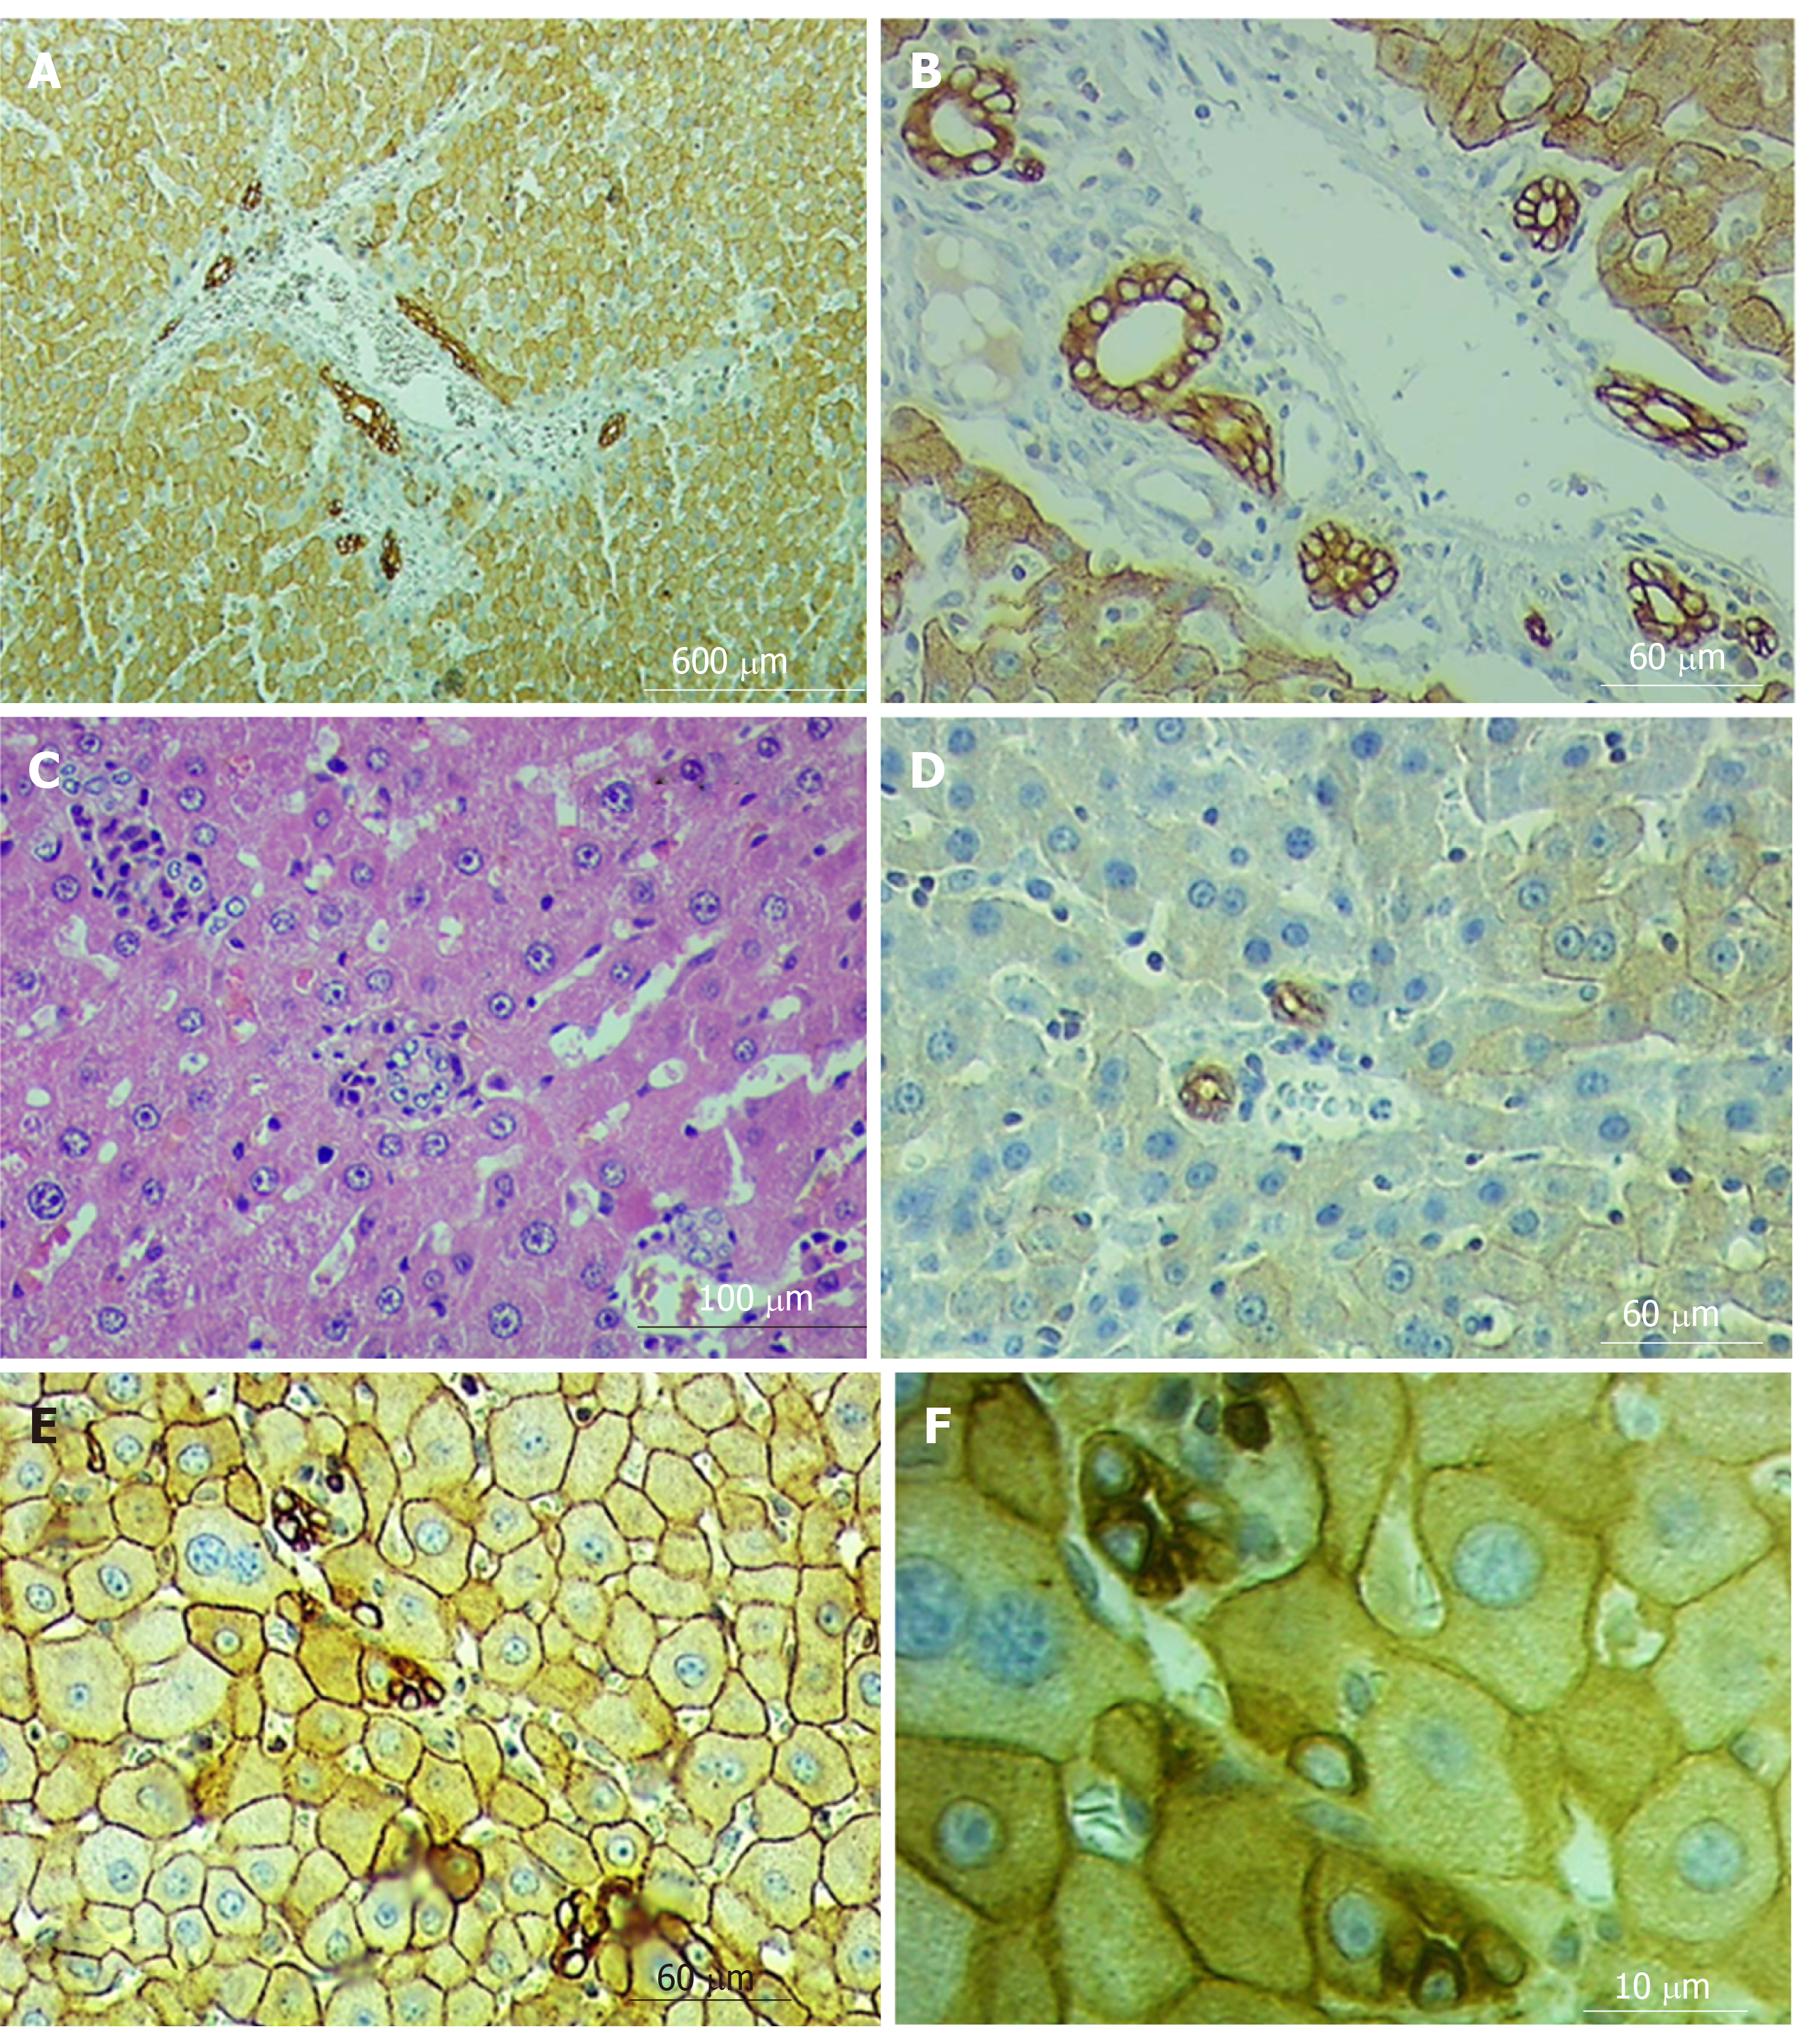
Figure 6 Ductular reaction.
A and B: Portal/periportal ductular reaction in SG1 (CK8); C: Intralobular ductular reaction in SG1 (H&E); D-F: Intralobular ductular reaction in SG2 (CK8).
- Citation: Tsomaia K, Patarashvili L, Karumidze N, Bebiashvili I, Azmaipharashvili E, Modebadze I, Dzidziguri D, Sareli M, Gusev S, Kordzaia D. Liver structural transformation after partial hepatectomy and repeated partial hepatectomy in rats: A renewed view on liver regeneration. World J Gastroenterol 2020; 26(27): 3899-3916
- URL: https://www.wjgnet.com/1007-9327/full/v26/i27/3899.htm
- DOI: https://dx.doi.org/10.3748/wjg.v26.i27.3899


