Copyright
©The Author(s) 2020.
World J Gastroenterol. Apr 14, 2020; 26(14): 1601-1612
Published online Apr 14, 2020. doi: 10.3748/wjg.v26.i14.1601
Published online Apr 14, 2020. doi: 10.3748/wjg.v26.i14.1601
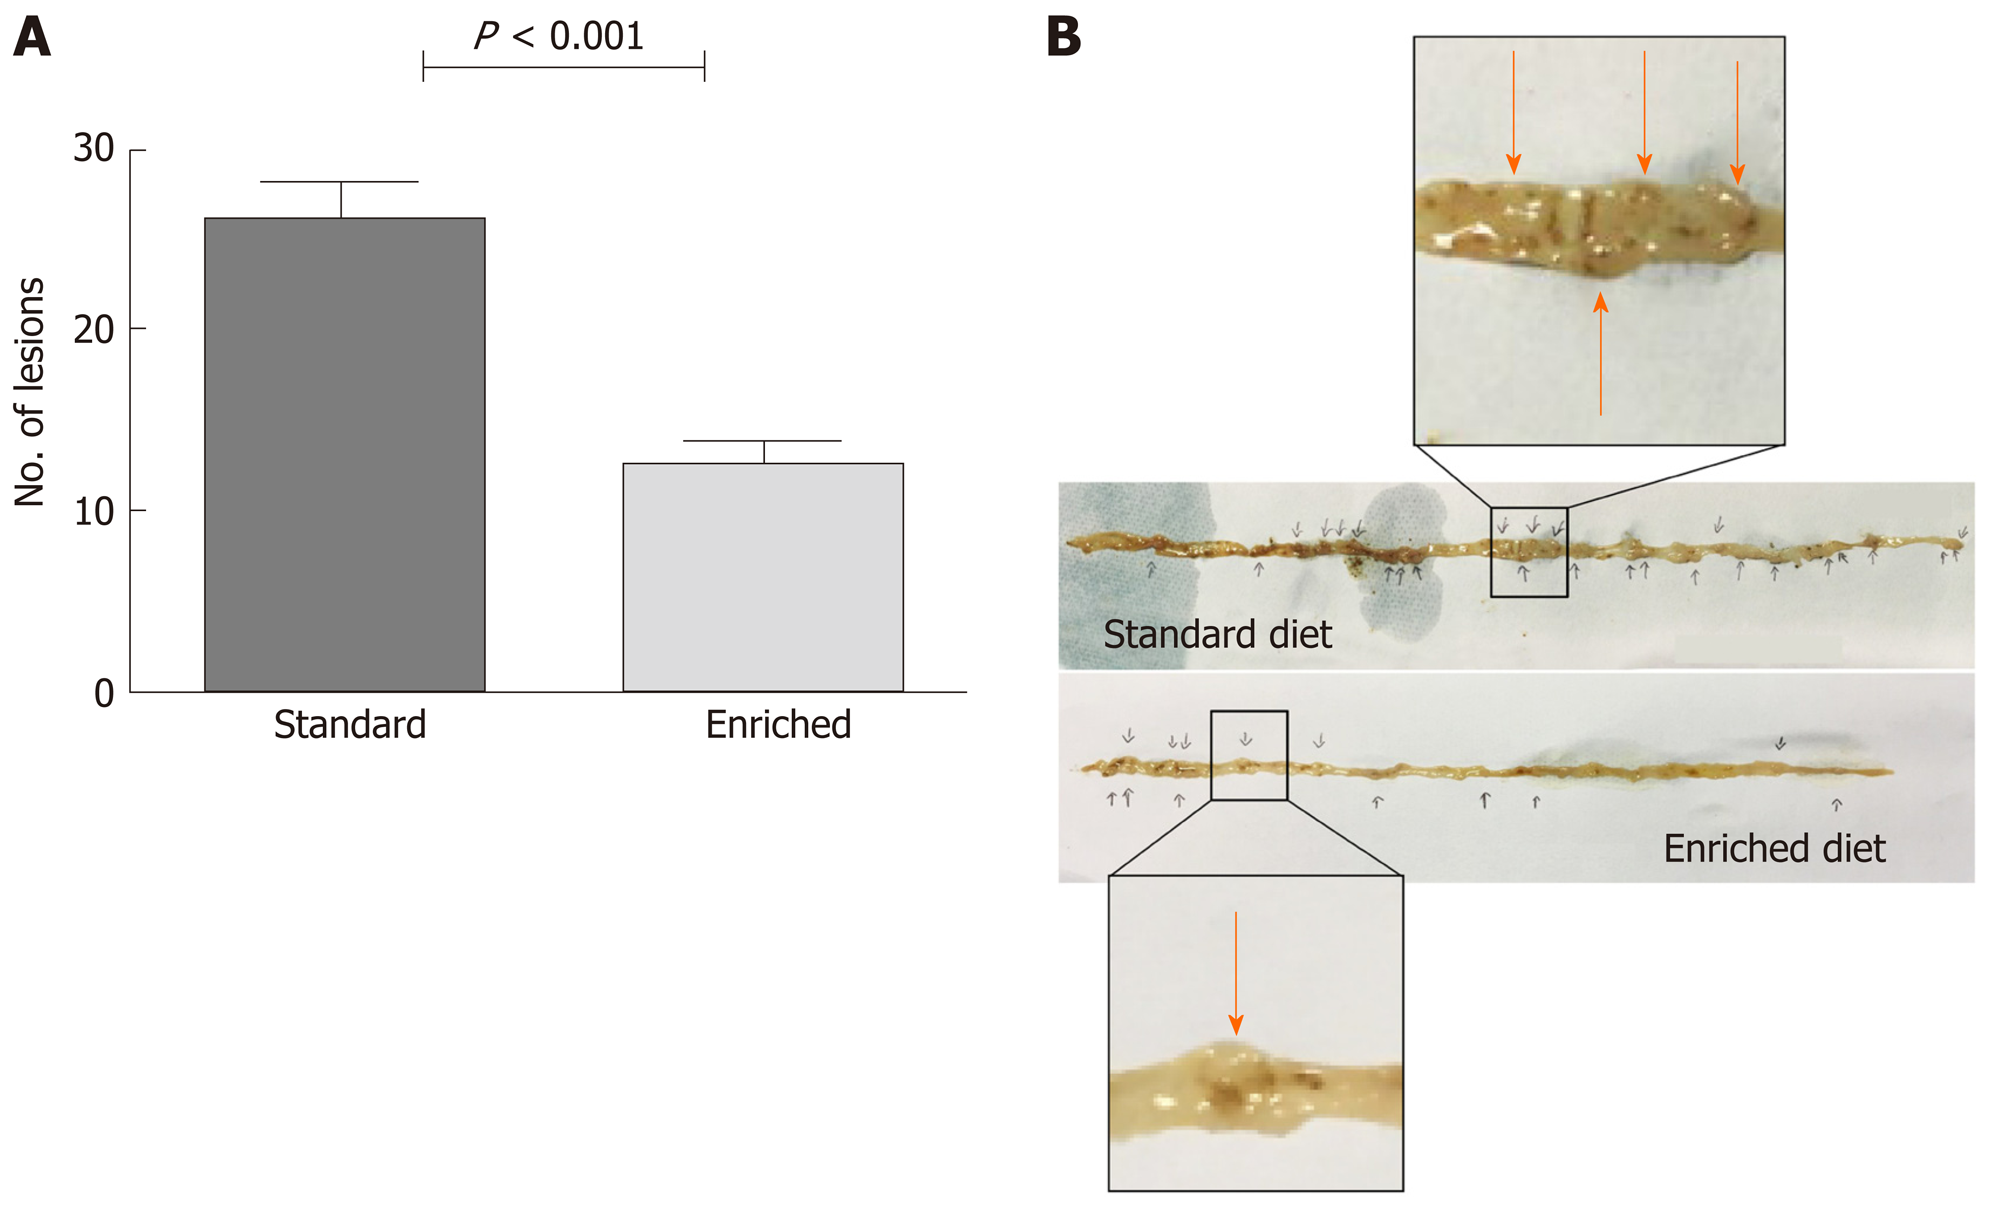
Figure 1 The number of polypoid lesions per animal in the small bowel was reduced in the enriched compared to the standard diet group.
A: Number of small bowel solid lesions (mean ± SD/animal) in ApcMin/+ mice assuming standard or enriched diet; B: Autopsy macroscopic picture of murine intestine in standard diet (above) and enriched diet (below). Intestinal polypoid lesions are magnified in boxes and highlighted by arrows.
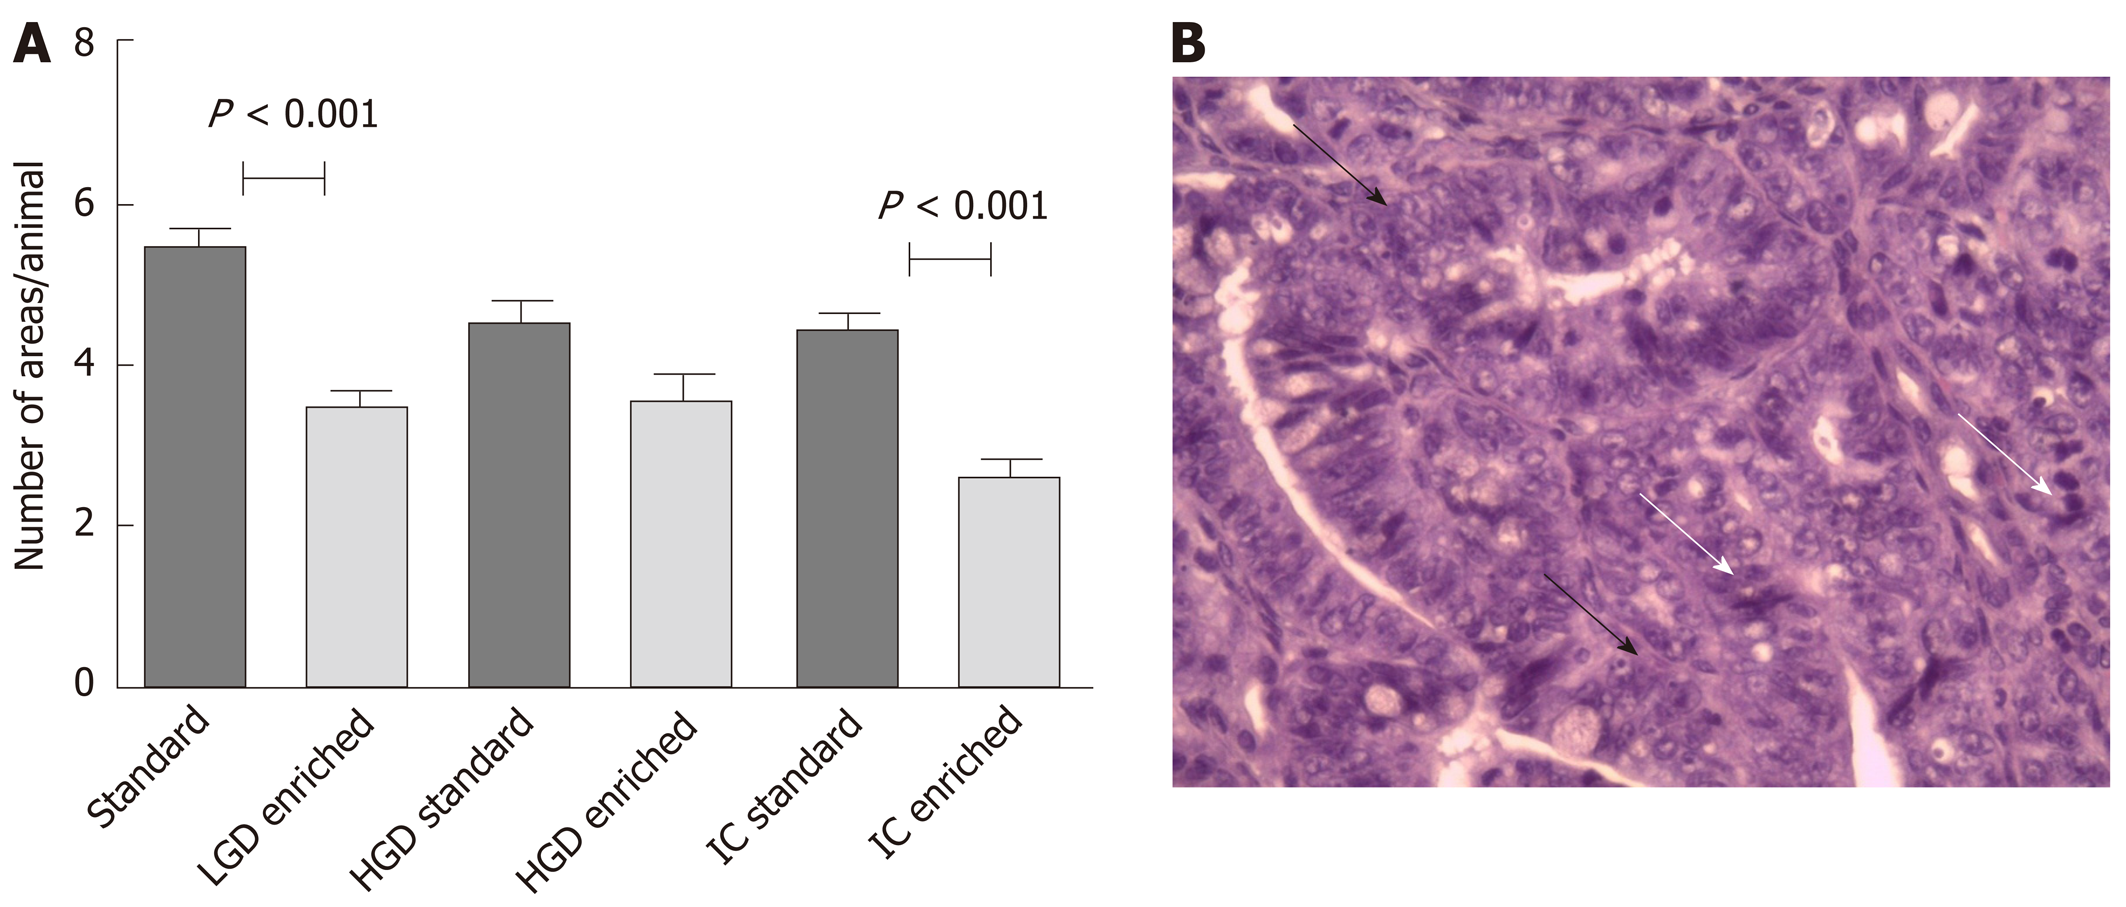
Figure 2 Results summarize and an explanatory example of intestinal carcinoma histological picture.
A: Mean number ± SD/mouse of microscopic areas of low-grade dysplasia, high grade dysplasia and intestinal carcinoma. B: A histological picture of intestinal carcinoma (hematoxylin-eosin stain) showing cell crowding and pleomorphism (white arrow), architectural loss and nuclear hyperchromatism (black arrow). LGD: Low-grade dysplasia; HGD: High grade dysplasia; IC: Intestinal carcinoma.
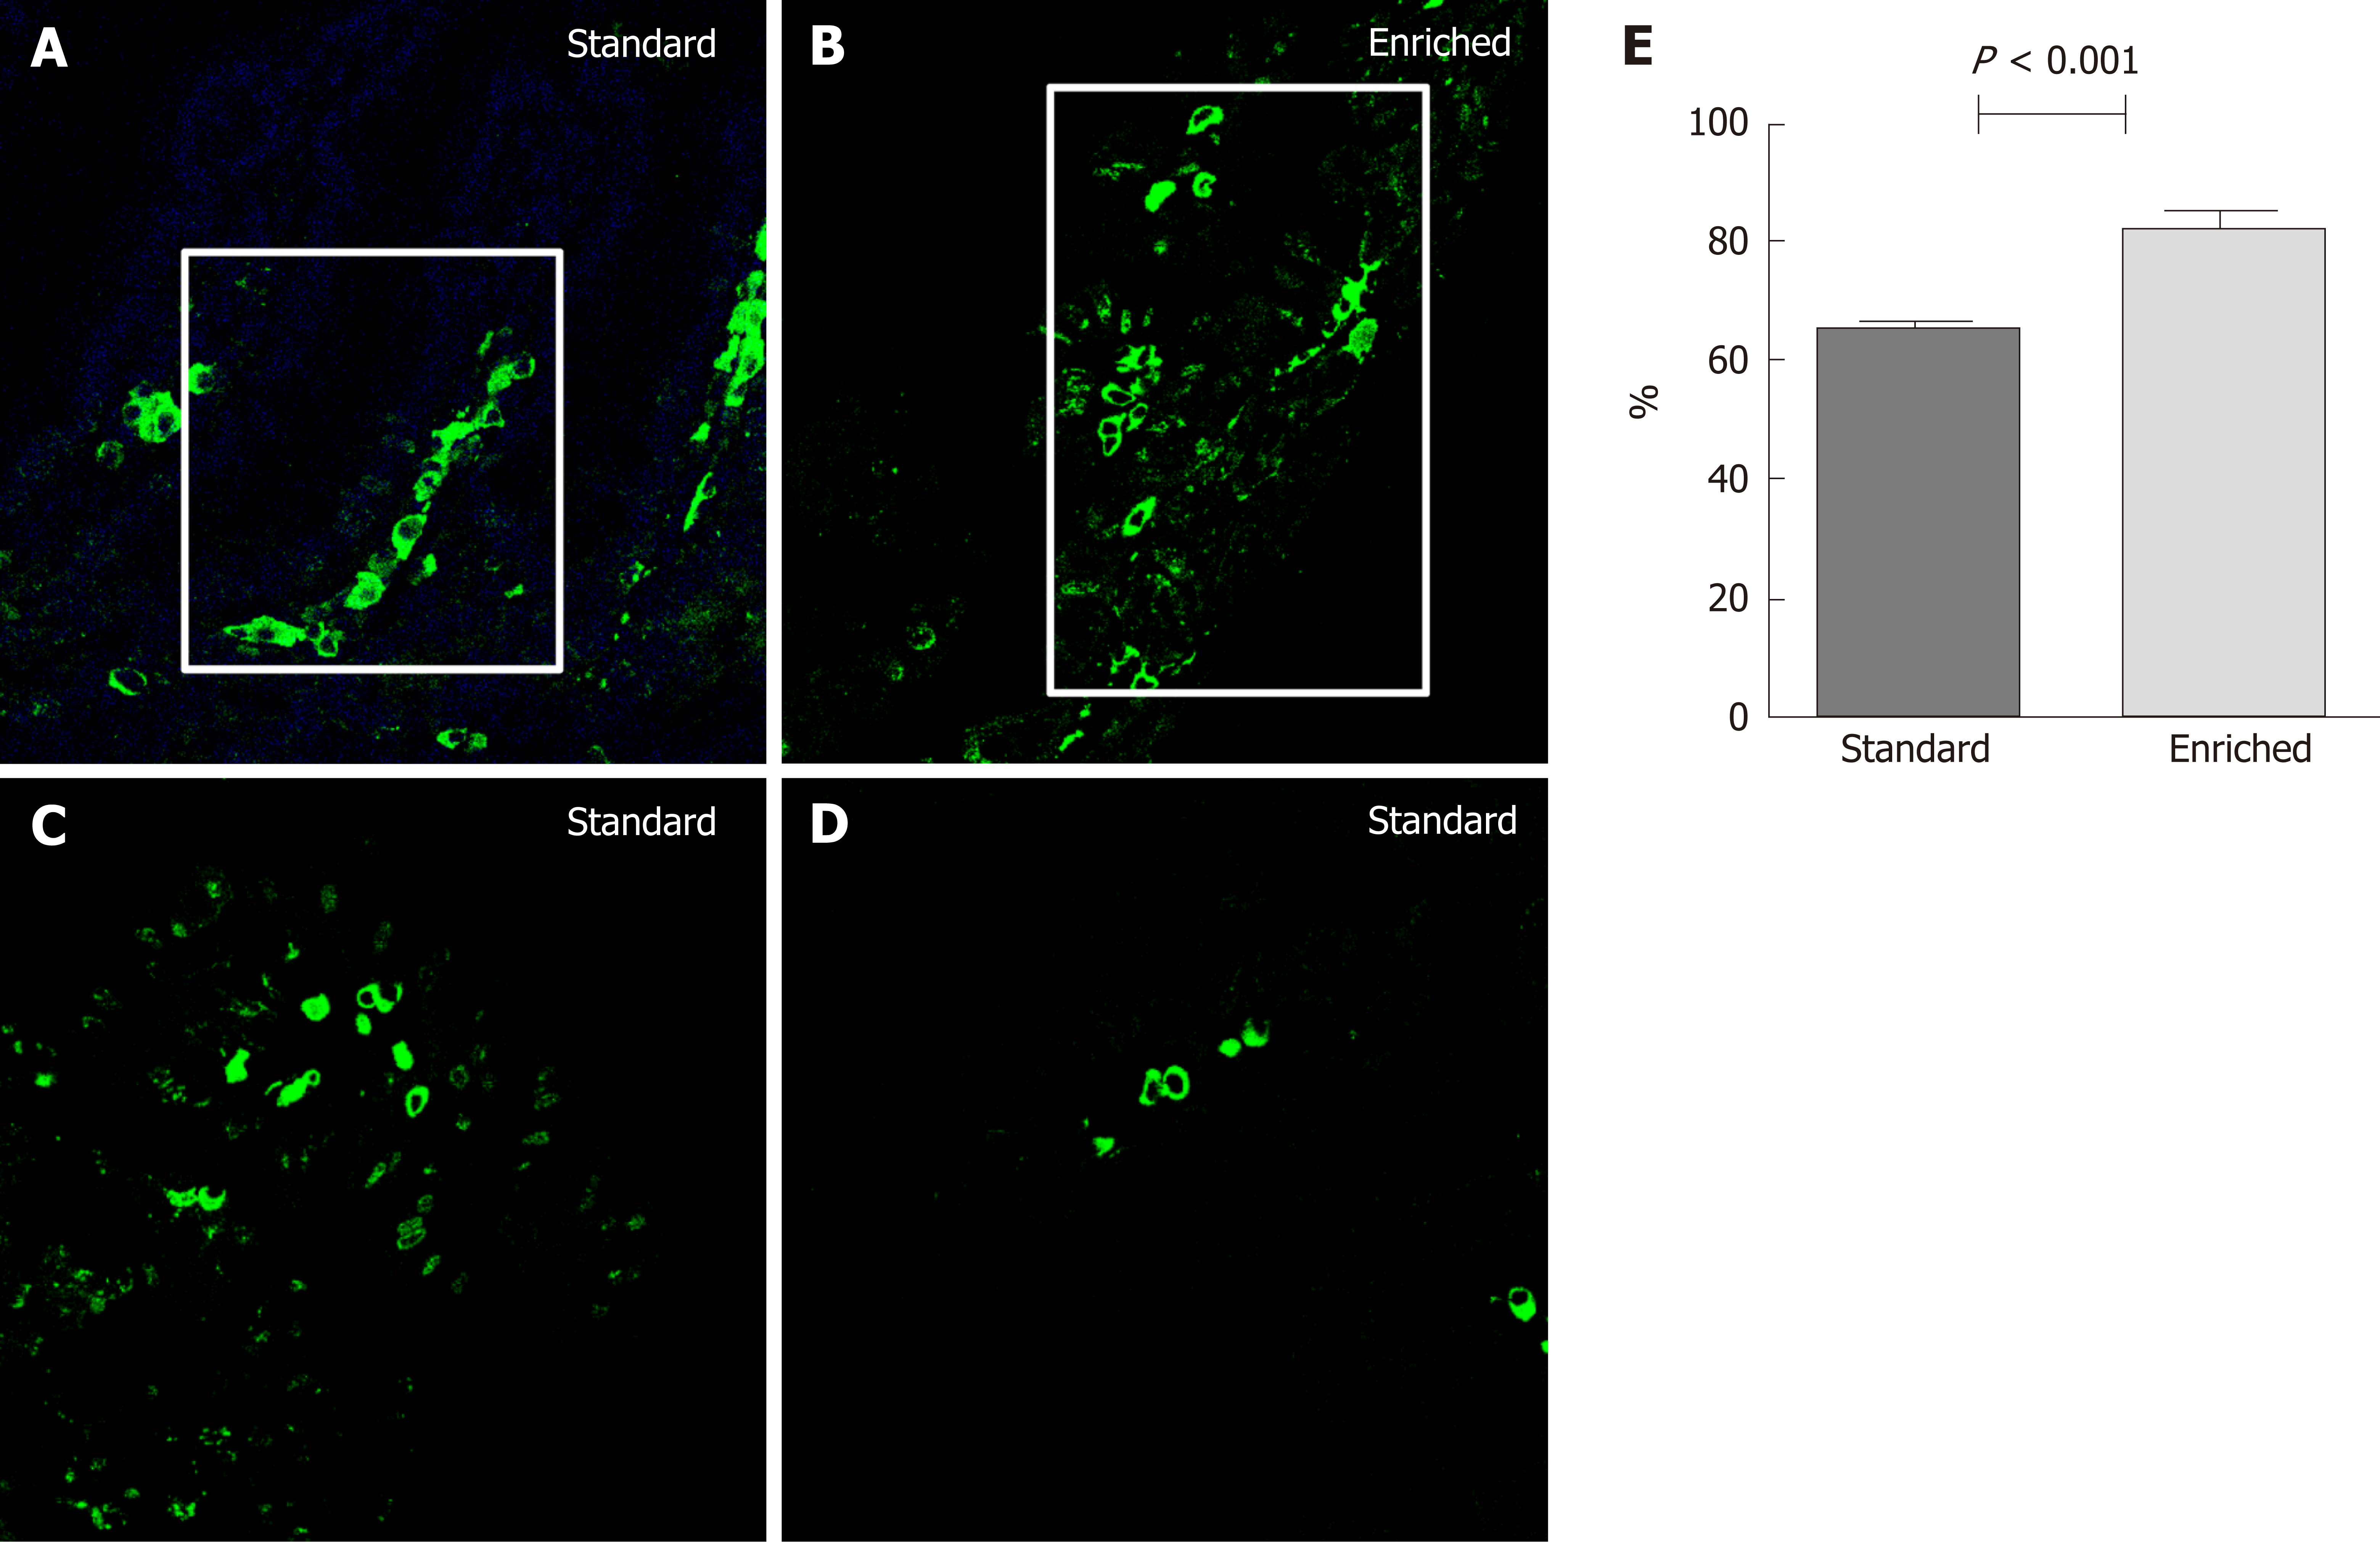
Figure 3 The percentage of villous axis covered by the highest labeled cell at the 48th h after injection in normal mucosa.
A, B: Percentage of villous area covered by the highest bromodeoxyuridine labeled cell at the 48th h after injection in normal colonic mucosa in standard (A) and enriched diet group (B); C, D: The pictures at 72th (C) and 96th (D) h in standard group is represented; the findings at these times were the same in the enriched diet group and limited to the tip of villi. Positive cells are stained green (confocal microscopy; magnification: 630 ×); E: Quantitative analysis.
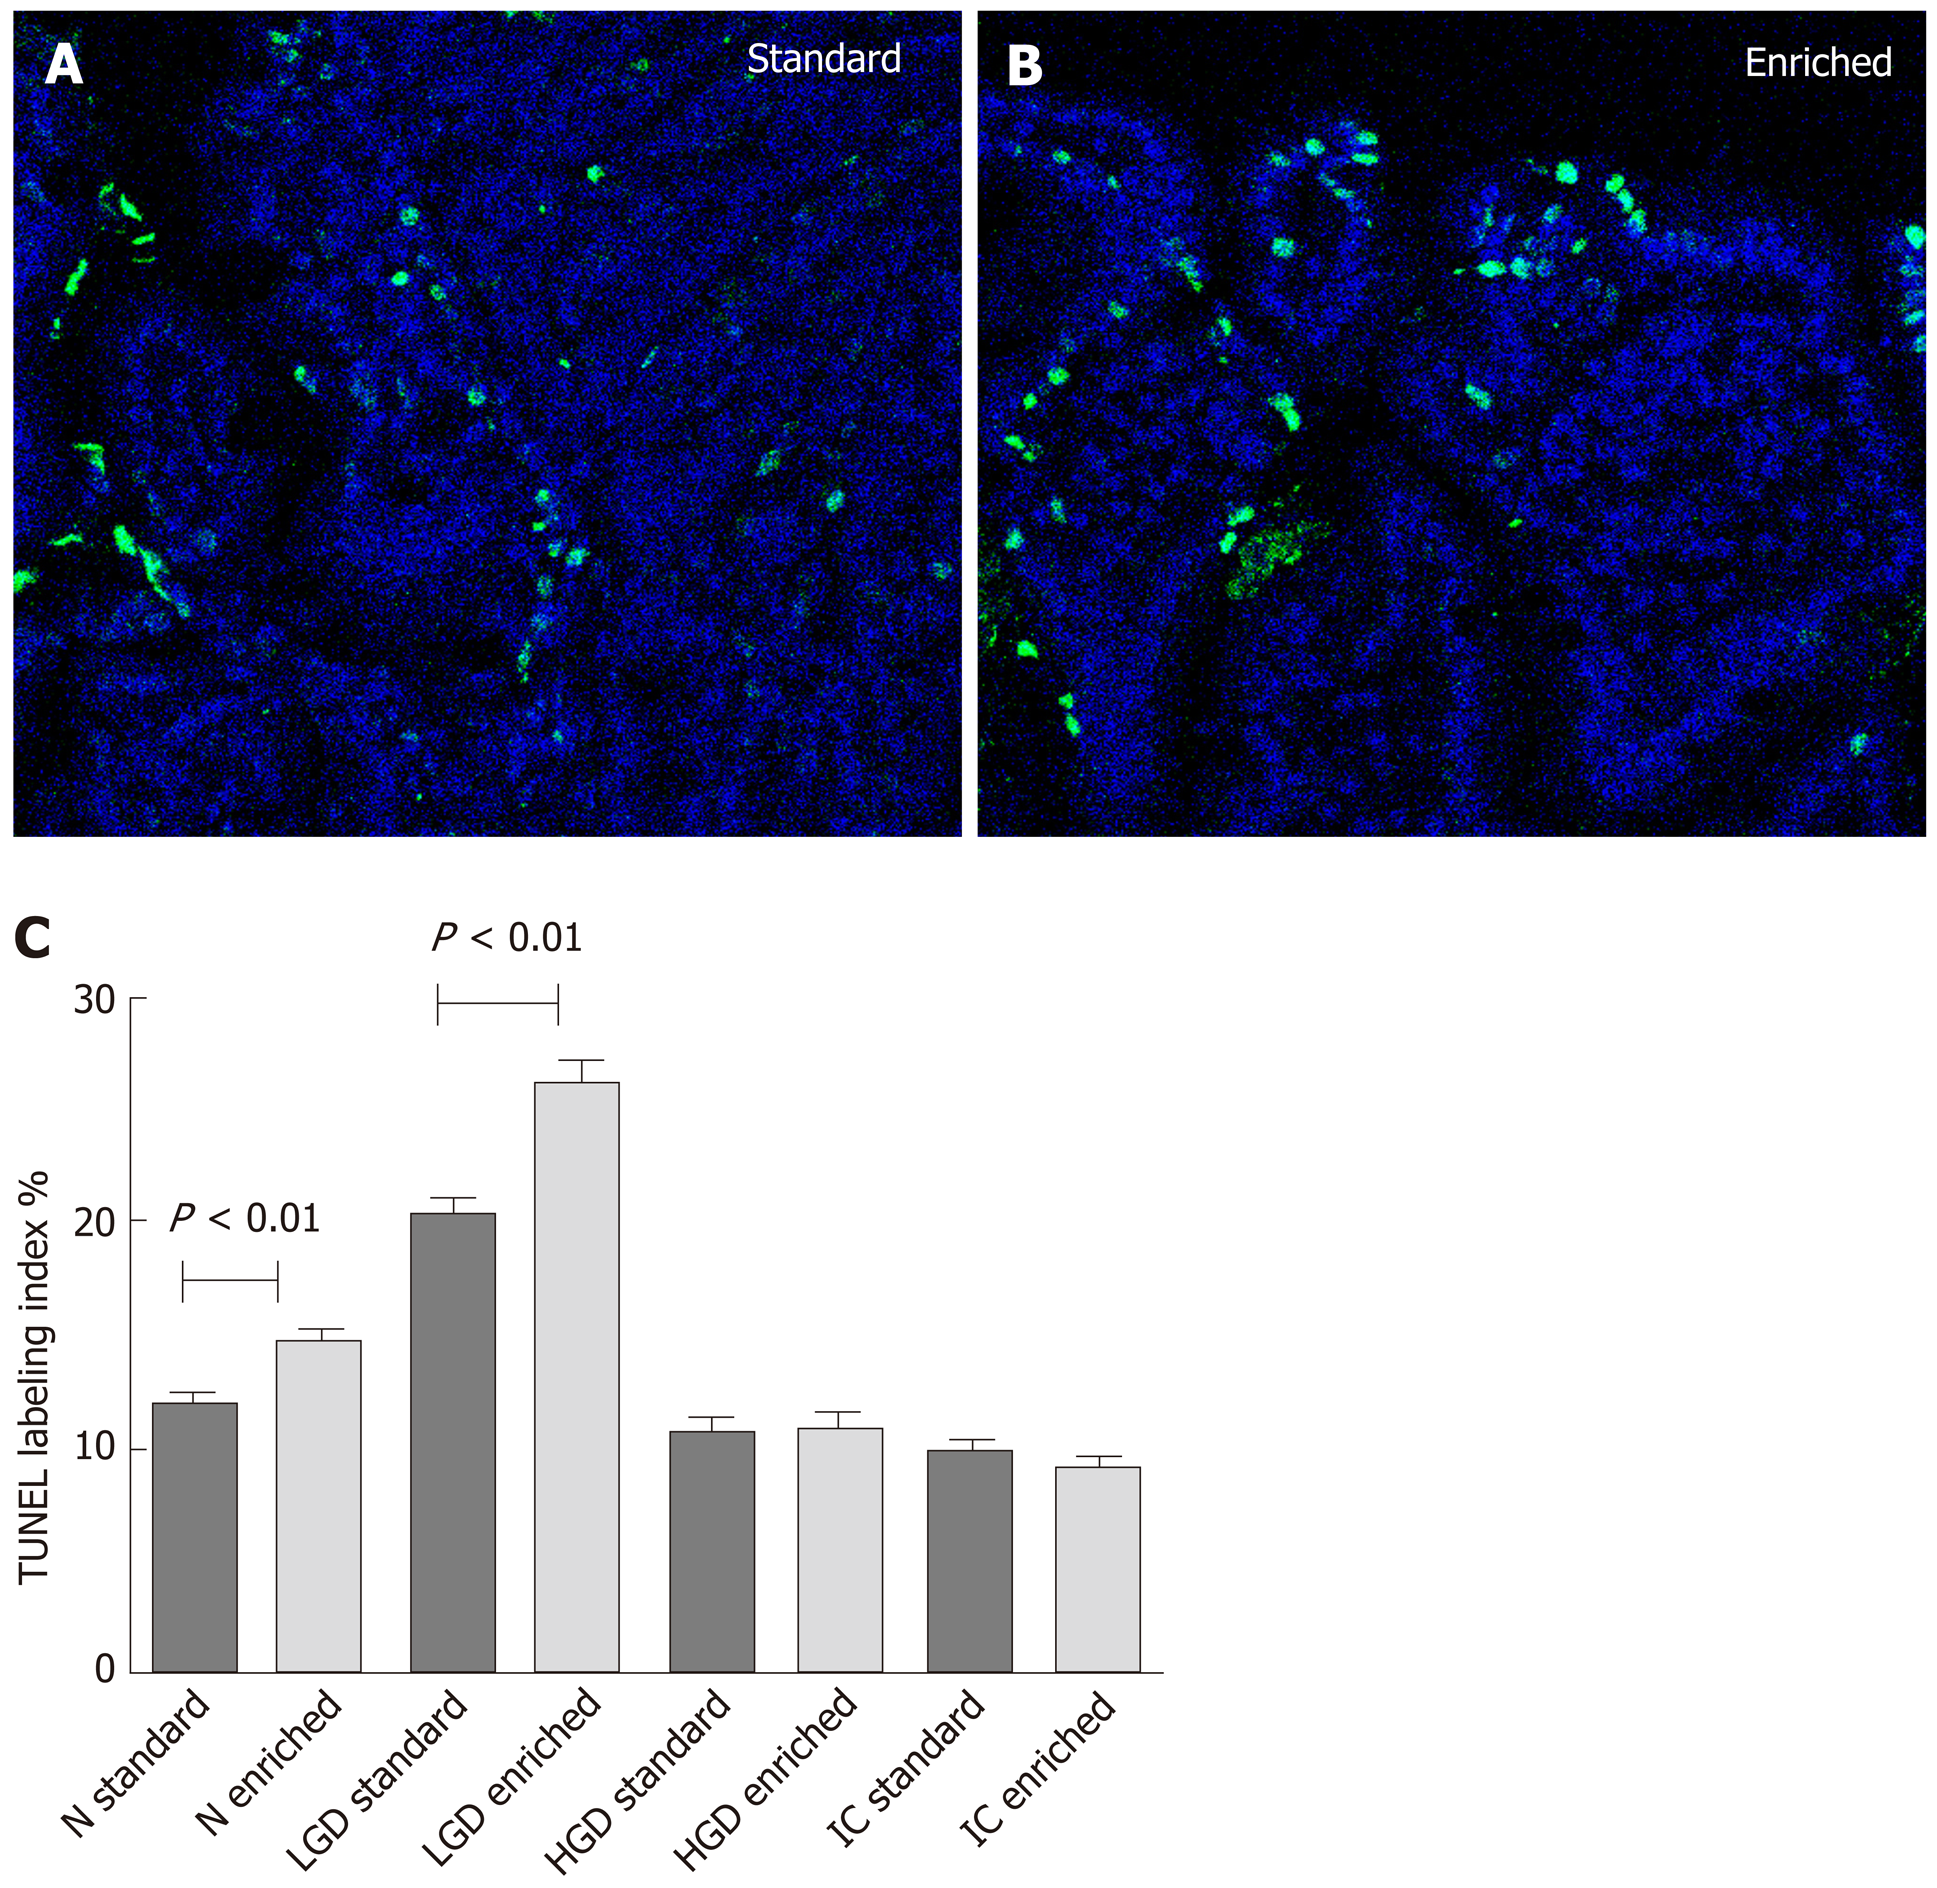
Figure 4 Immuno-fluorescent TUNEL expression.
A, B: Immuno-fluorescent TUNEL expression in low grade dysplasia (LGD) areas of both the standard (A) and enriched diet group (B). Positive cells are stained green and negative ones blue (magnification: 630 ×). C: The statistical comparison of labeling index. LGD: Low-grade dysplasia; HGD: High grade dysplasia; IC: Intestinal carcinoma.
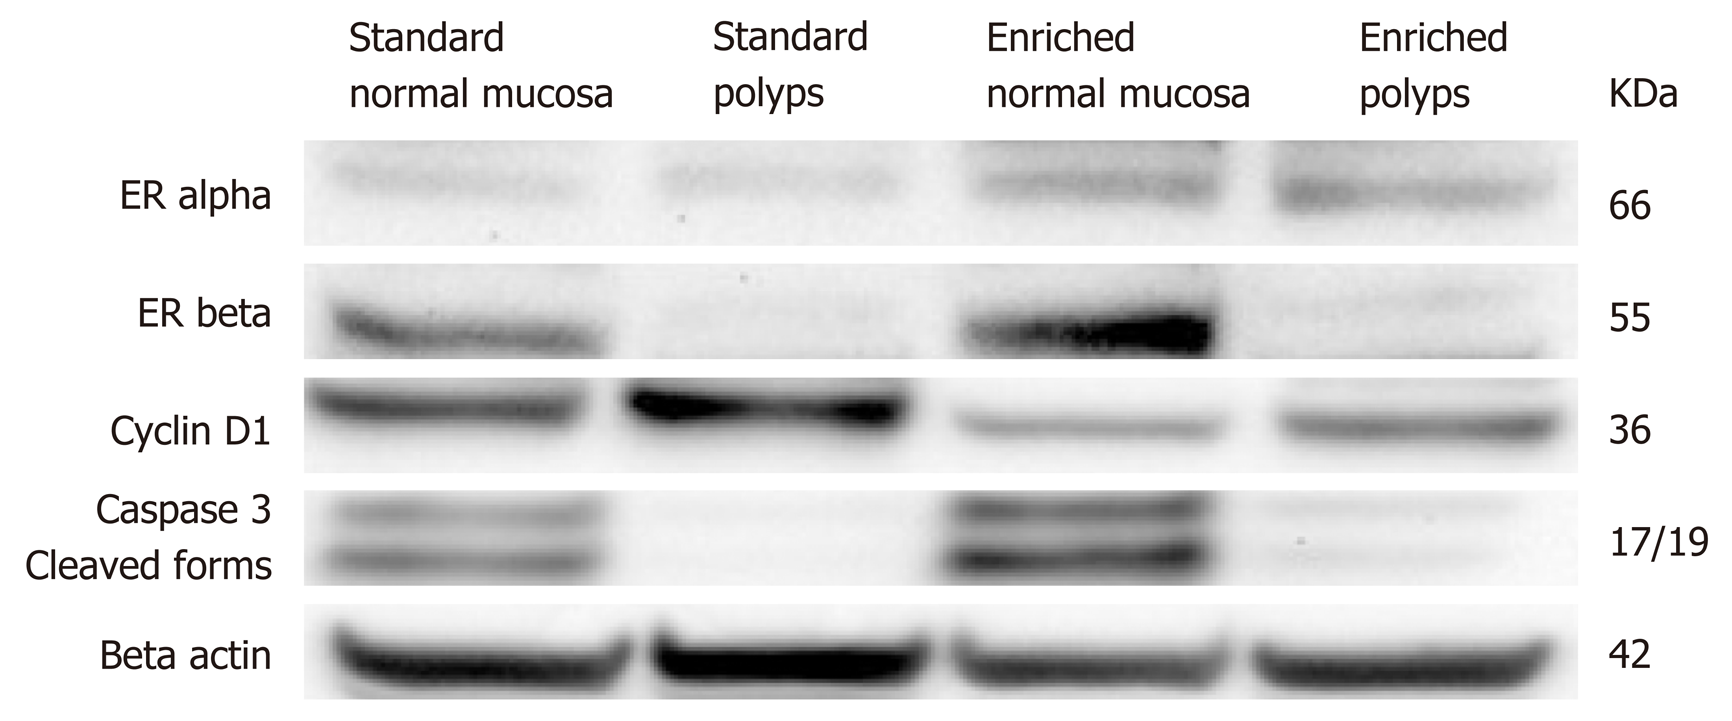
Figure 5 Representative western blotting showing estrogen receptor alpha, estrogen receptor beta, cyclin D1, caspase 3 (cleaved form) in ApcMin/+ mice assuming standard or enriched diet evaluated in normal and polypoid tissues; beta actin was used as loading control (panel shows representative bolts of three different experiments performed with similar results).
- Citation: Girardi B, Pricci M, Giorgio F, Piazzolla M, Iannone A, Losurdo G, Principi M, Barone M, Ierardi E, Di Leo A. Silymarin, boswellic acid and curcumin enriched dietetic formulation reduces the growth of inherited intestinal polyps in an animal model. World J Gastroenterol 2020; 26(14): 1601-1612
- URL: https://www.wjgnet.com/1007-9327/full/v26/i14/1601.htm
- DOI: https://dx.doi.org/10.3748/wjg.v26.i14.1601


