Copyright
©The Author(s) 2019.
World J Gastroenterol. Nov 14, 2019; 25(42): 6299-6310
Published online Nov 14, 2019. doi: 10.3748/wjg.v25.i42.6299
Published online Nov 14, 2019. doi: 10.3748/wjg.v25.i42.6299
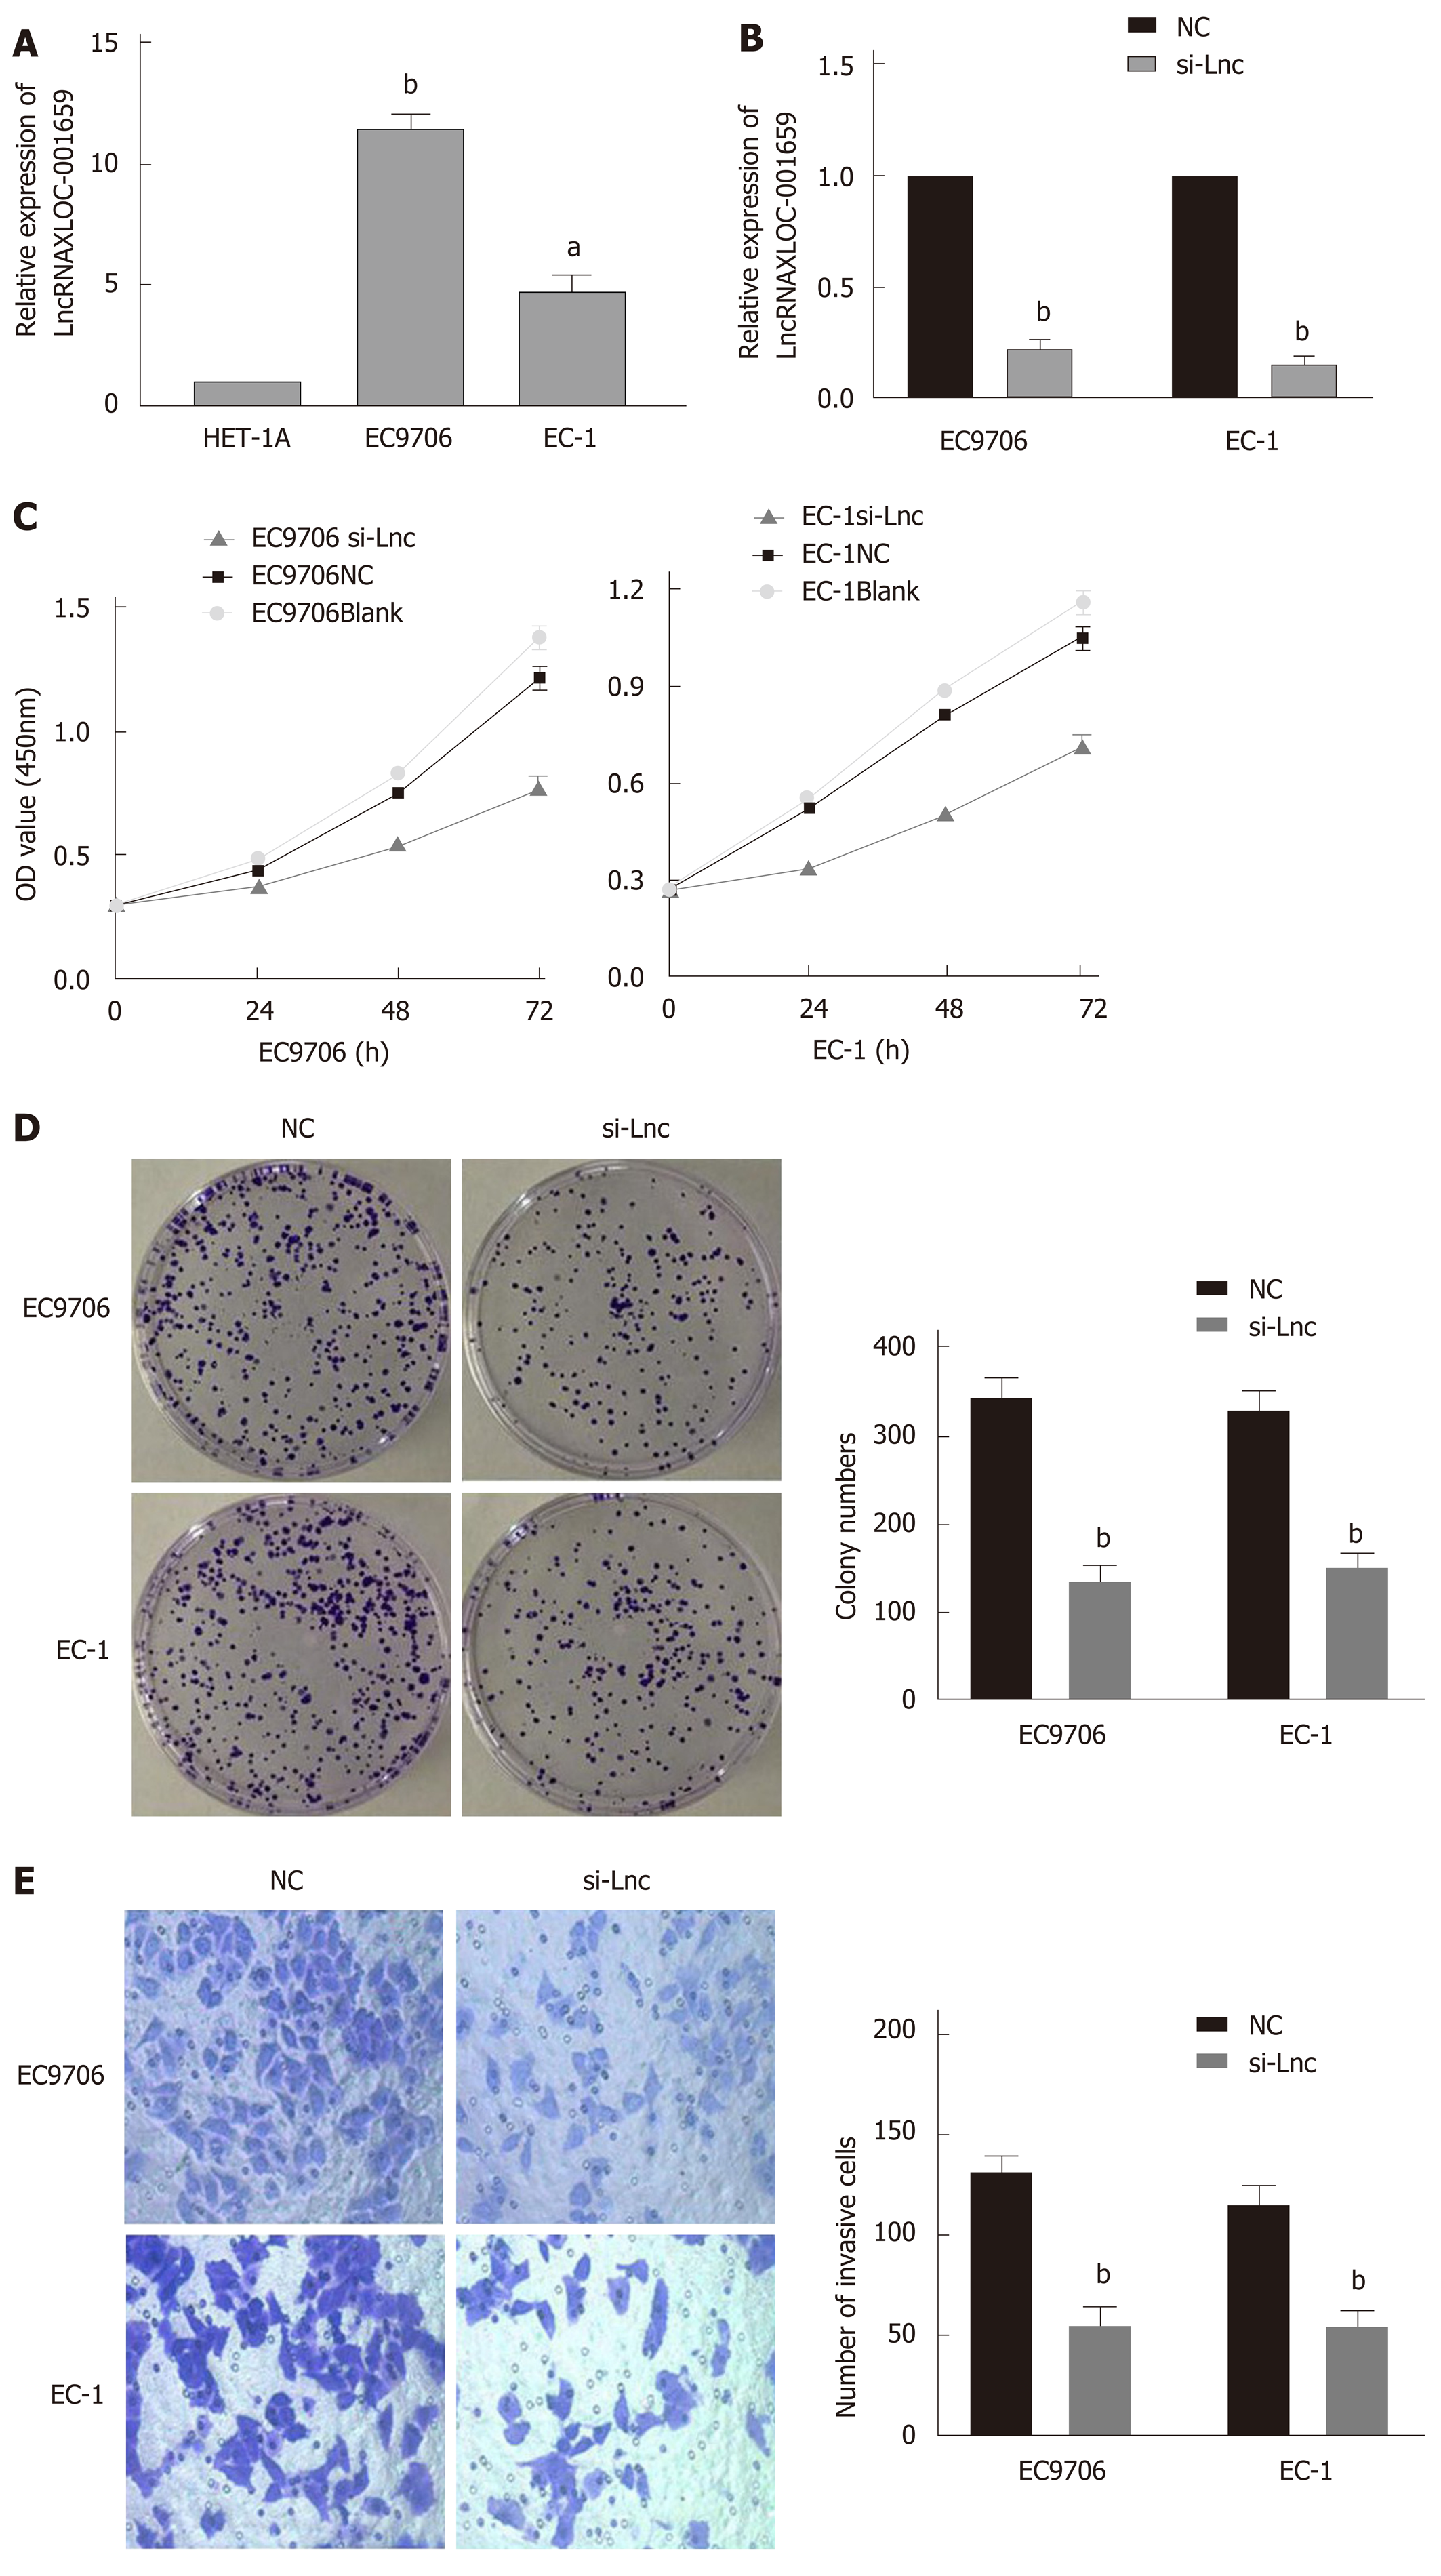
Figure 1 Knockdown of lncRNAXLOC_001659 inhibits the growth and invasion of esophageal squamous cell carcinoma cells.
A: LncRNA XLOC_001659 expression in normal esophageal epithelial cells (HET-1A) and esophageal squamous cell carcinoma cells (EC9706 and EC-1). The results are presented as the mean ± standard deviation from three independent experiments. aP < 0.05 and bP < 0.01, Student’s t-test; B: LncRNAXLOC_001659 expression in EC9706 and EC-1 cells transfected with si-Lnc was significantly lower than that in the cells of the NC group. bP < 0.01; C: CCK-8 assay showed that the proliferation ability of EC9706 and EC-1 cells in the si-Lnc group was significantly lower than in the corresponding NC and blank control groups; D: Colony formation assay showed that EC9706 and EC-1 cells transfected with si-Lnc had a significantly lower proliferation ability than the NC group. bP < 0.01; E: EC9706 and EC-1 cells in the si-Lnc groups had significantly fewer invasive cells detected in the Transwell invasion assay than the corresponding NC groups. bP < 0.01.
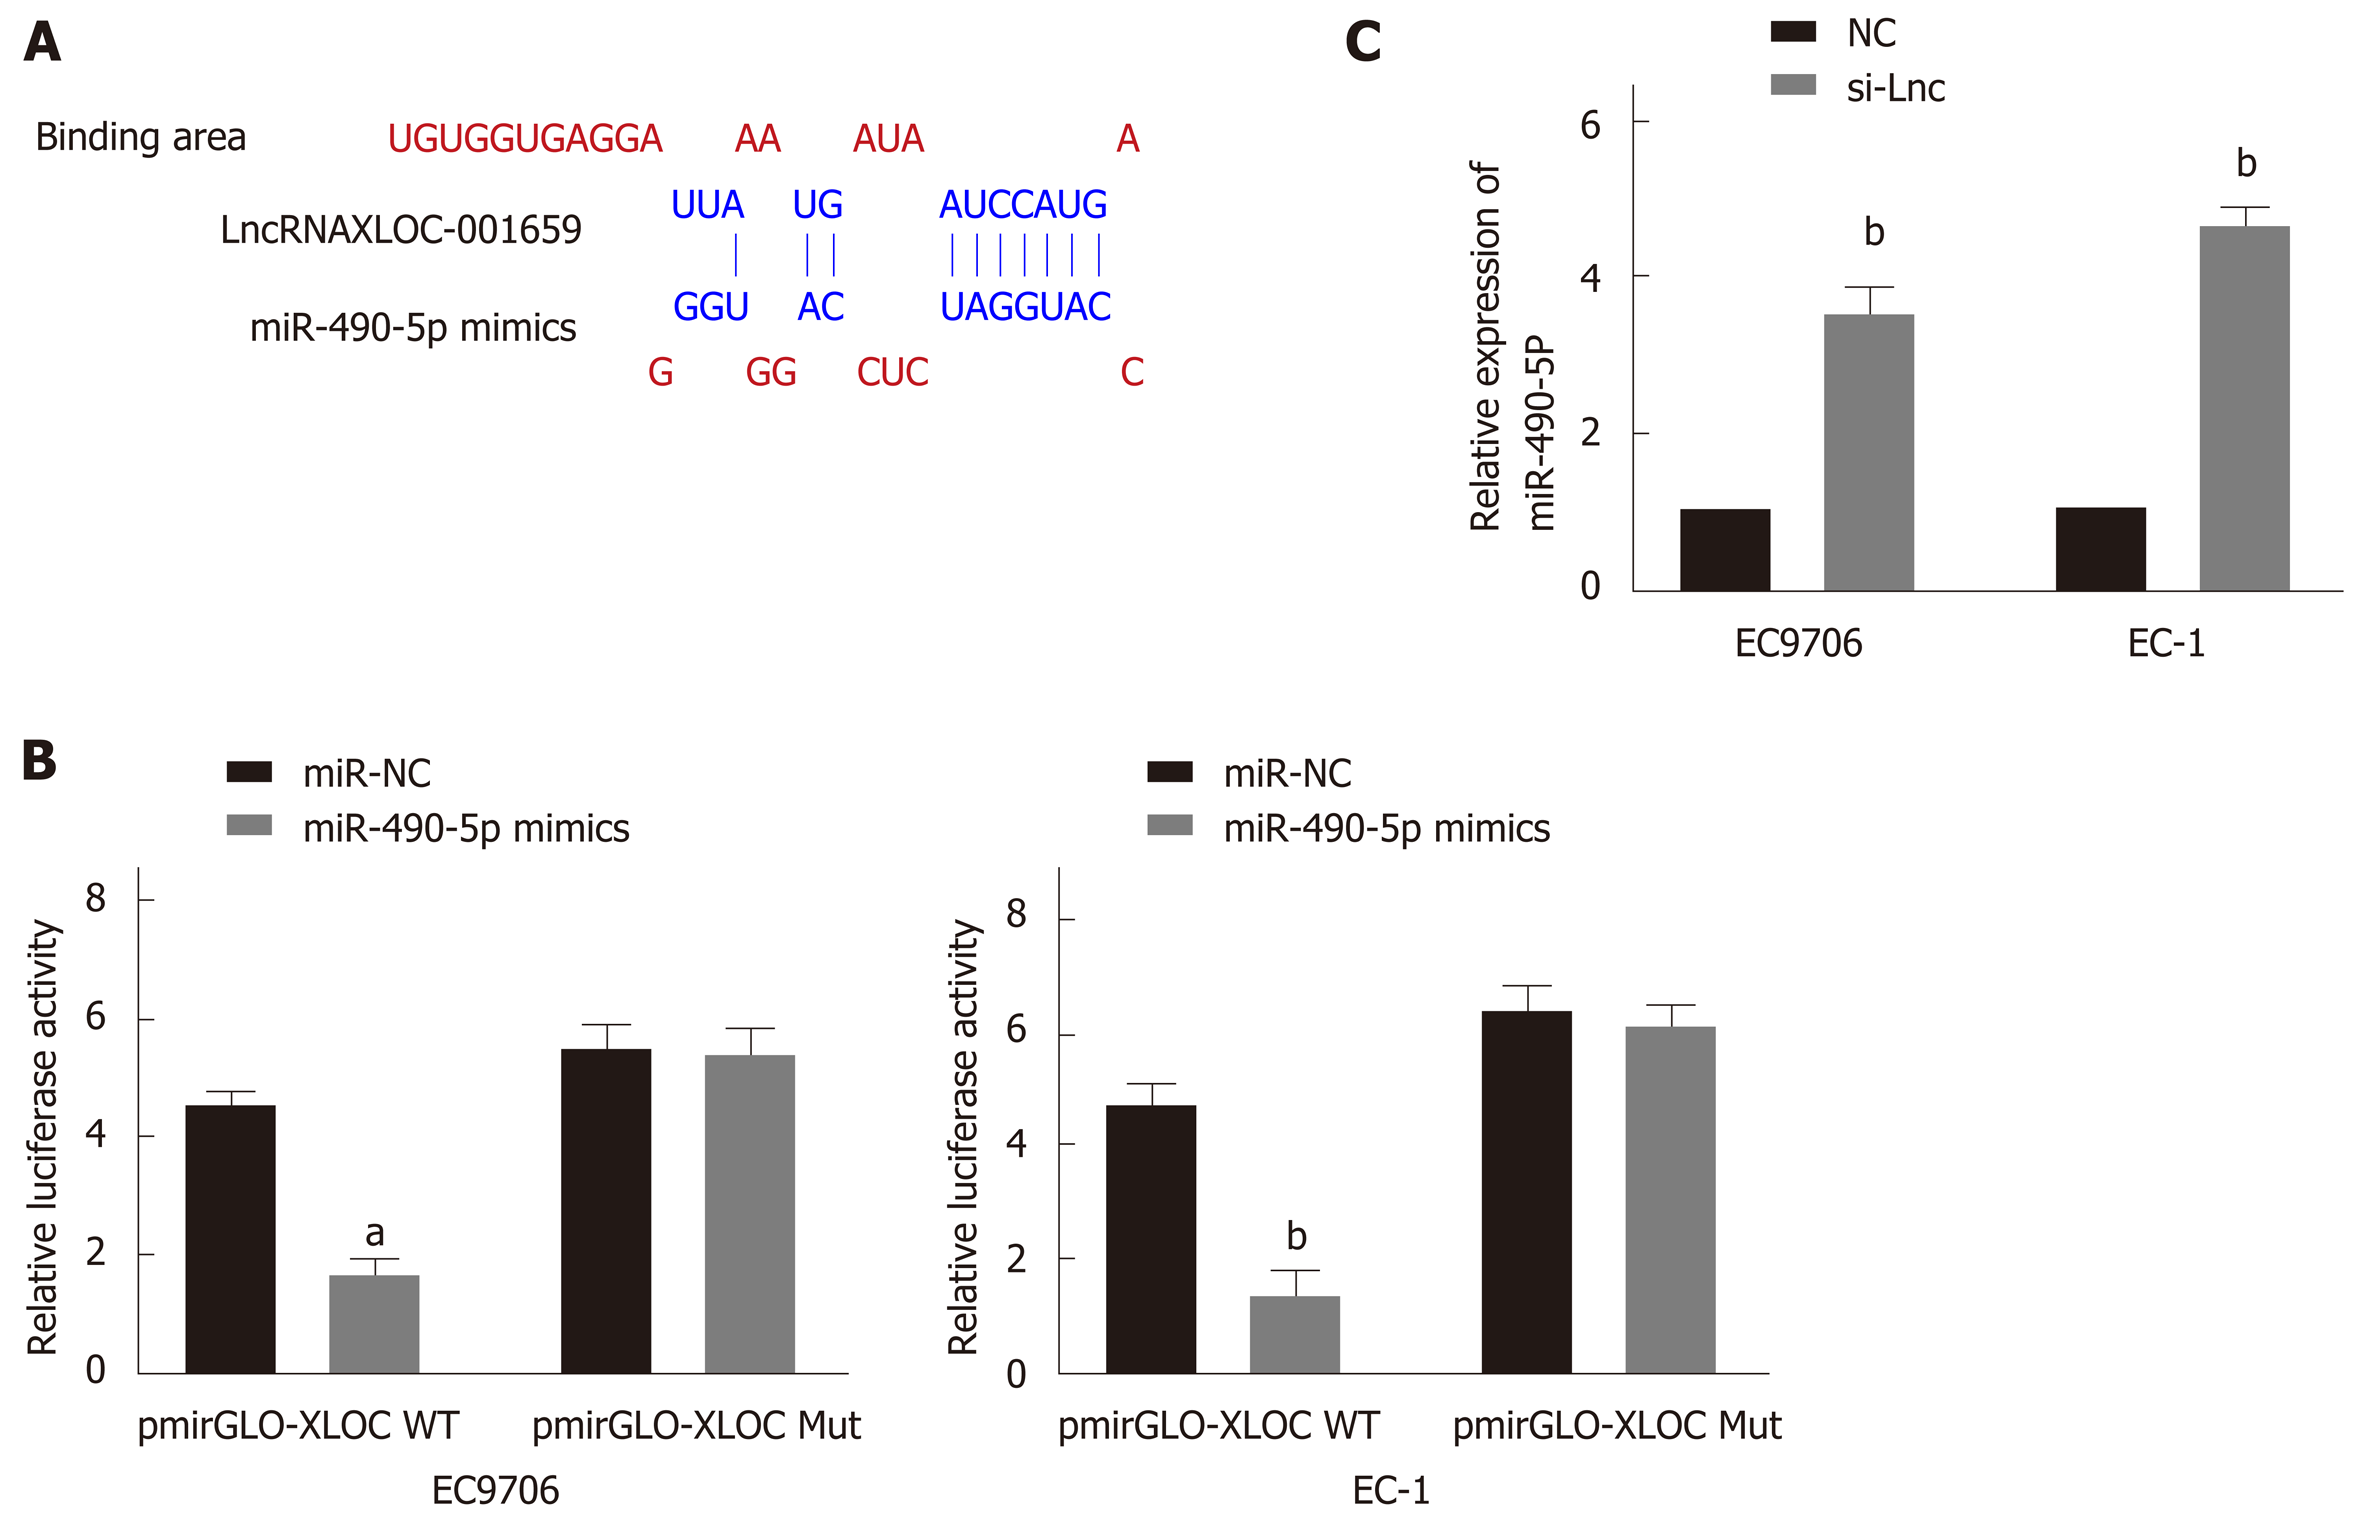
Figure 2 lncRNAXLOC_001659 downregulates miR-490-5p expression by binding to the miR-490-5p seed region.
A: Bioinformatics analysis showed the binding between lncRNA XLOC_001659 and miR-490-5p seed region; B: Relative luciferase activities of the EC9706 and EC-1 cells co-transfected with lncRNAXLOC_001659-WT or lncRNAXLOC_001659-Mut luciferase reporter vector and miR-NC or MiR-490-5p mimics. aP < 0.05 and bP < 0.01; C: RT-qPCR demonstrated a significant increase in relative miR-490-5p expression in the EC9706 and EC-1 cells after si-Lnc transfection. bP < 0.01.
Figure 3 MiR-490-5p overexpression and knockdown of lncRNAXLOC_001659 inhibit the proliferation and invasion of esophageal squamous cell carcinoma cells.
A: RT-qPCR showed significant more miR-490-5p expression in the EC9706 and EC-1 cells transfected with miR-490-5p mimics than in the corresponding miR-NC groups. aP < 0.05 and bP < 0.01; B: Colony formation assay showed the changes in colony formation in the EC9706 and EC-1 cells with knockdown of lncXLOC_001659 and overexpression of miR-490-5p, compared with the corresponding NC groups. bP < 0.01; C: Transwell invasion assay showed the changes in the invasive cell count in the EC9706 and EC-1 cells with knockdown of lncXLOC_001659 and overexpression of miR-490-5p, compared with the corresponding NC groups. aP < 0.05 and bP < 0.01.
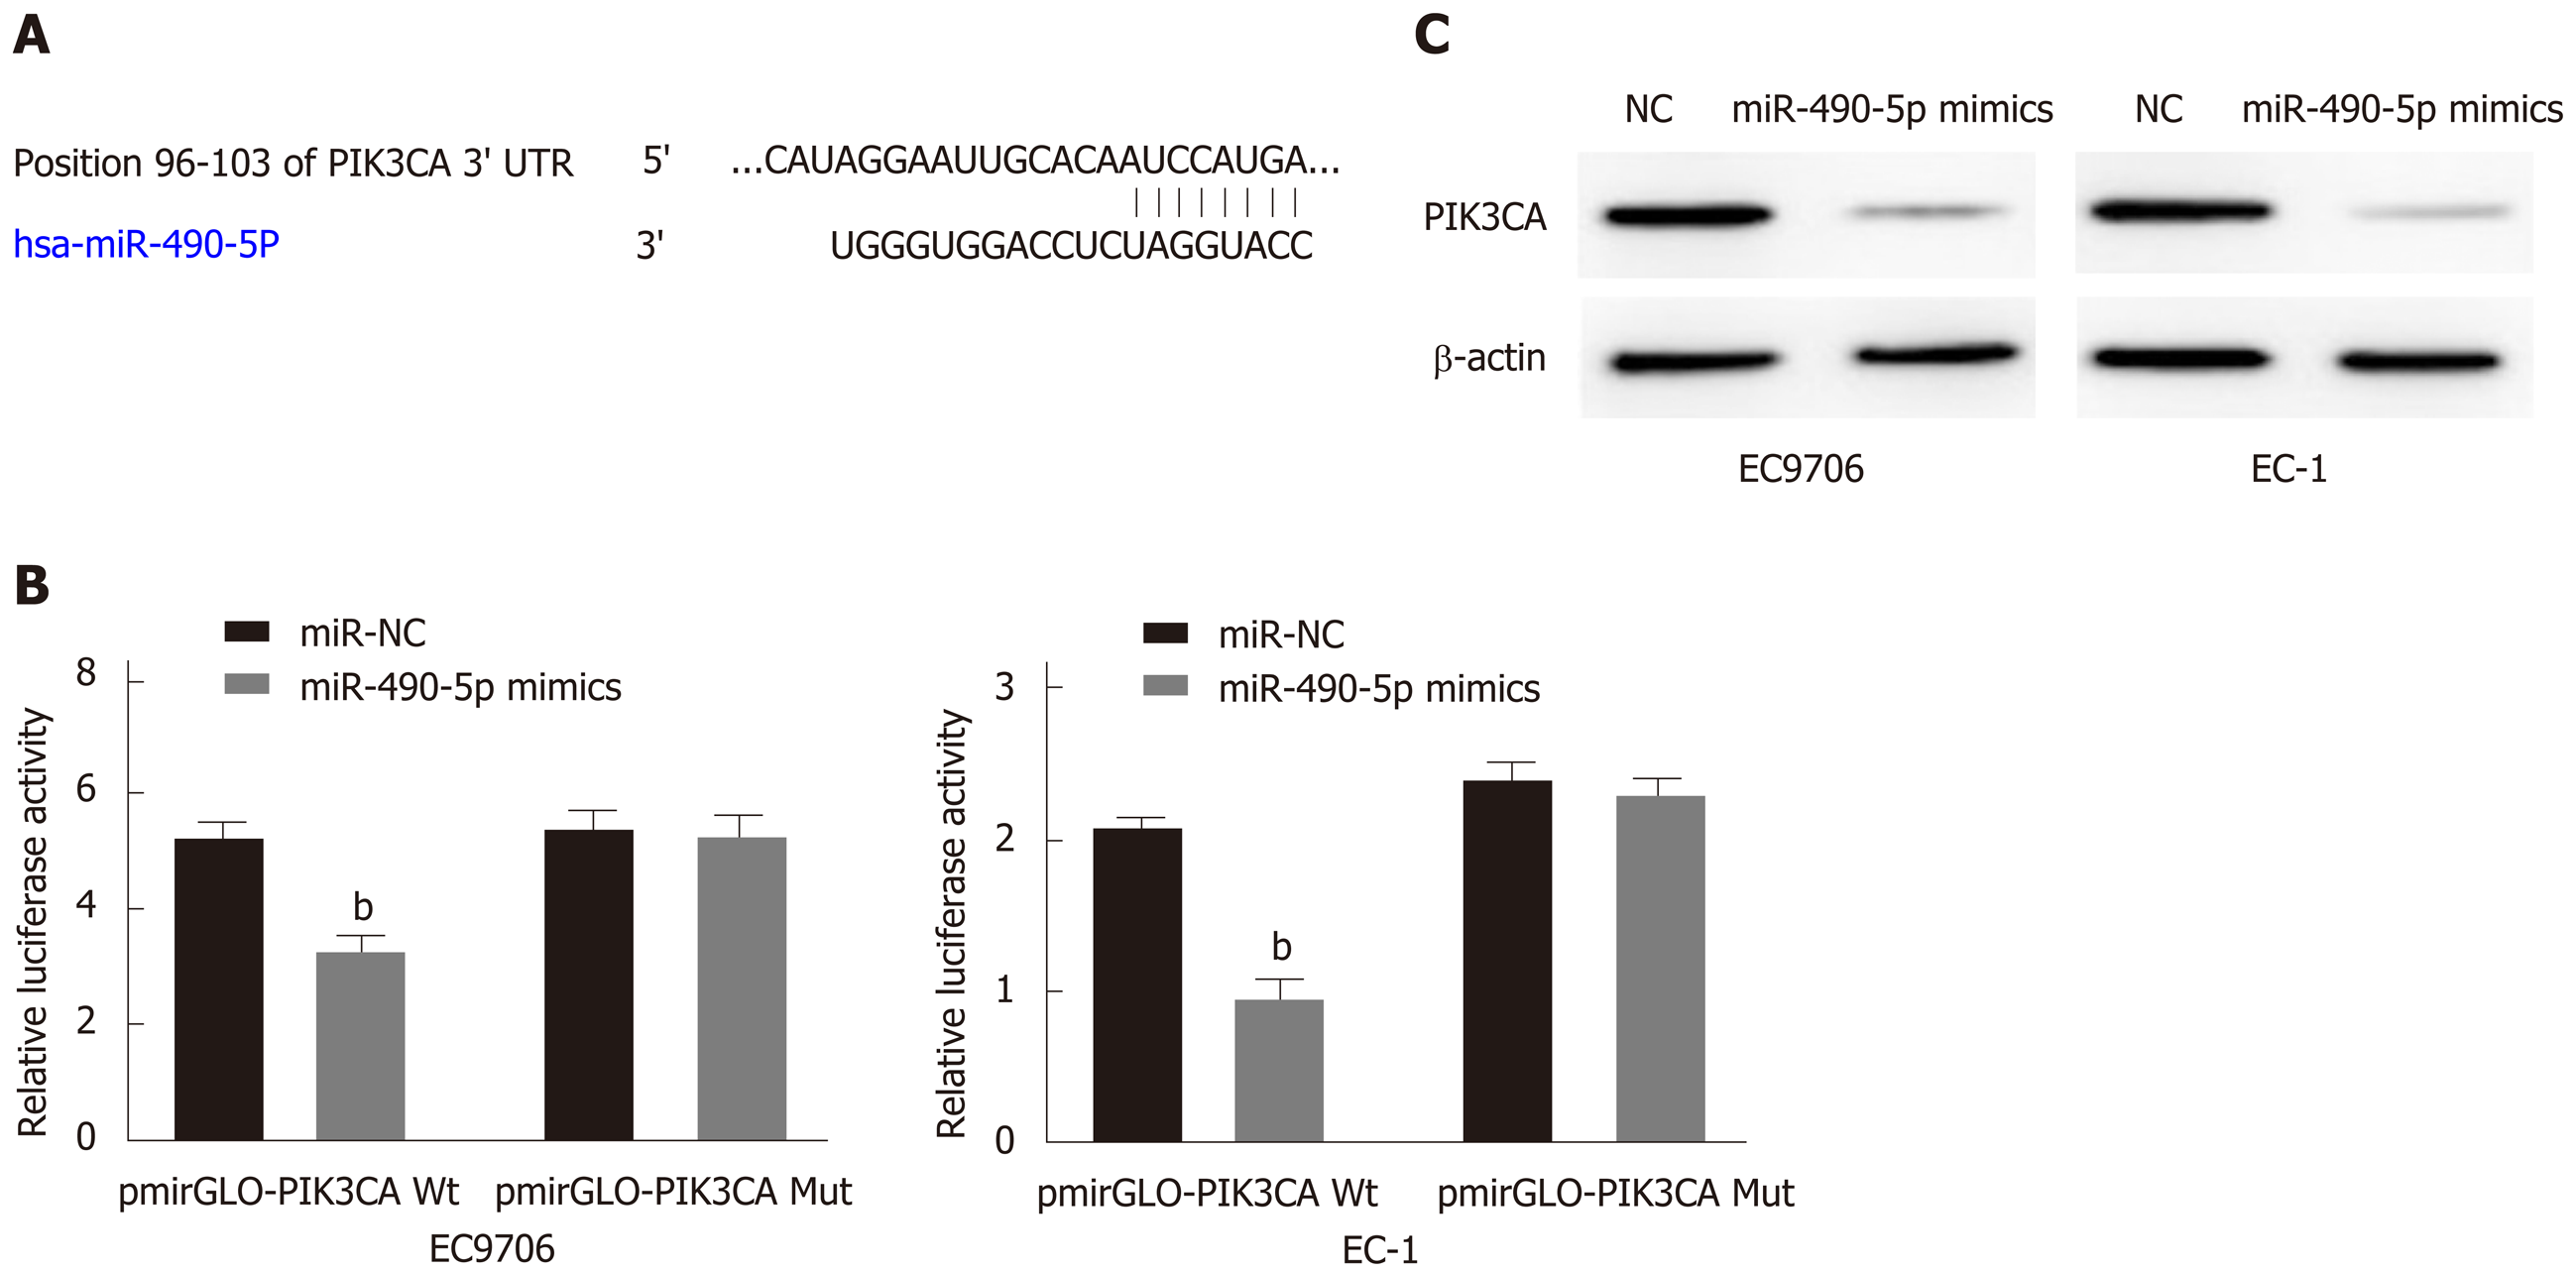
Figure 4 PIK3CA is the target gene of miR-490-5p.
A: Bioinformatics analysis demonstrated the binding region between miR-490-5p and PIK3CA; B: Relative luciferase activities of the EC9706 and EC-1 cells co-transfected with PIK3CA-WT or PIK3CA-Mut luciferase reporter vector and miR-NC or MiR-490-5p mimics. bP < 0.01; C: MiR-490-5p overexpression inhibited the PIK3CA protein expression in the EC9706 and EC-1 cells.
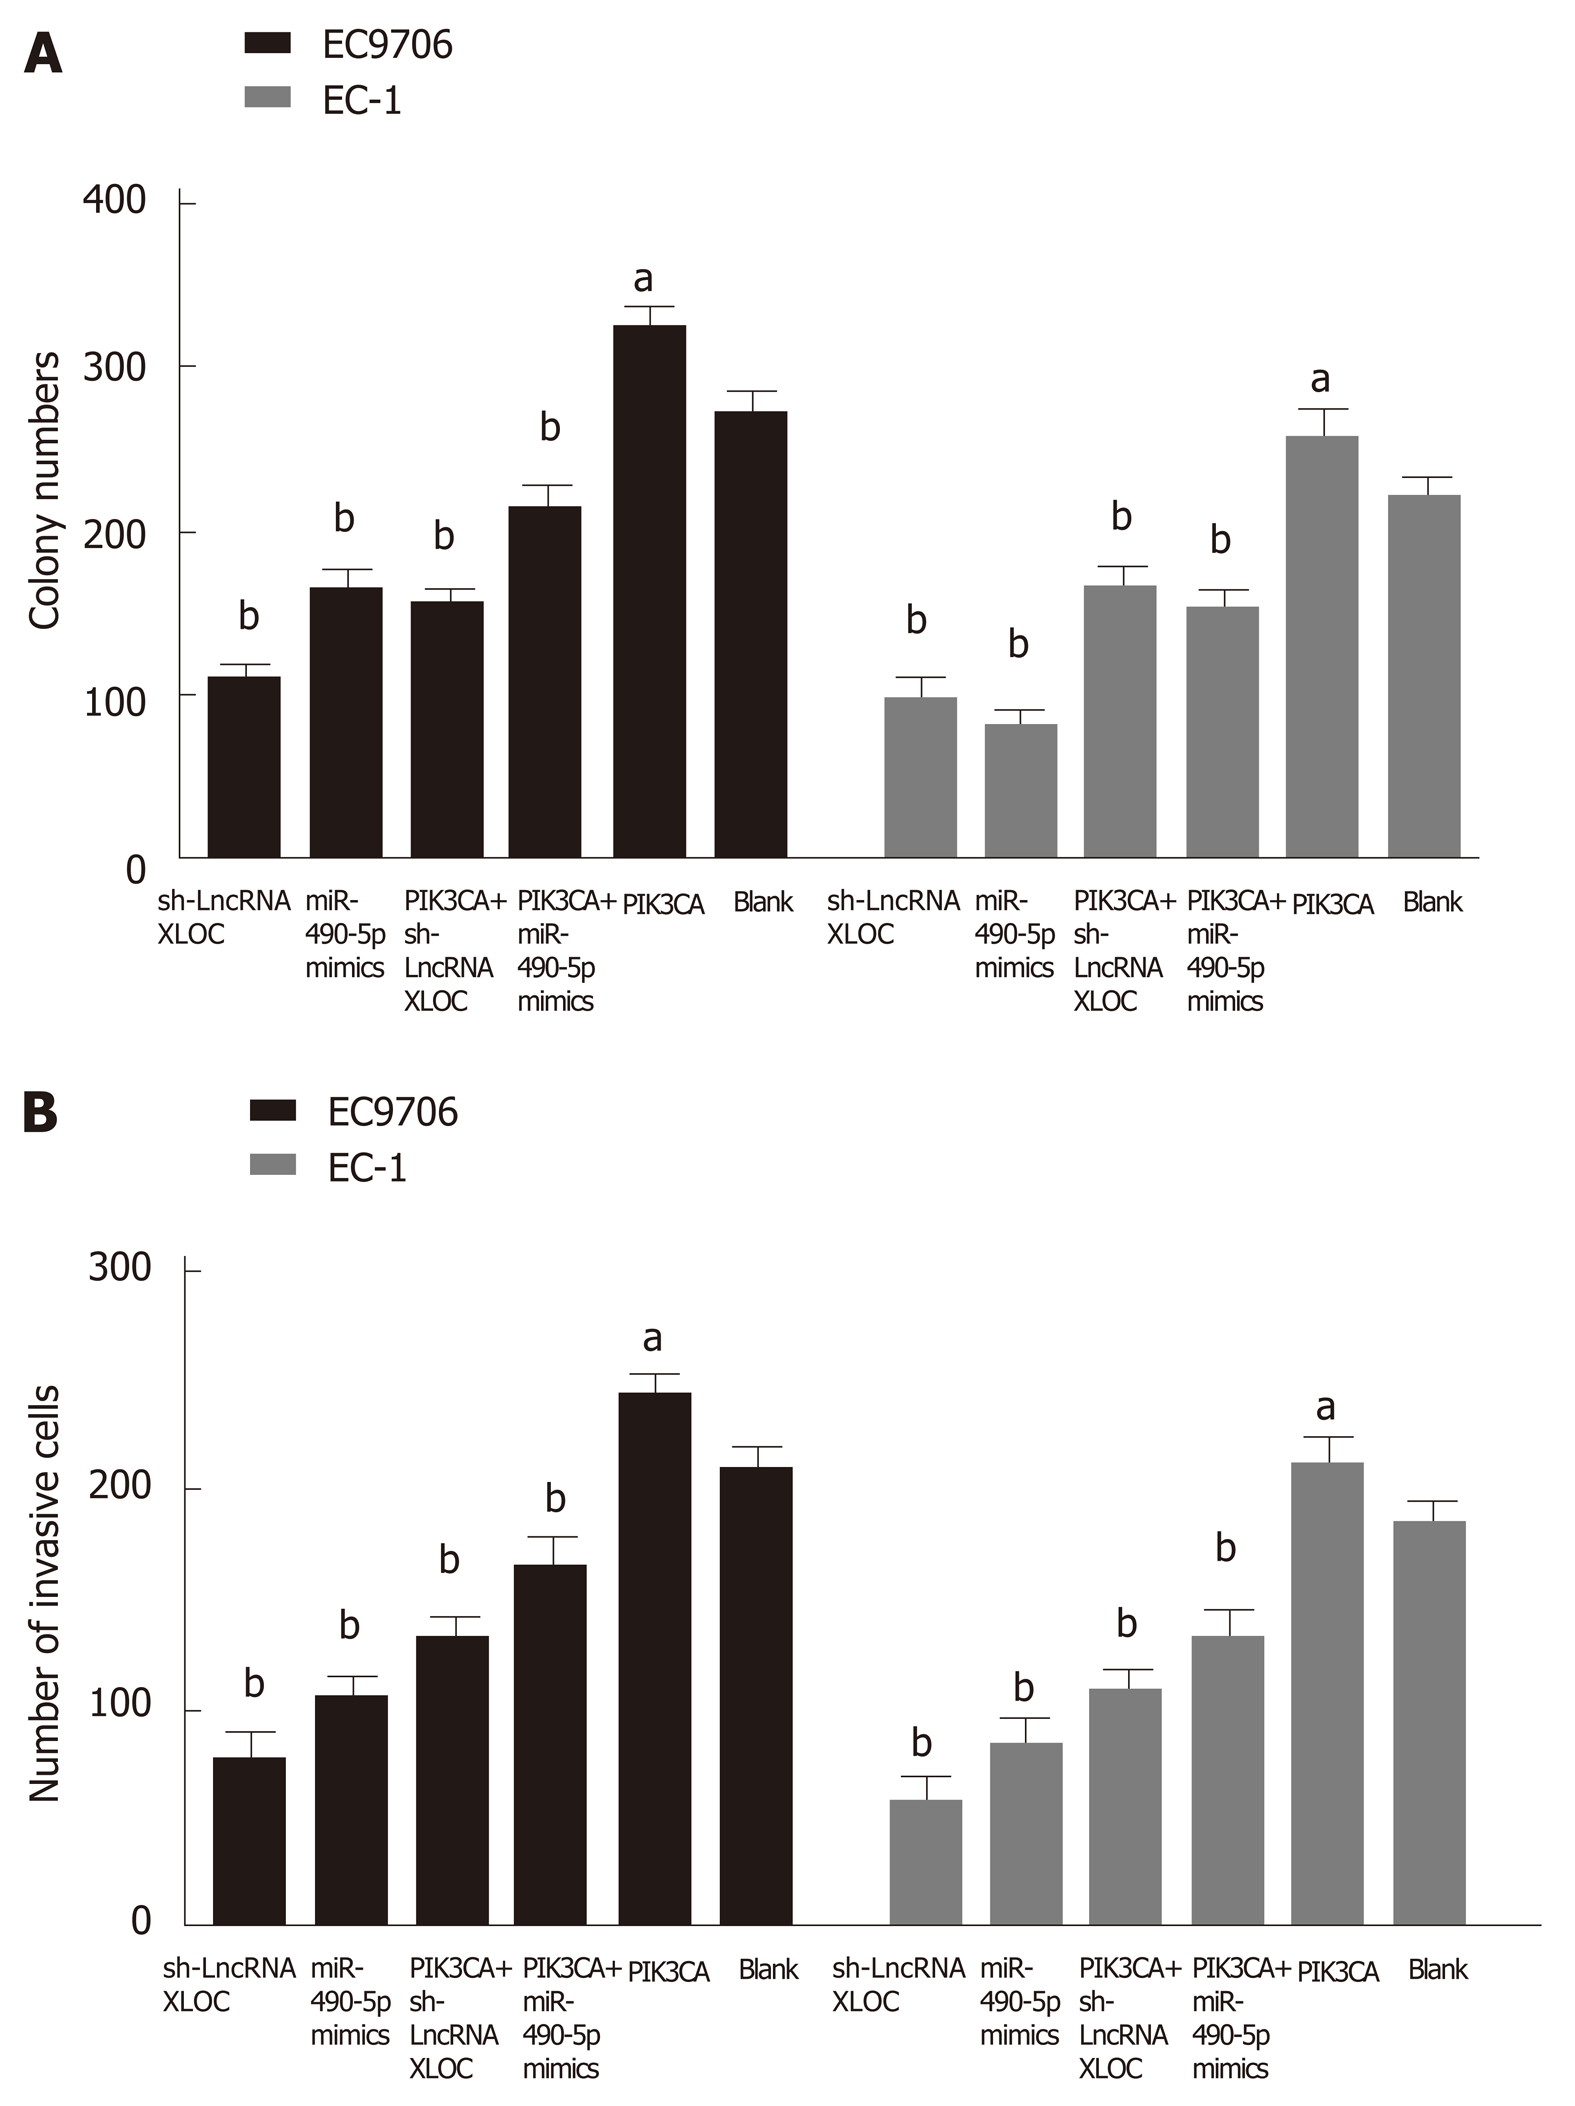
Figure 5 PIK3CA overexpression partially rescues the inhibition of esophageal squamous cell carcinoma cell growth and invasion mediated by the lncRNAXLOC_001659 knockdown and miR-490-5p overexpression.
A: Colony formation as determined by colony formation assay. aP < 0.05 and bP < 0.01; B: Number of invasive cells detected using Transwell invasion assay. aP < 0.05 and bP < 0.01. The results are presented as the mean ± standard deviation from three independent experiments.
- Citation: Li FZ, Zang WQ. Knockdown of lncRNAXLOC_001659 inhibits proliferation and invasion of esophageal squamous cell carcinoma cells. World J Gastroenterol 2019; 25(42): 6299-6310
- URL: https://www.wjgnet.com/1007-9327/full/v25/i42/6299.htm
- DOI: https://dx.doi.org/10.3748/wjg.v25.i42.6299


