Copyright
©The Author(s) 2019.
World J Gastroenterol. Oct 14, 2019; 25(38): 5800-5813
Published online Oct 14, 2019. doi: 10.3748/wjg.v25.i38.5800
Published online Oct 14, 2019. doi: 10.3748/wjg.v25.i38.5800
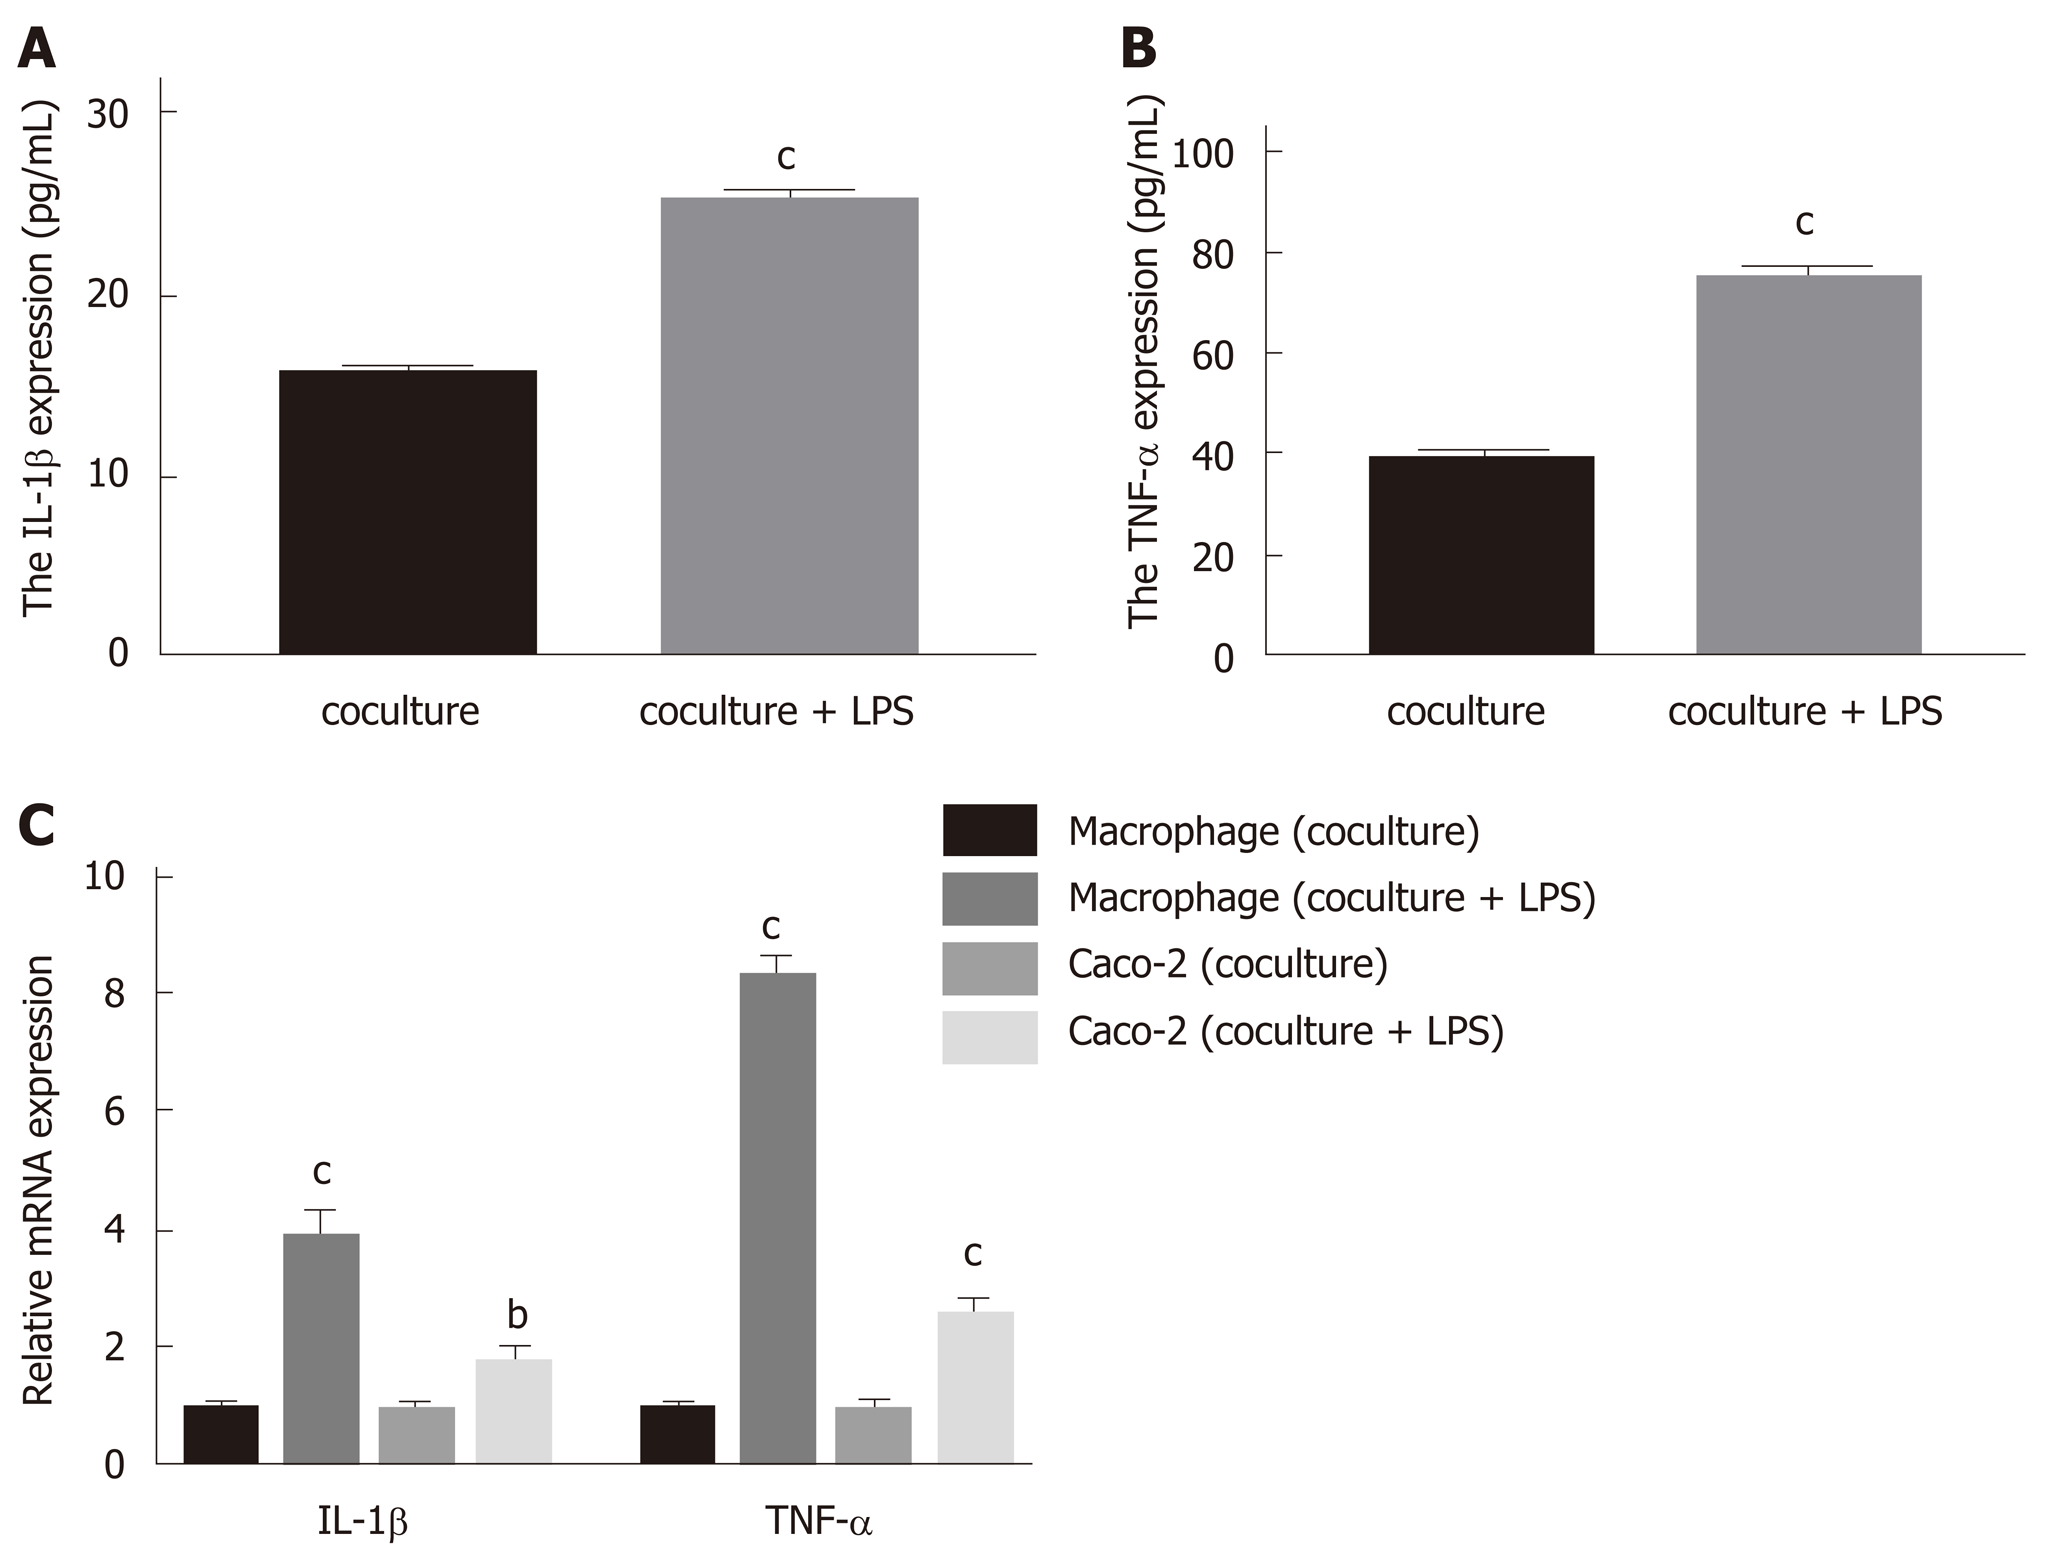
Figure 1 Establishment of a coculture model in vitro.
A: The levels of secreted IL-1β in the upper chamber supernatants were detected by ELISA; B: The levels of secreted TNF-α in the upper chamber supernatants were detected by ELISA; C: The mRNA expression levels of IL-1β and TNF-α in macrophage-like THP-1 cells and Caco-2 cells were tested by quantitative real-time PCR. Data are presented as the mean ± SD. bP < 0.01 vs coculture; cP < 0.001 vs coculture. LPS: Lipopolysaccharide; IL-1β: Interleukin-1β; TNF-α: Tumor necrosis factor-α; ELISA: Enzyme-linked immunosorbent assay; PCR: Polymerase chain reaction.
Figure 2 Sirtuin 1 activation enhances tight junctions in Caco-2 monolayers.
The protein levels of occludin and ZO-1 in Caco-2 monolayers were examined after administration of the drug for 24 h, 48 h, or 72 h. UC: Ulcerative colitis; NAM: Nicotinamide; ZO-1: Zona occludens 1.
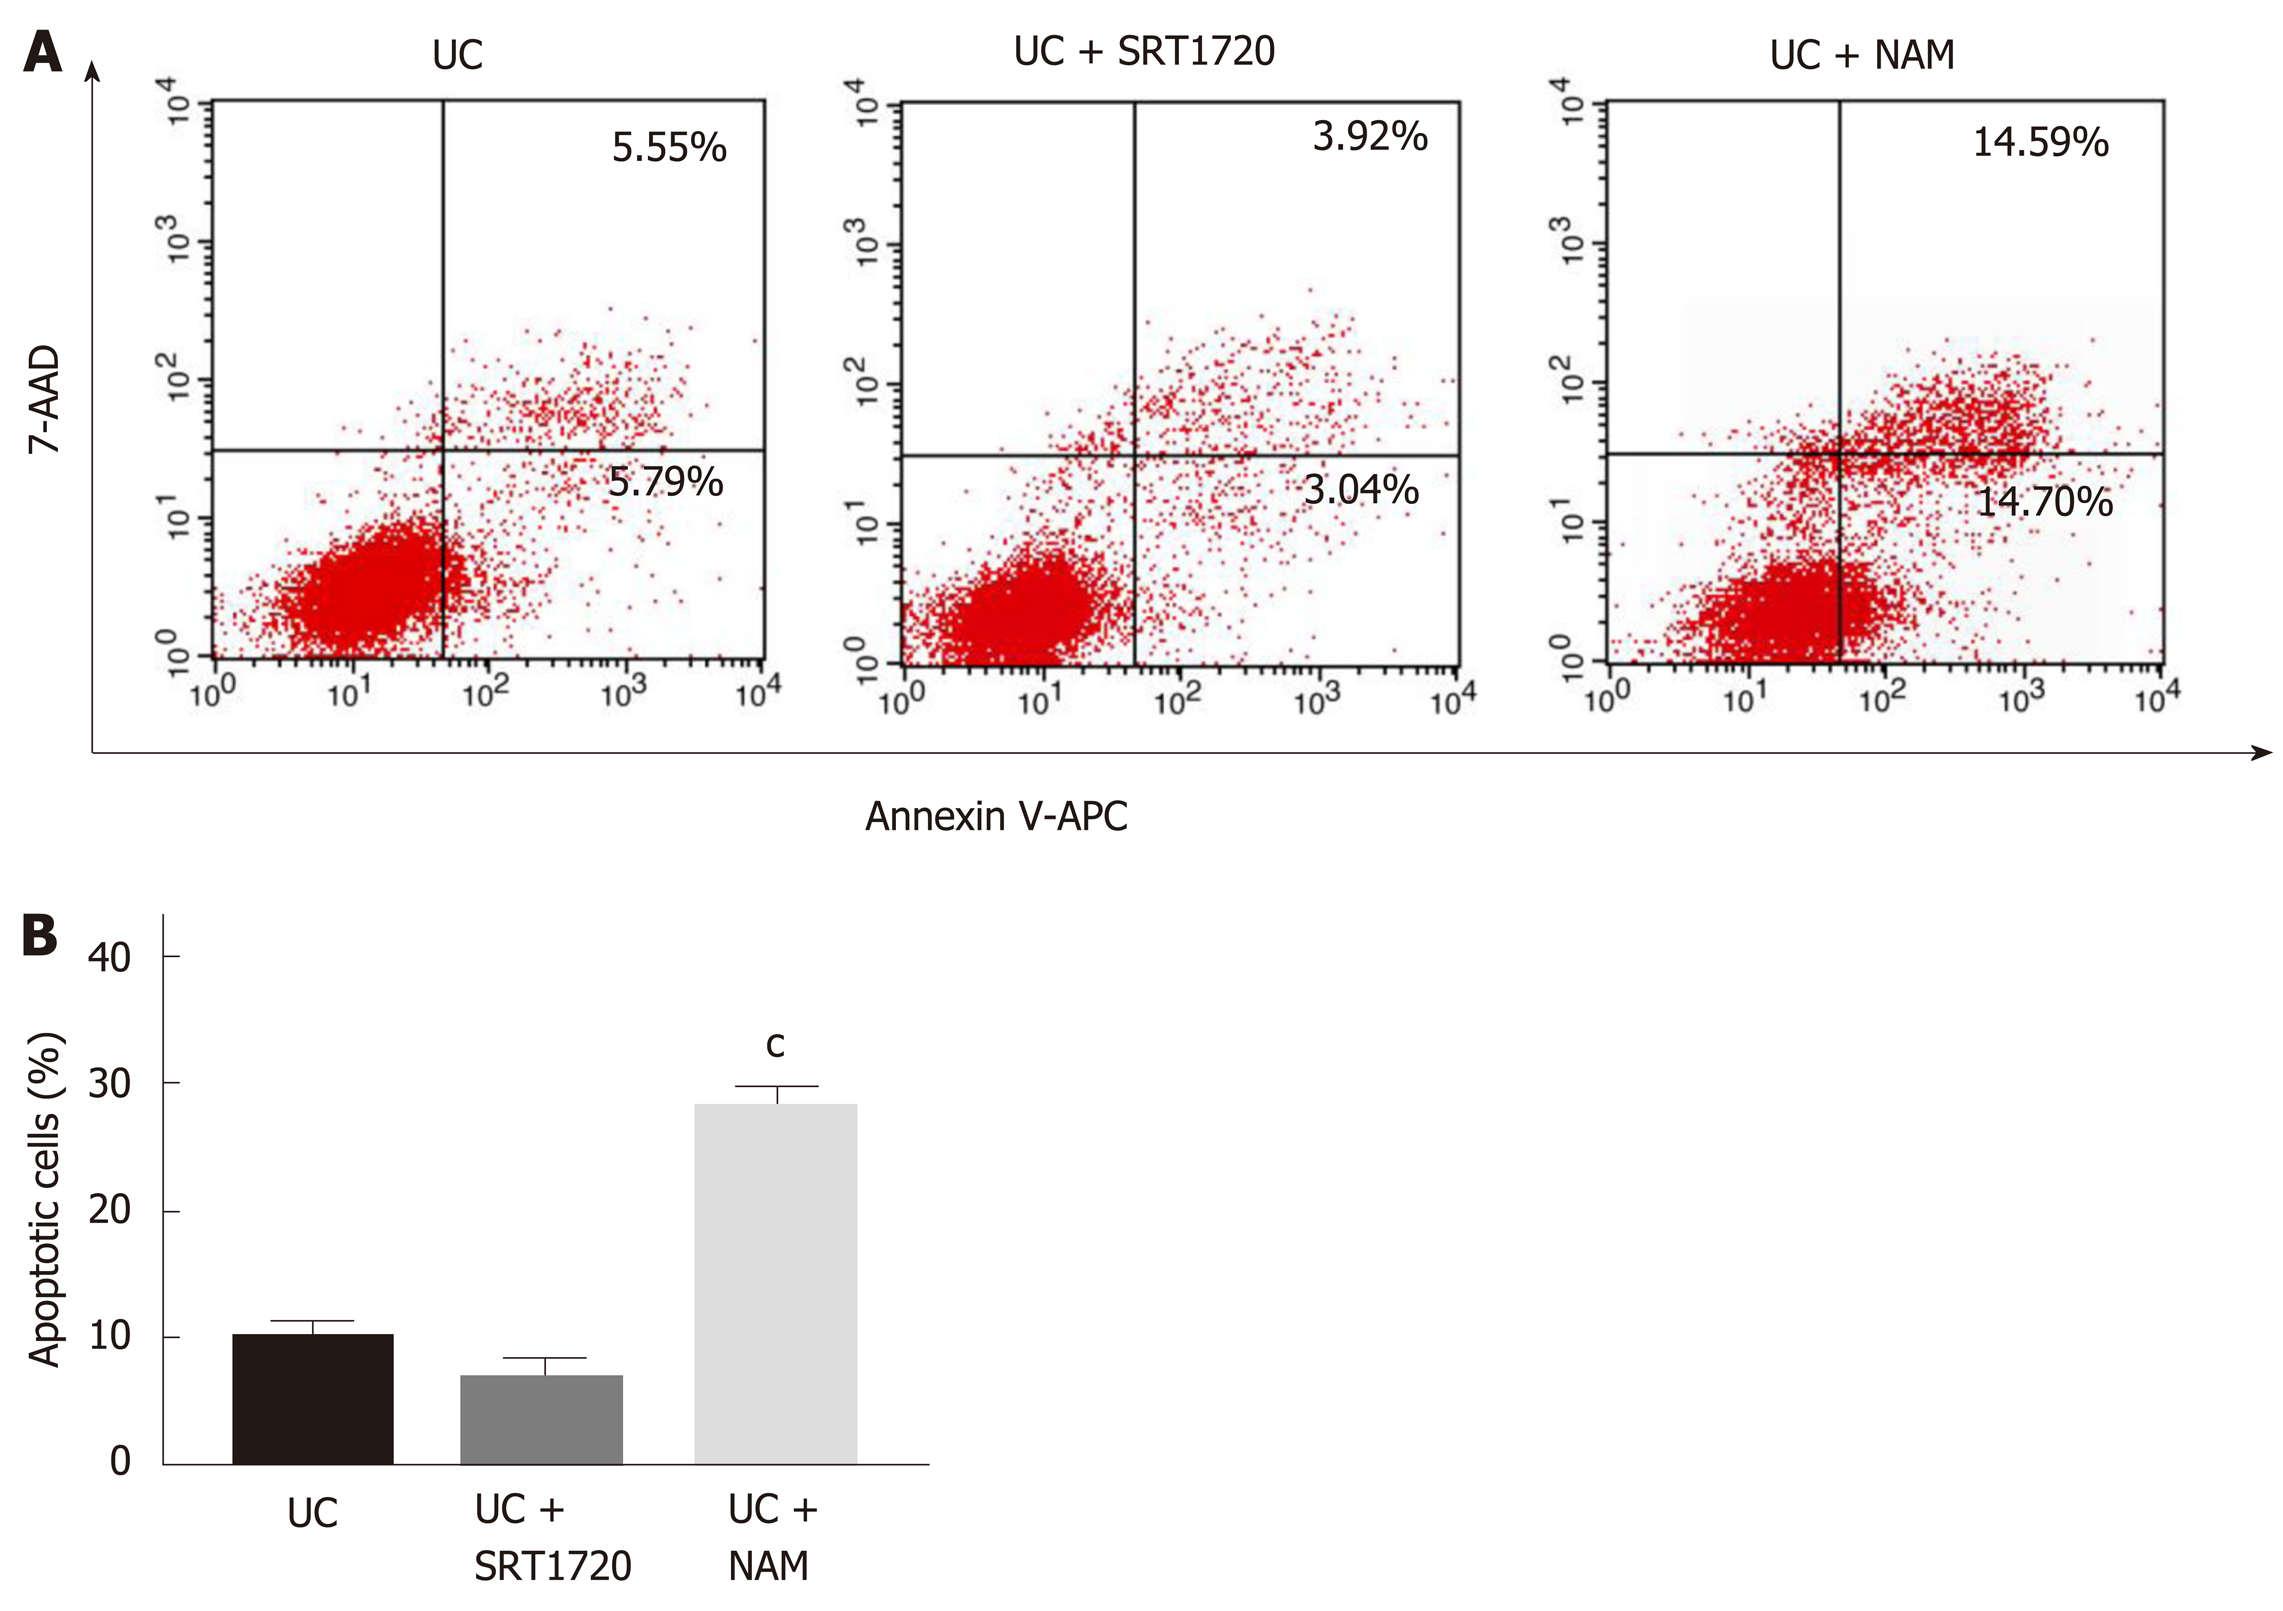
Figure 3 Sirtuin 1 inhibits Caco-2 apoptosis.
A: Cells in the upper-right (UR) portion are late apoptotic cells, whereas cells in the lower-left and lower-right (LR) portions are viable and early apoptotic cells, respectively; B: Apoptotic rate (UR + LR) of Caco-2 cells. Each value is presented as the mean ± SD. cP < 0.001 vs UC. UC: Ulcerative colitis; NAM: Nicotinamide.
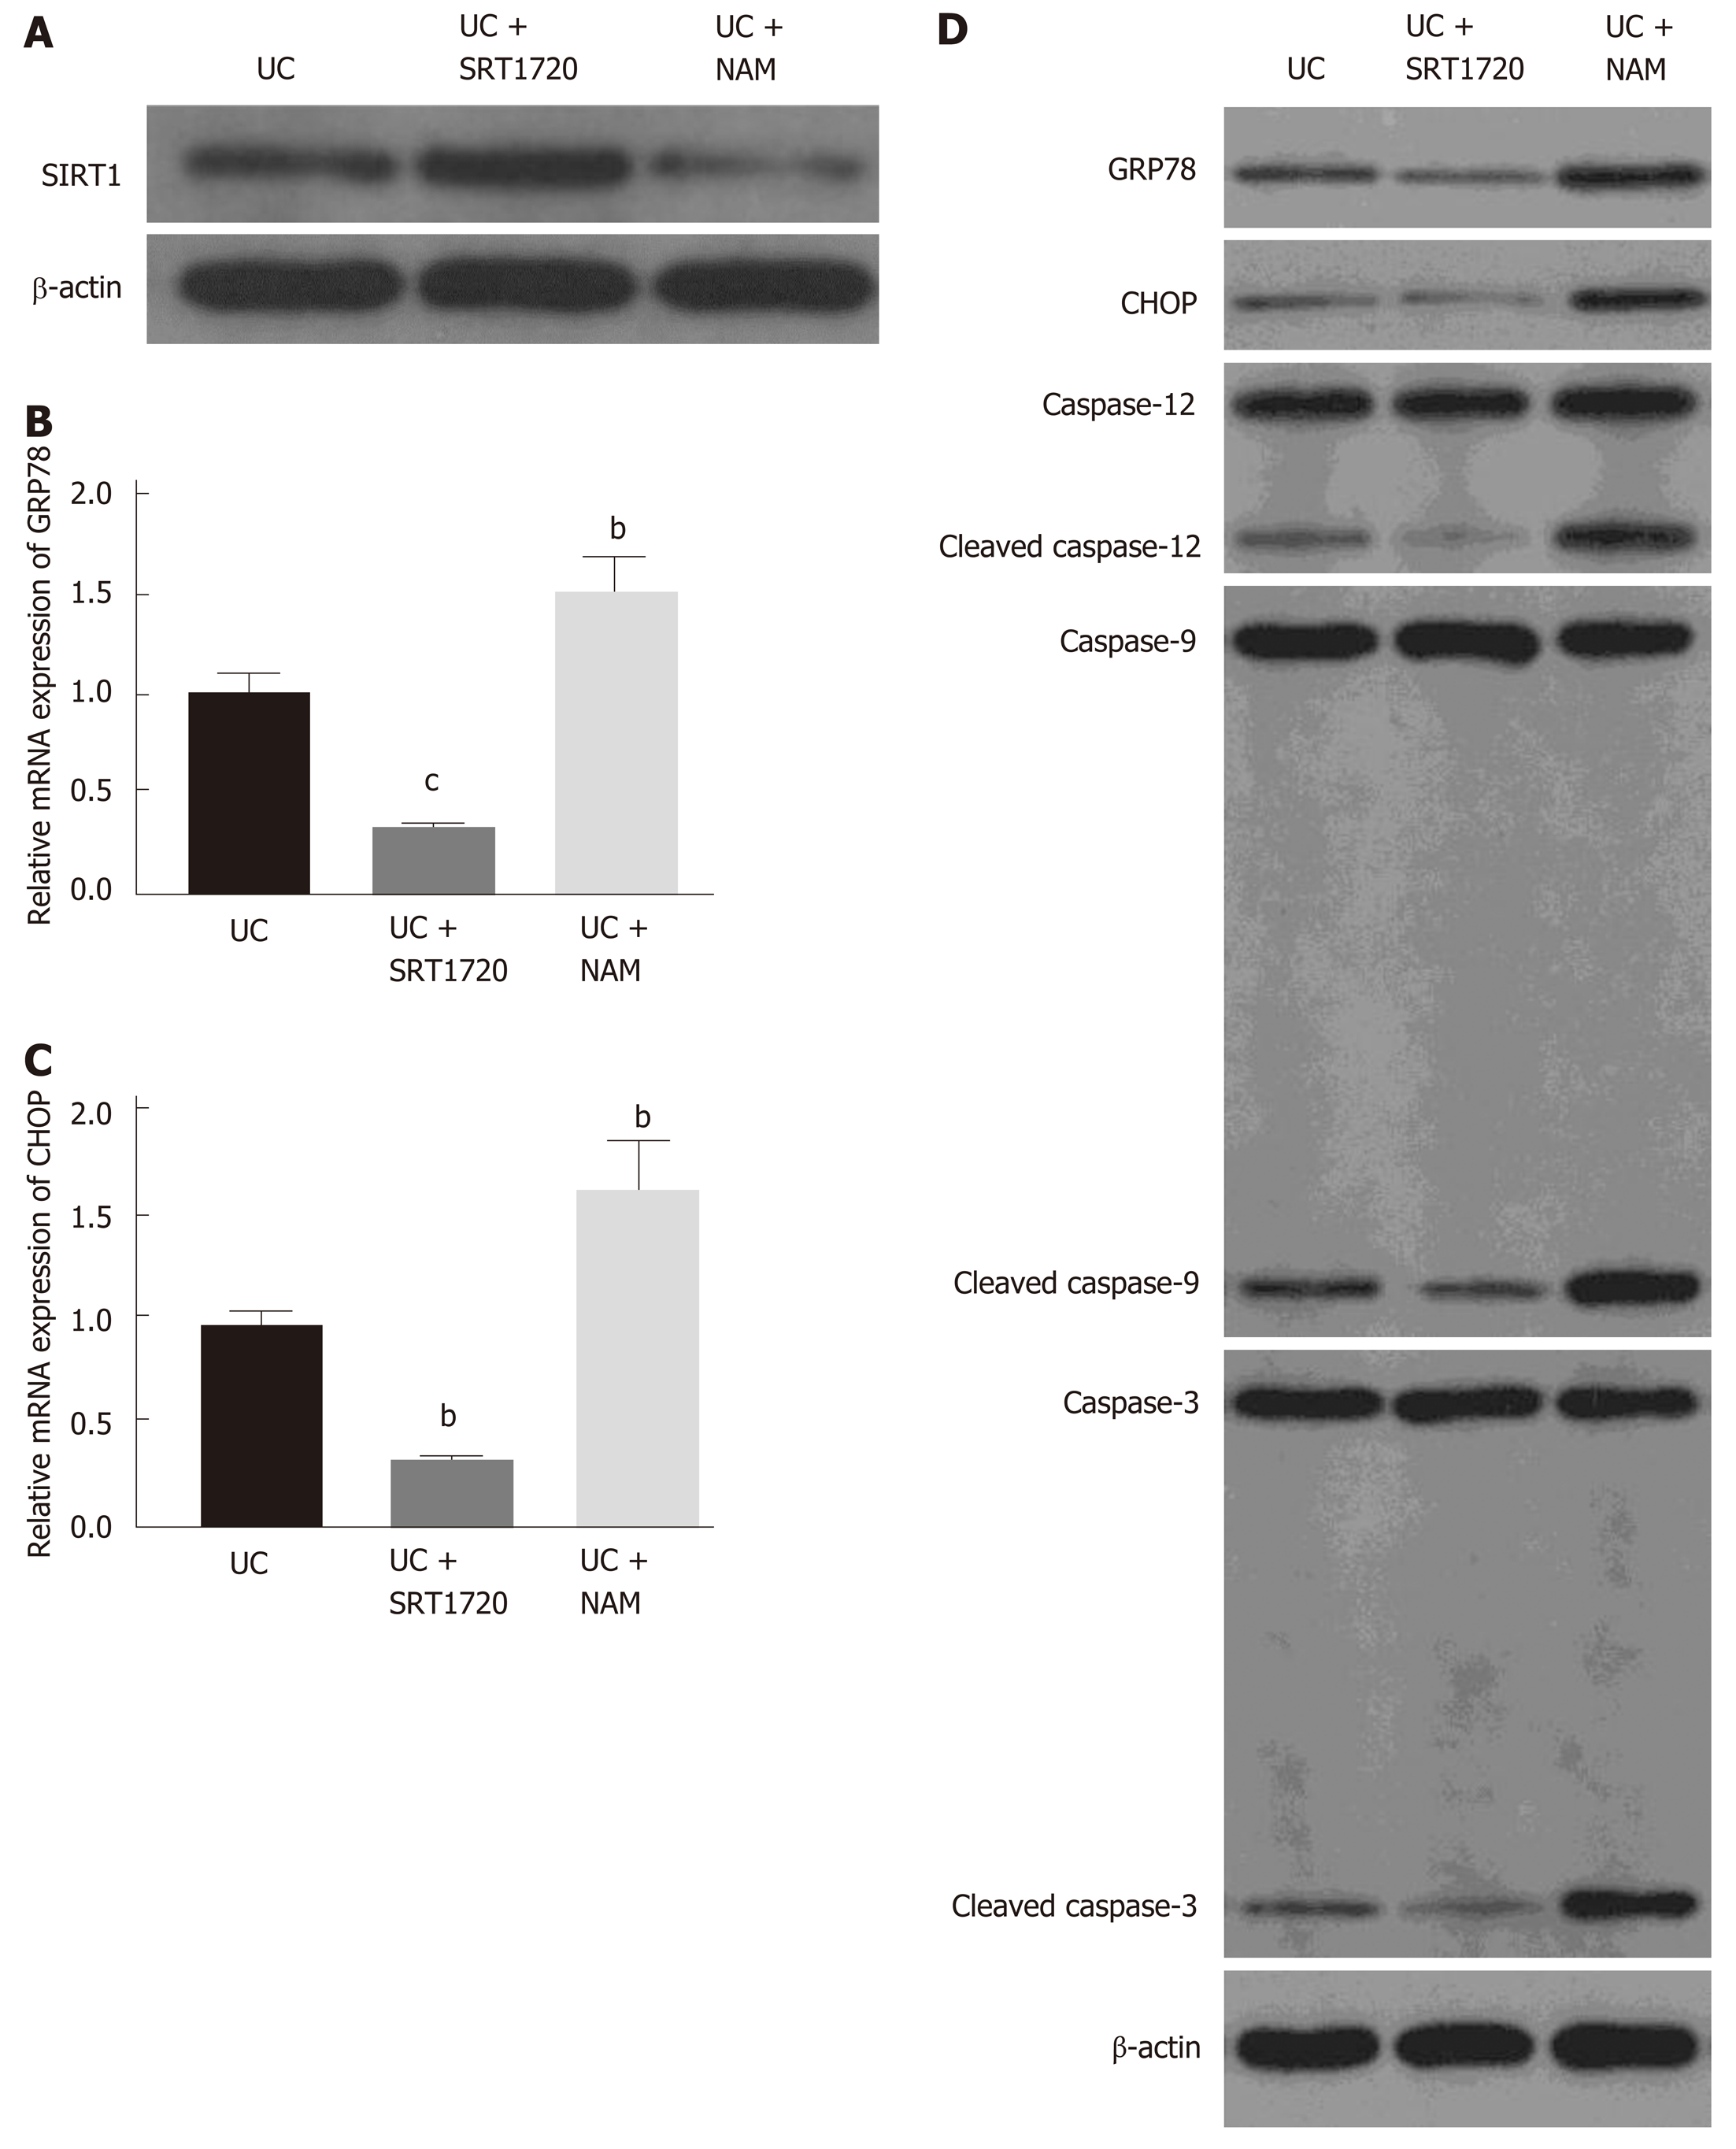
Figure 4 Sirtuin 1 negatively regulates endoplasmic reticulum stress-mediated apoptotic pathways in Caco-2 monolayers.
A: The protein levels of SIRT1 in Caco-2 cells were detected by Western blot; B: The mRNA levels of GRP78 in Caco-2 cells were tested by quantitative real-time PCR; C: The mRNA levels of CHOP in Caco-2 cells were tested by quantitative real-time PCR; D: The protein levels of GRP78, CHOP, caspase 12, caspase 9, and caspase 3 were detected by Western blot in Caco-2 cells. Data are presented as the mean ± SD. bP < 0.01 vs UC; cP < 0.001 vs UC. UC: Ulcerative colitis; NAM: Nicotinamide; PCR: Polymerase chain reaction; GRP78: Glucose-regulated protein 78; CHOP: CCAAT/enhancer-binding protein homologous protein; SIRT1: Sirtuin 1.
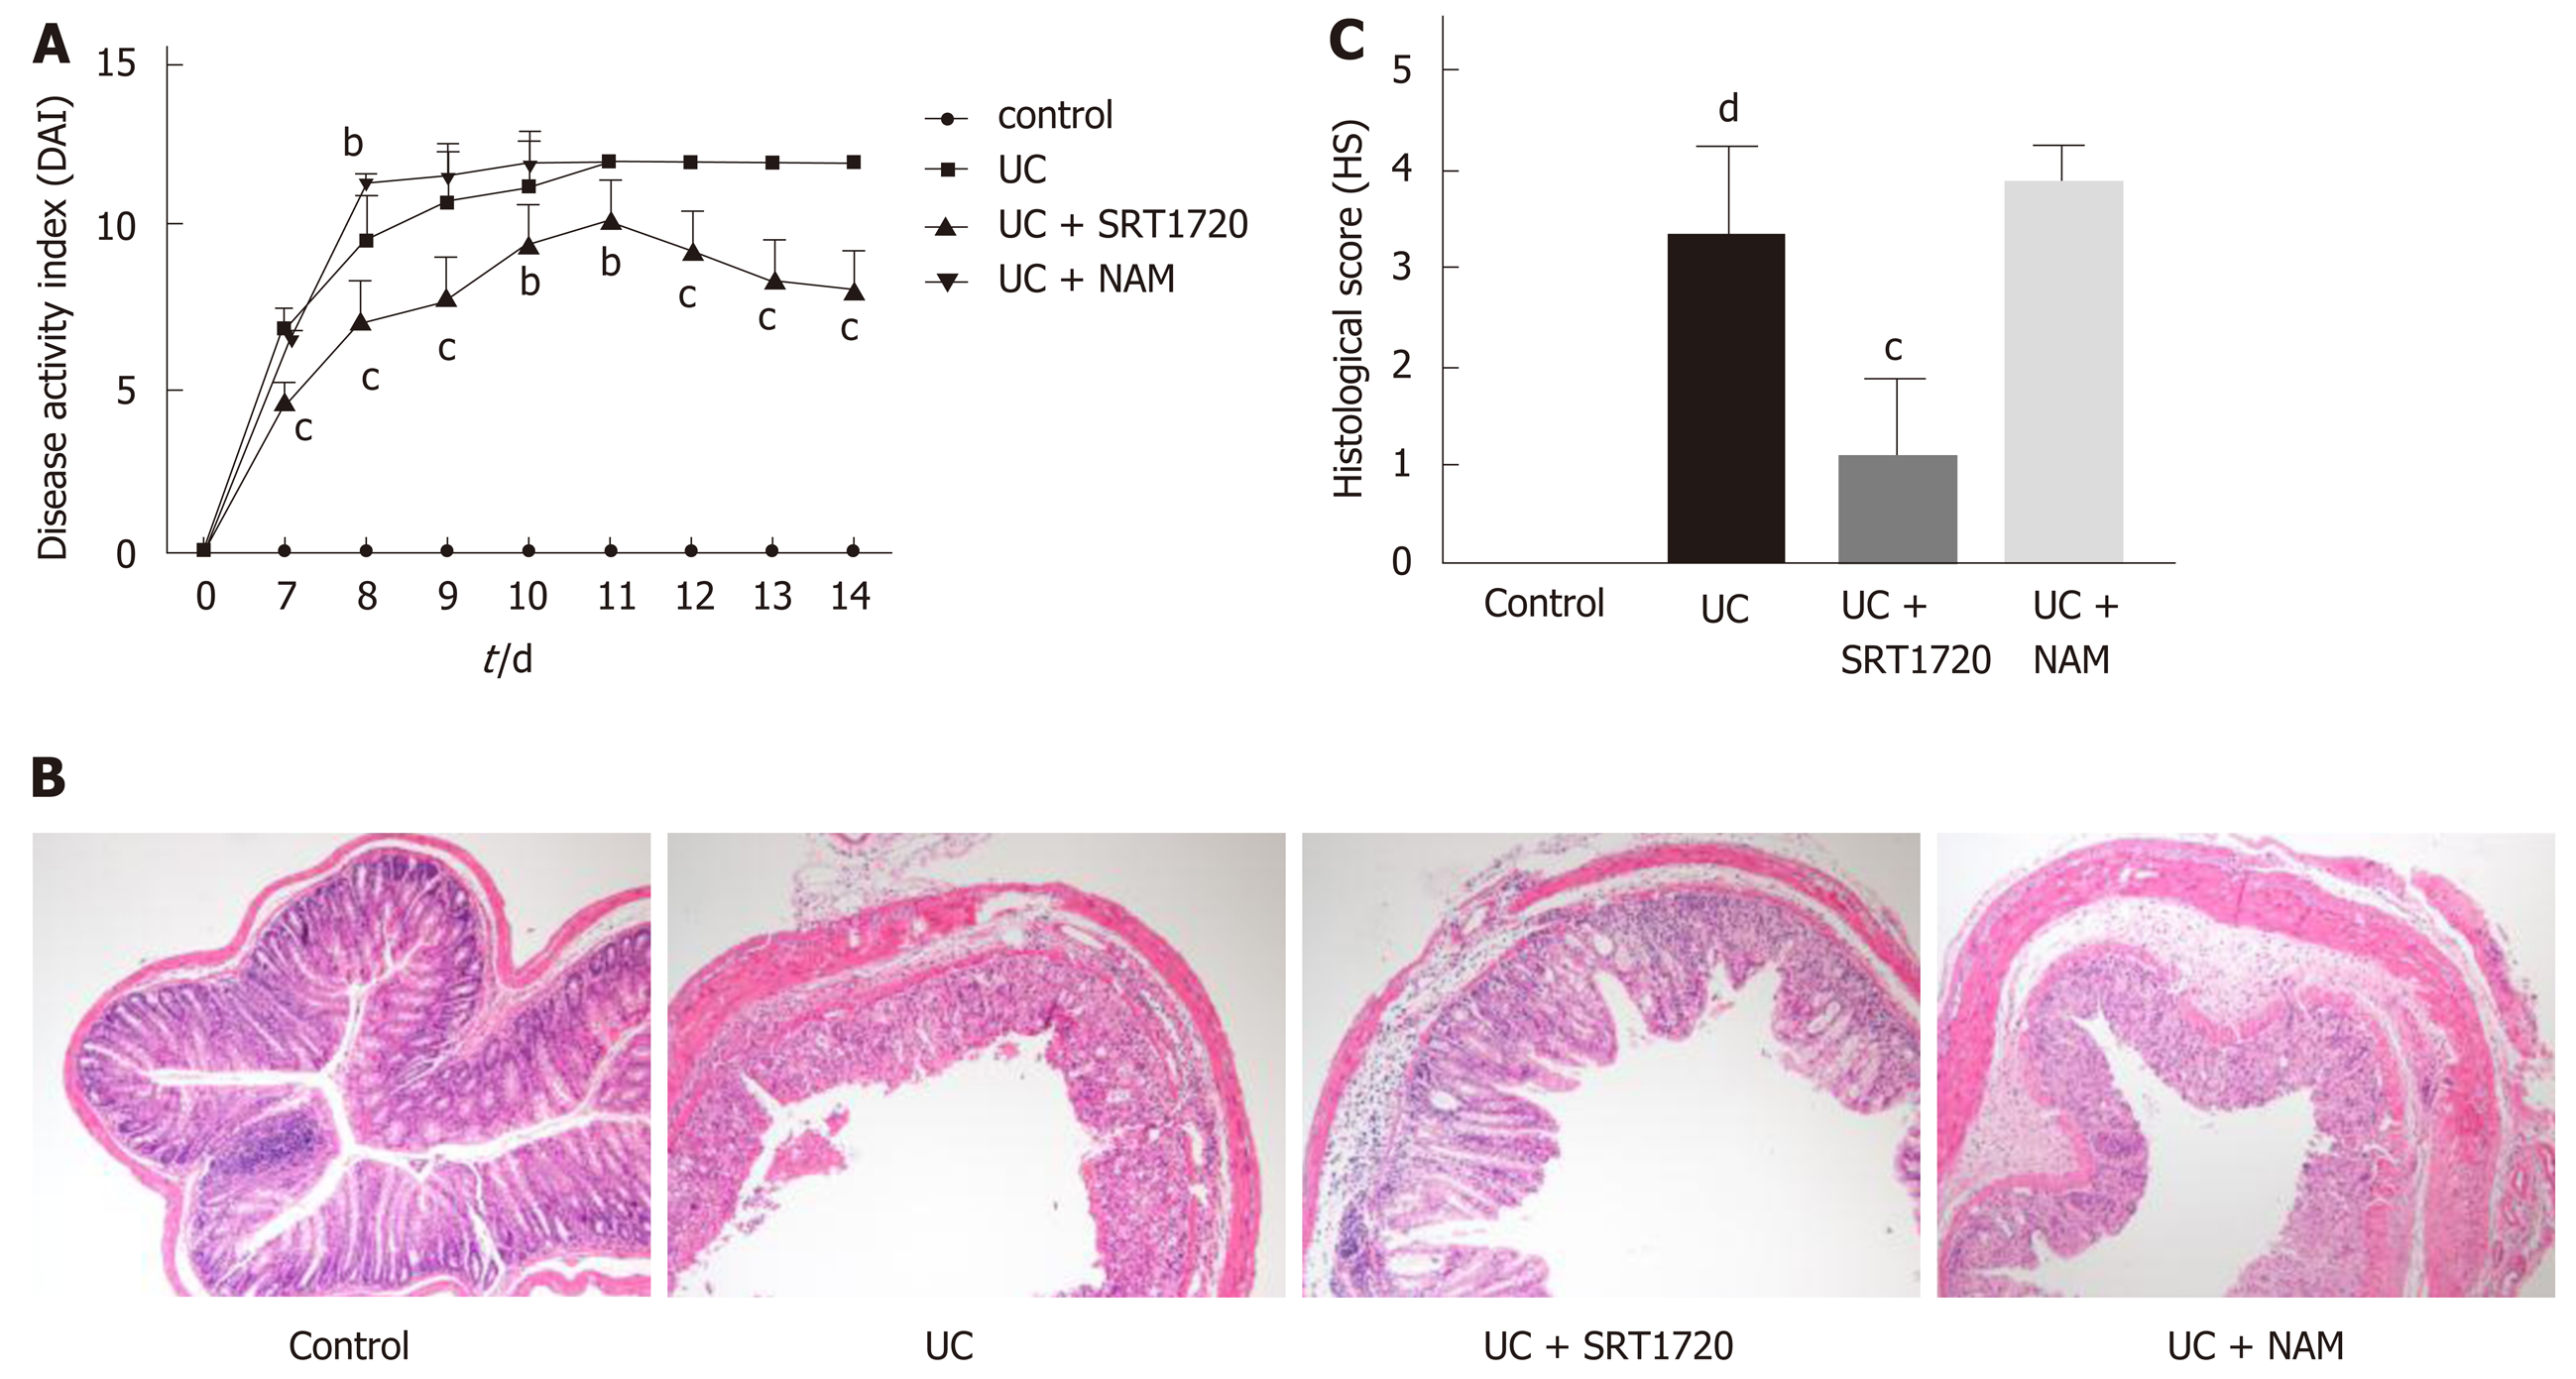
Figure 5 Sirtuin 1 clinically and histologically ameliorates dextran sodium sulfate-induced colitis.
A: Disease activity index was calculated; B: Hematoxylin-eosin staining of colon sections was performed (×100); C: Histological scores of stained sections were calculated. Each value is presented as the mean ± SD. bP < 0.01 vs UC; cP < 0.001 vs UC; dP < 0.001 vs control. UC: Ulcerative colitis; NAM: Nicotinamide.
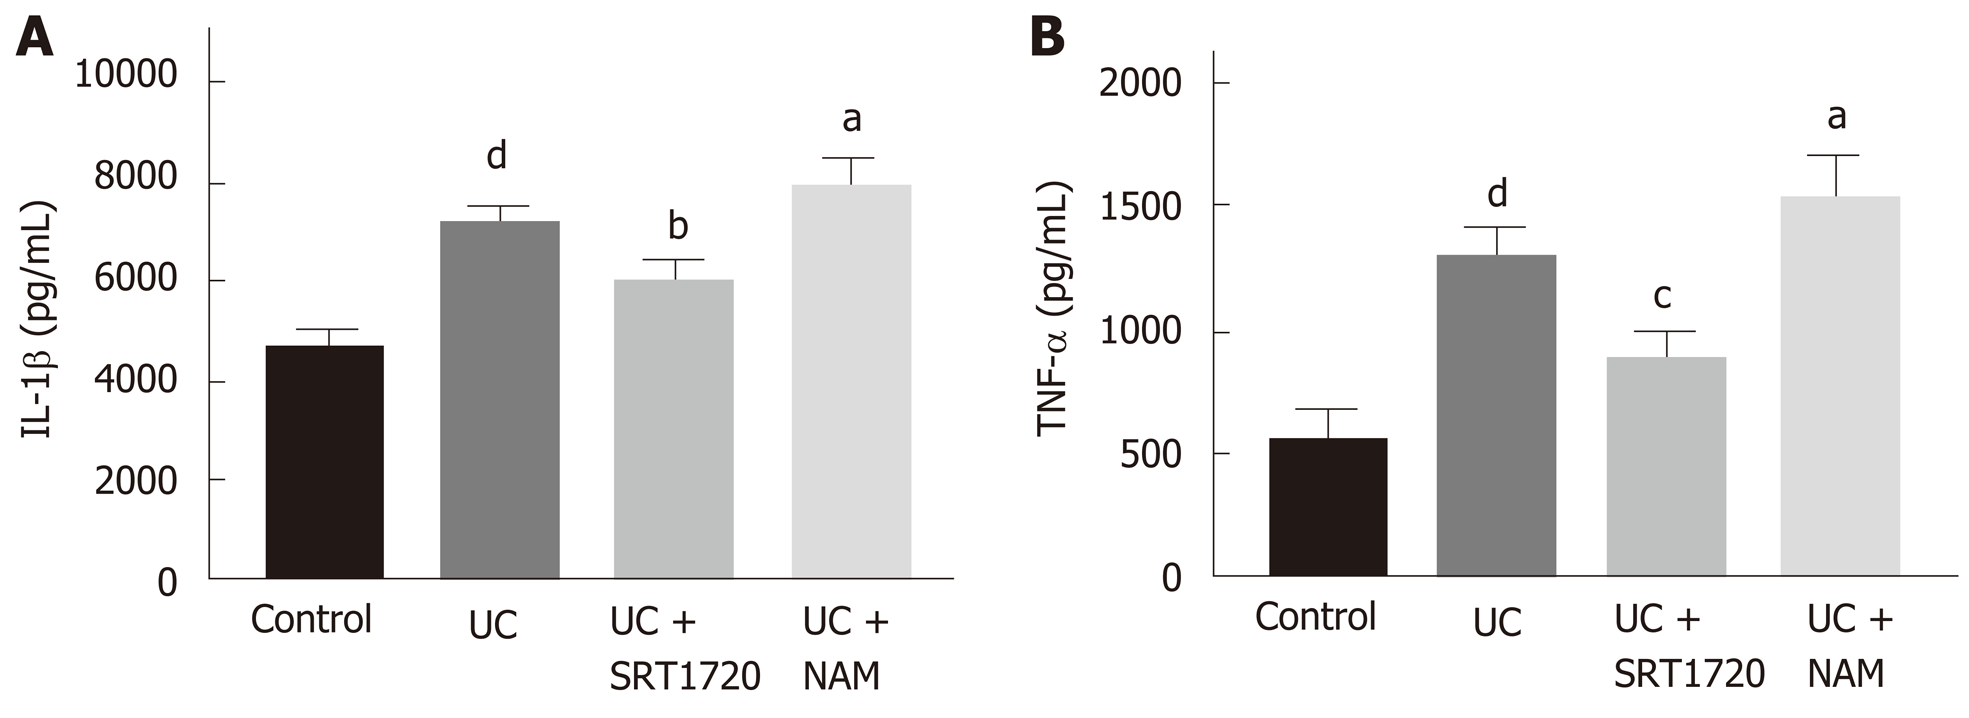
Figure 6 SIRT1 decreases inflammatory cytokine expression in dextran sodium sulfate-induced colitis.
The expression levels of IL-1β and TNF-α were detected by ELISA. A: The expression of IL-1β in colon tissues; B: The expression of TNF-α in colon tissues. Data are presented as the mean ± SD. aP < 0.05 vs UC; bP < 0.01 vs UC; cP < 0.001 vs UC; dP < 0.001 vs control. UC: Ulcerative colitis; NAM: Nicotinamide; IL-1β: interleukin-1β; TNF-α: Tumor necrosis factor-α; ELISA: Enzyme-linked immunosorbent assay.
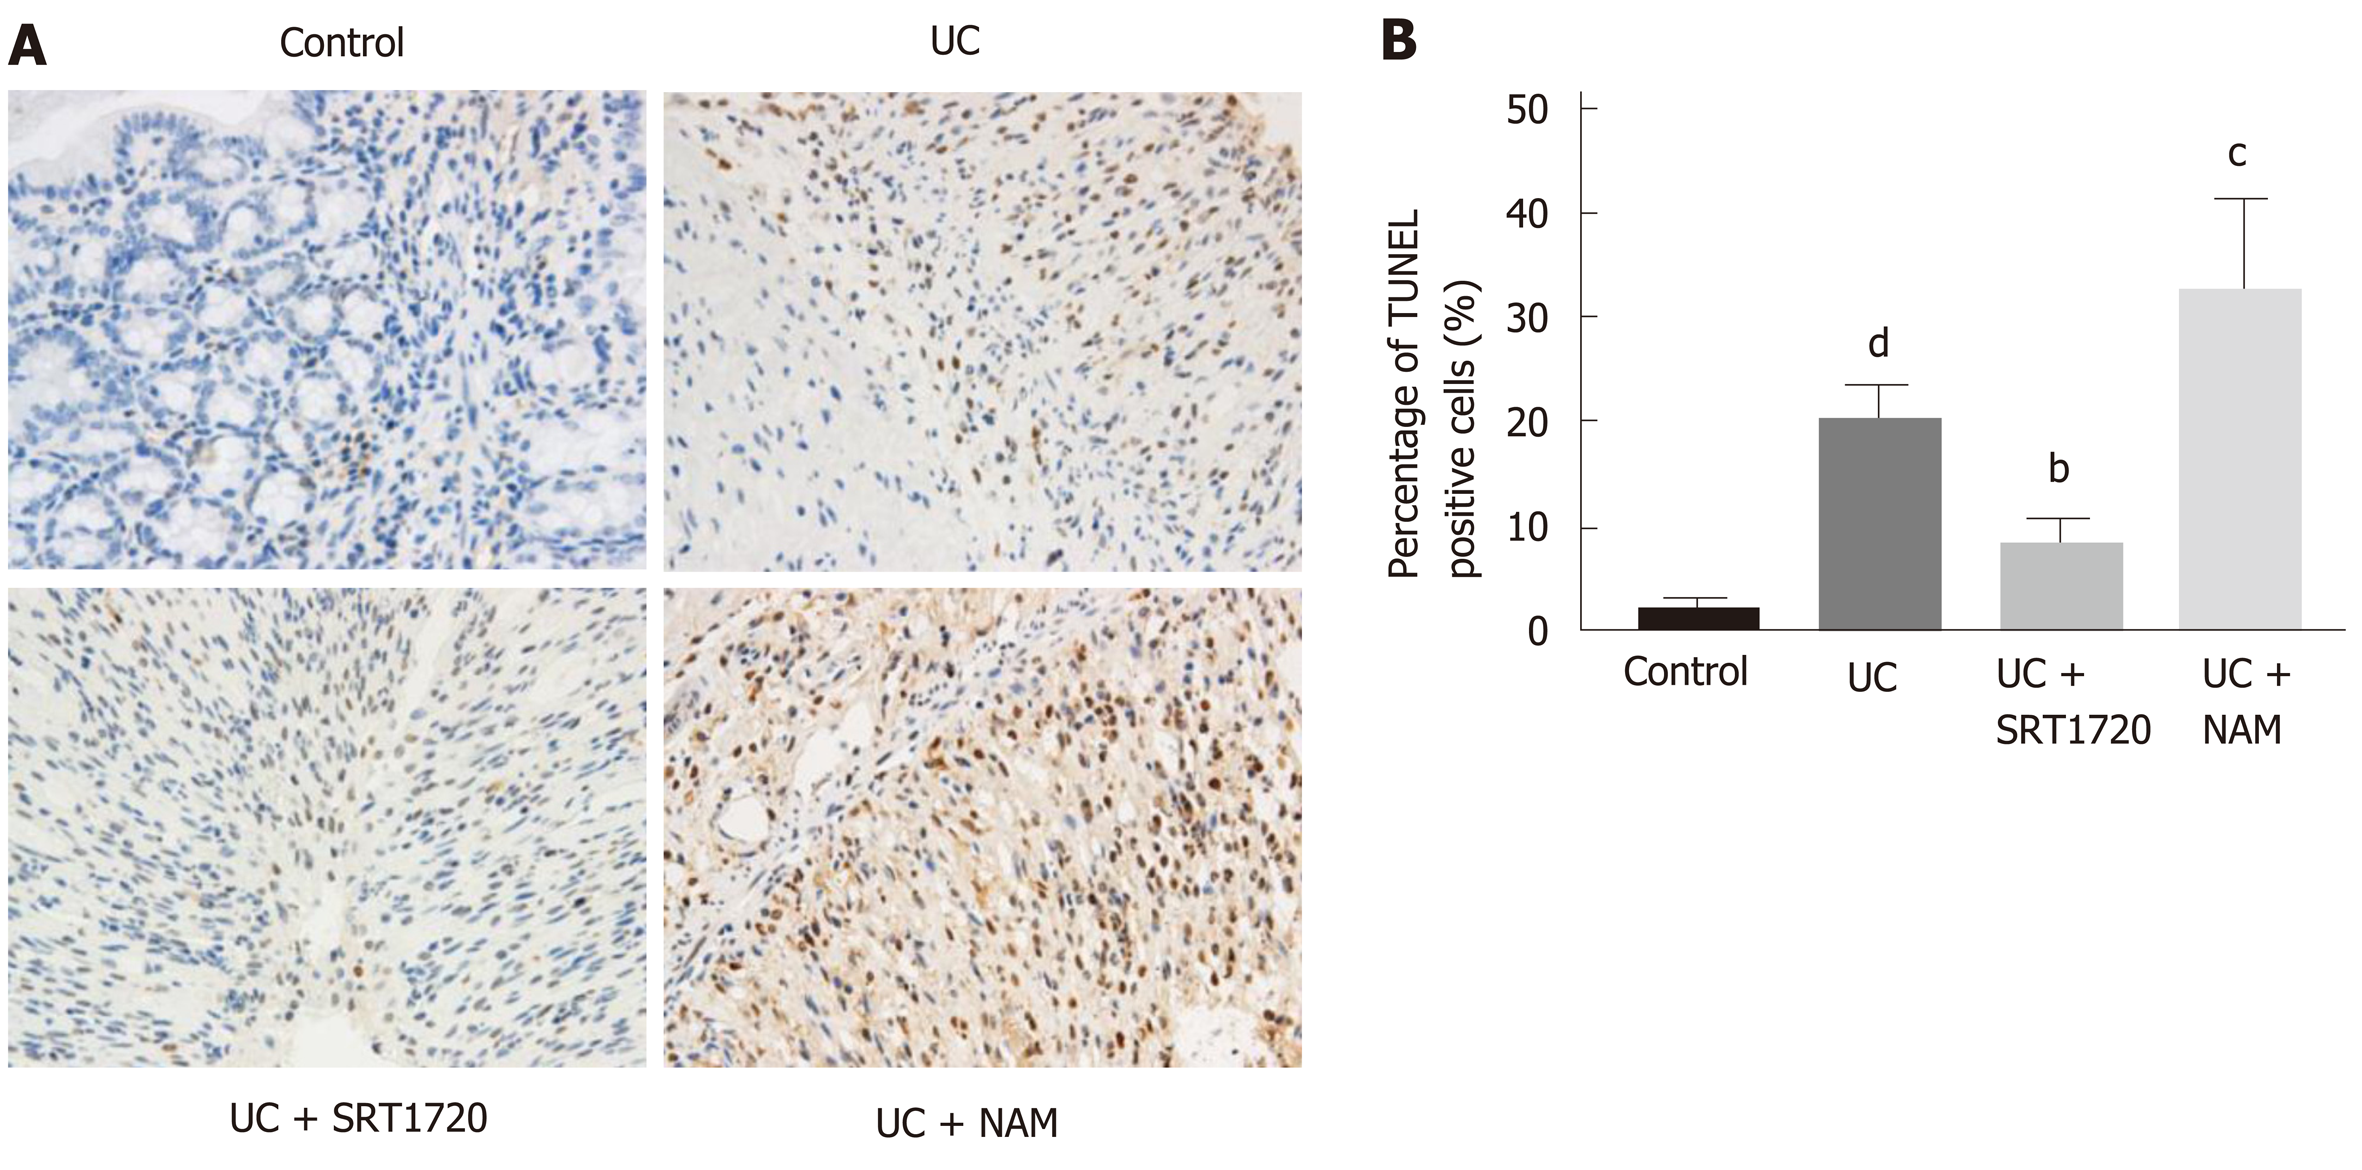
Figure 7 SIRT1 activation reduces apoptotic cell rates in dextran sodium sulfate-induced colitis.
A: TUNEL staining of colon tissue was performed; B: The number of TUNEL positive cells per 10000 cells was counted. Each value is presented as the mean ± SD. bP < 0.01 vs UC; cP < 0.001 vs UC; dP < 0.001 vs control. TUNEL: Transferase-mediated dUTP nick-end labeling; UC: Ulcerative colitis; NAM: Nicotinamide.
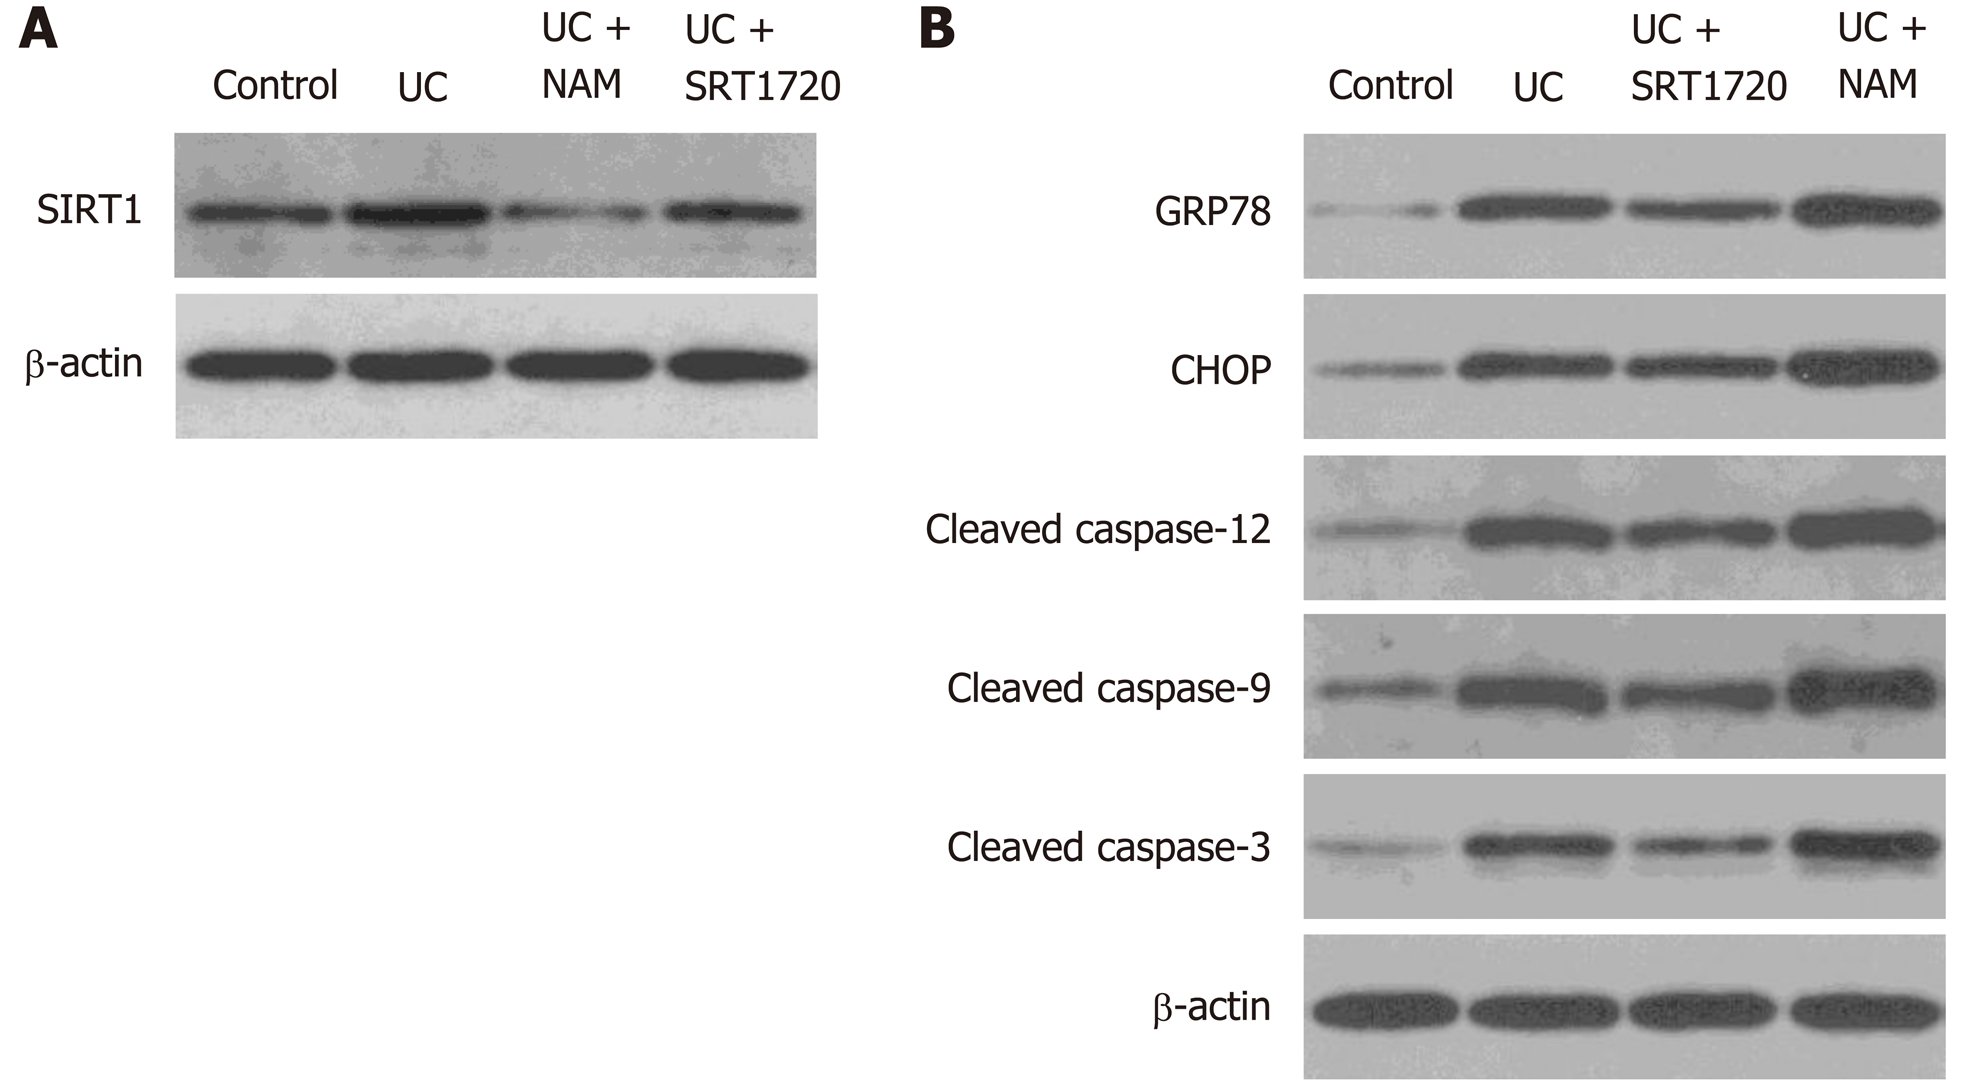
Figure 8 Sirtuin 1 activation suppresses endoplasmic reticulum stress-mediated apoptotic pathways during dextran sodium sulfate-induced colitis.
The protein levels of SIRT1, GRP78, CHOP, cleaved caspase-12, cleaved caspase-9, and cleaved caspase-3 in colon tissues were detected by Western blot. UC: Ulcerative colitis; NAM: Nicotinamide; GRP78: Glucose-regulated protein 78; CHOP: CCAAT/enhancer-binding protein homologous protein; SIRT1: Sirtuin 1.
- Citation: Ren MT, Gu ML, Zhou XX, Yu MS, Pan HH, Ji F, Ding CY. Sirtuin 1 alleviates endoplasmic reticulum stress-mediated apoptosis of intestinal epithelial cells in ulcerative colitis. World J Gastroenterol 2019; 25(38): 5800-5813
- URL: https://www.wjgnet.com/1007-9327/full/v25/i38/5800.htm
- DOI: https://dx.doi.org/10.3748/wjg.v25.i38.5800


