Copyright
©The Author(s) 2019.
World J Gastroenterol. Sep 21, 2019; 25(35): 5266-5282
Published online Sep 21, 2019. doi: 10.3748/wjg.v25.i35.5266
Published online Sep 21, 2019. doi: 10.3748/wjg.v25.i35.5266
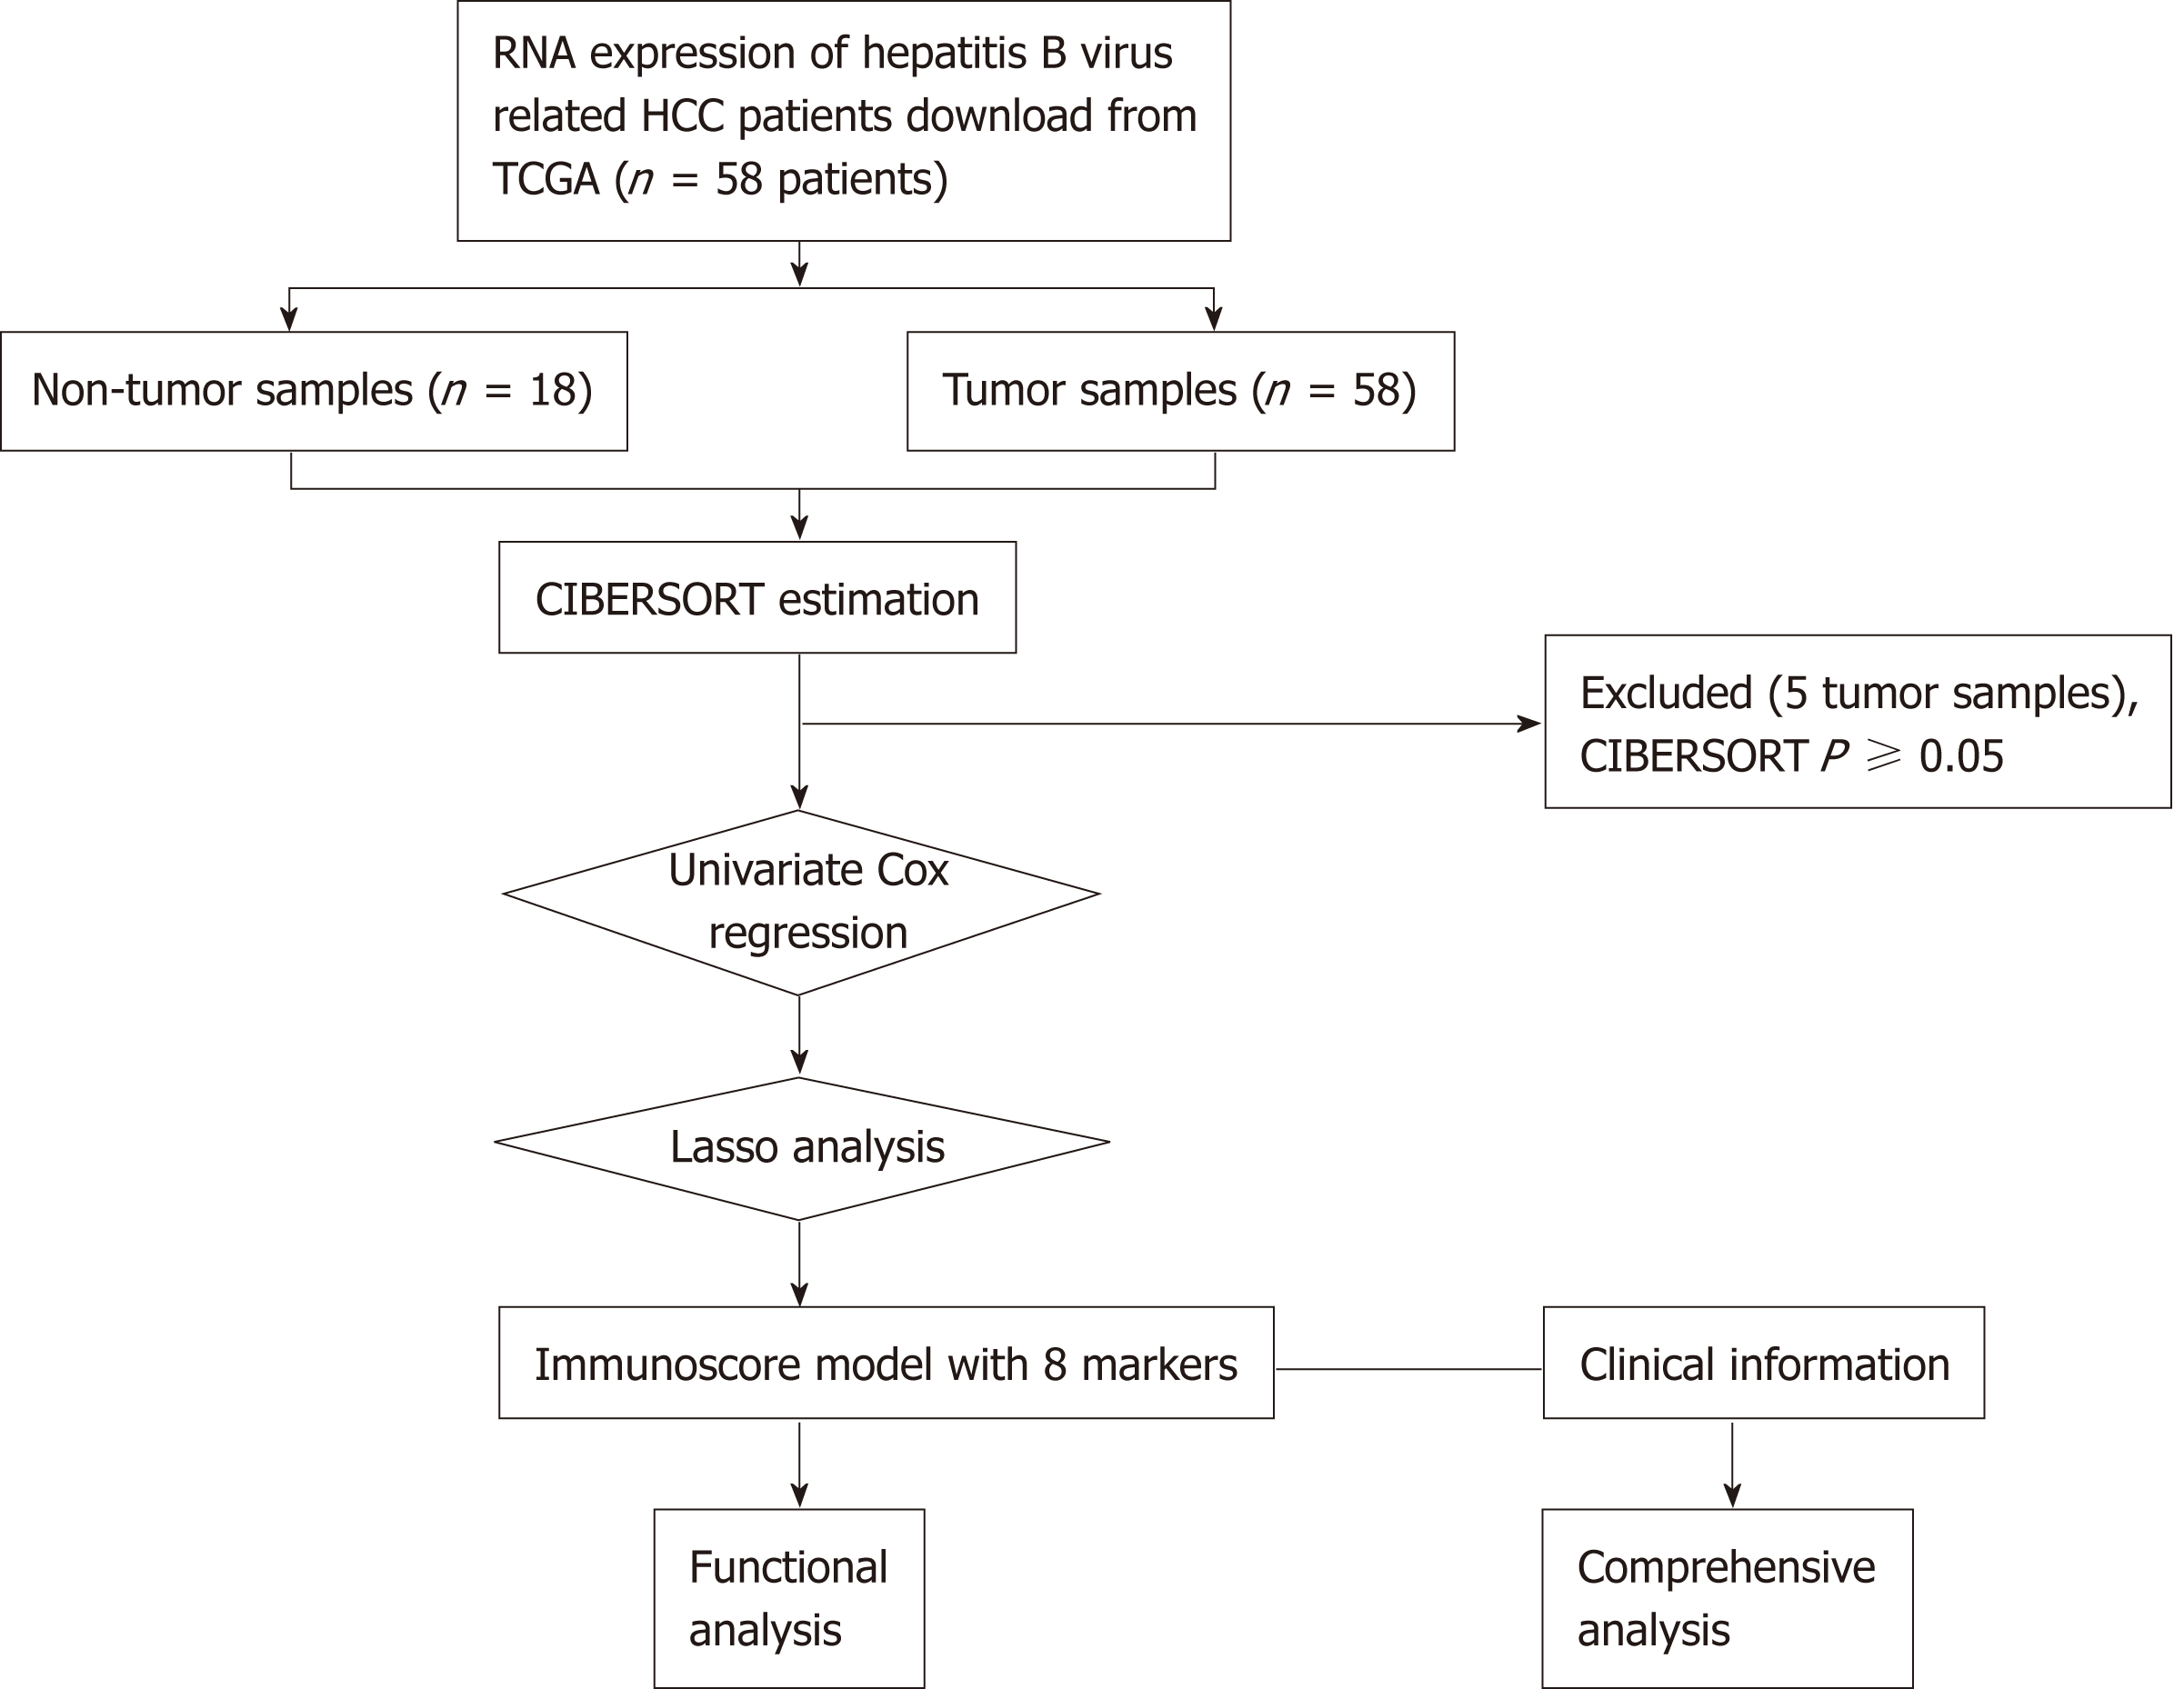
Figure 1 General design of this study.
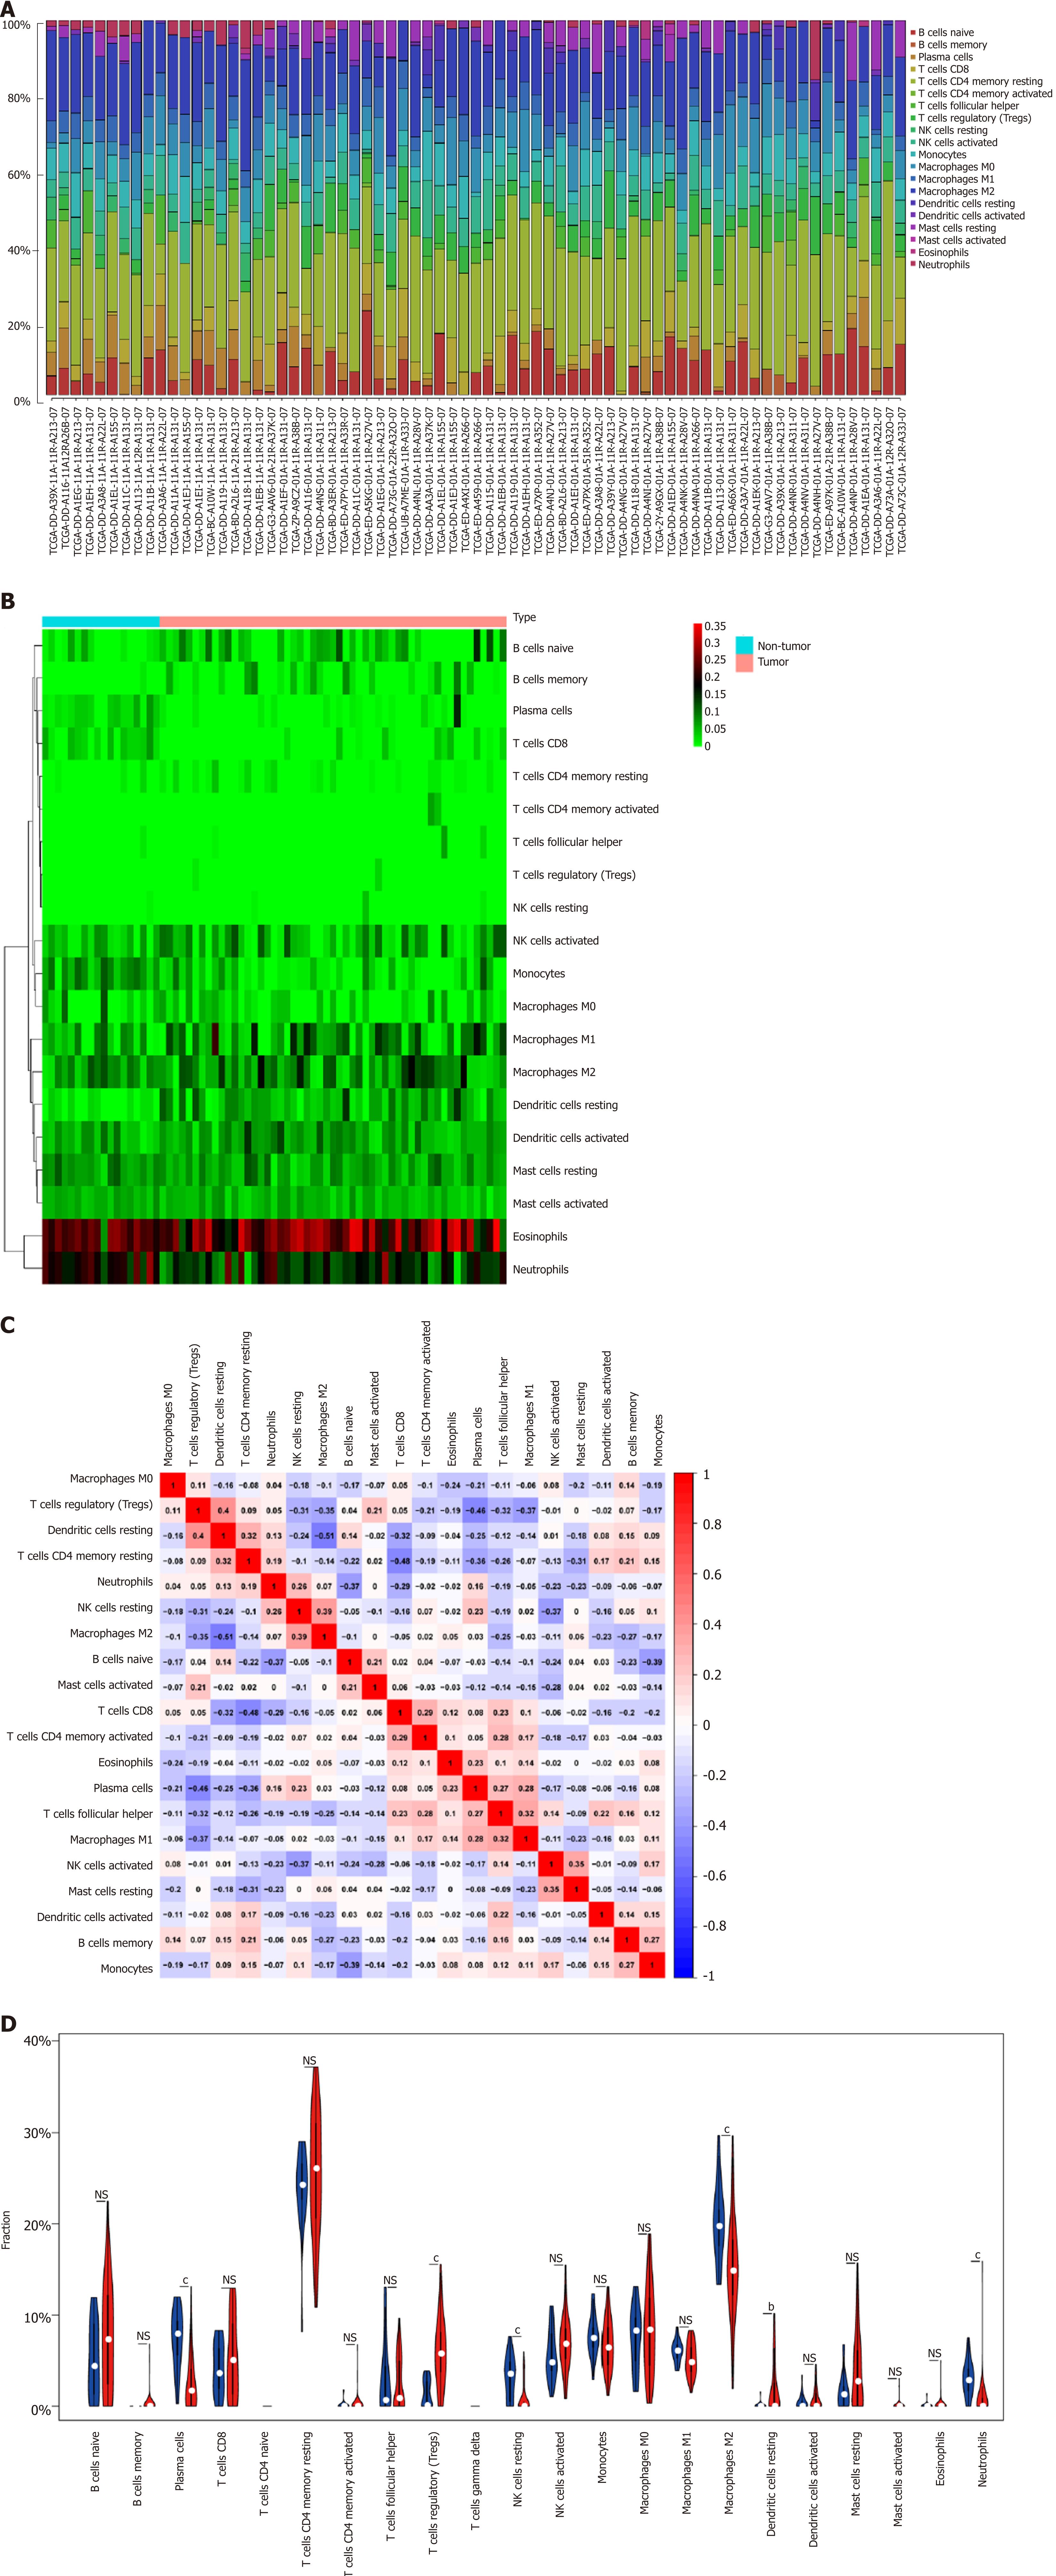
Figure 2 Immune infiltrate landscape for hepatitis B virus-related hepatocellular carcinoma.
A: Immune infiltrate composition in each sample. B: Heatmap showing the 20 fractions of immunocytes, where the horizontal axis displays samples that were classified as two leading clusters; C: Correlation matrix for the 20 immunocyte proportions as well as the immunocyte lytic activity. Variables were sorted according to the mean linkage clustering; D: Violin plot showing differential expression of 20 immunocytes. bP < 0.01, cP < 0.001. NS: Not significant.
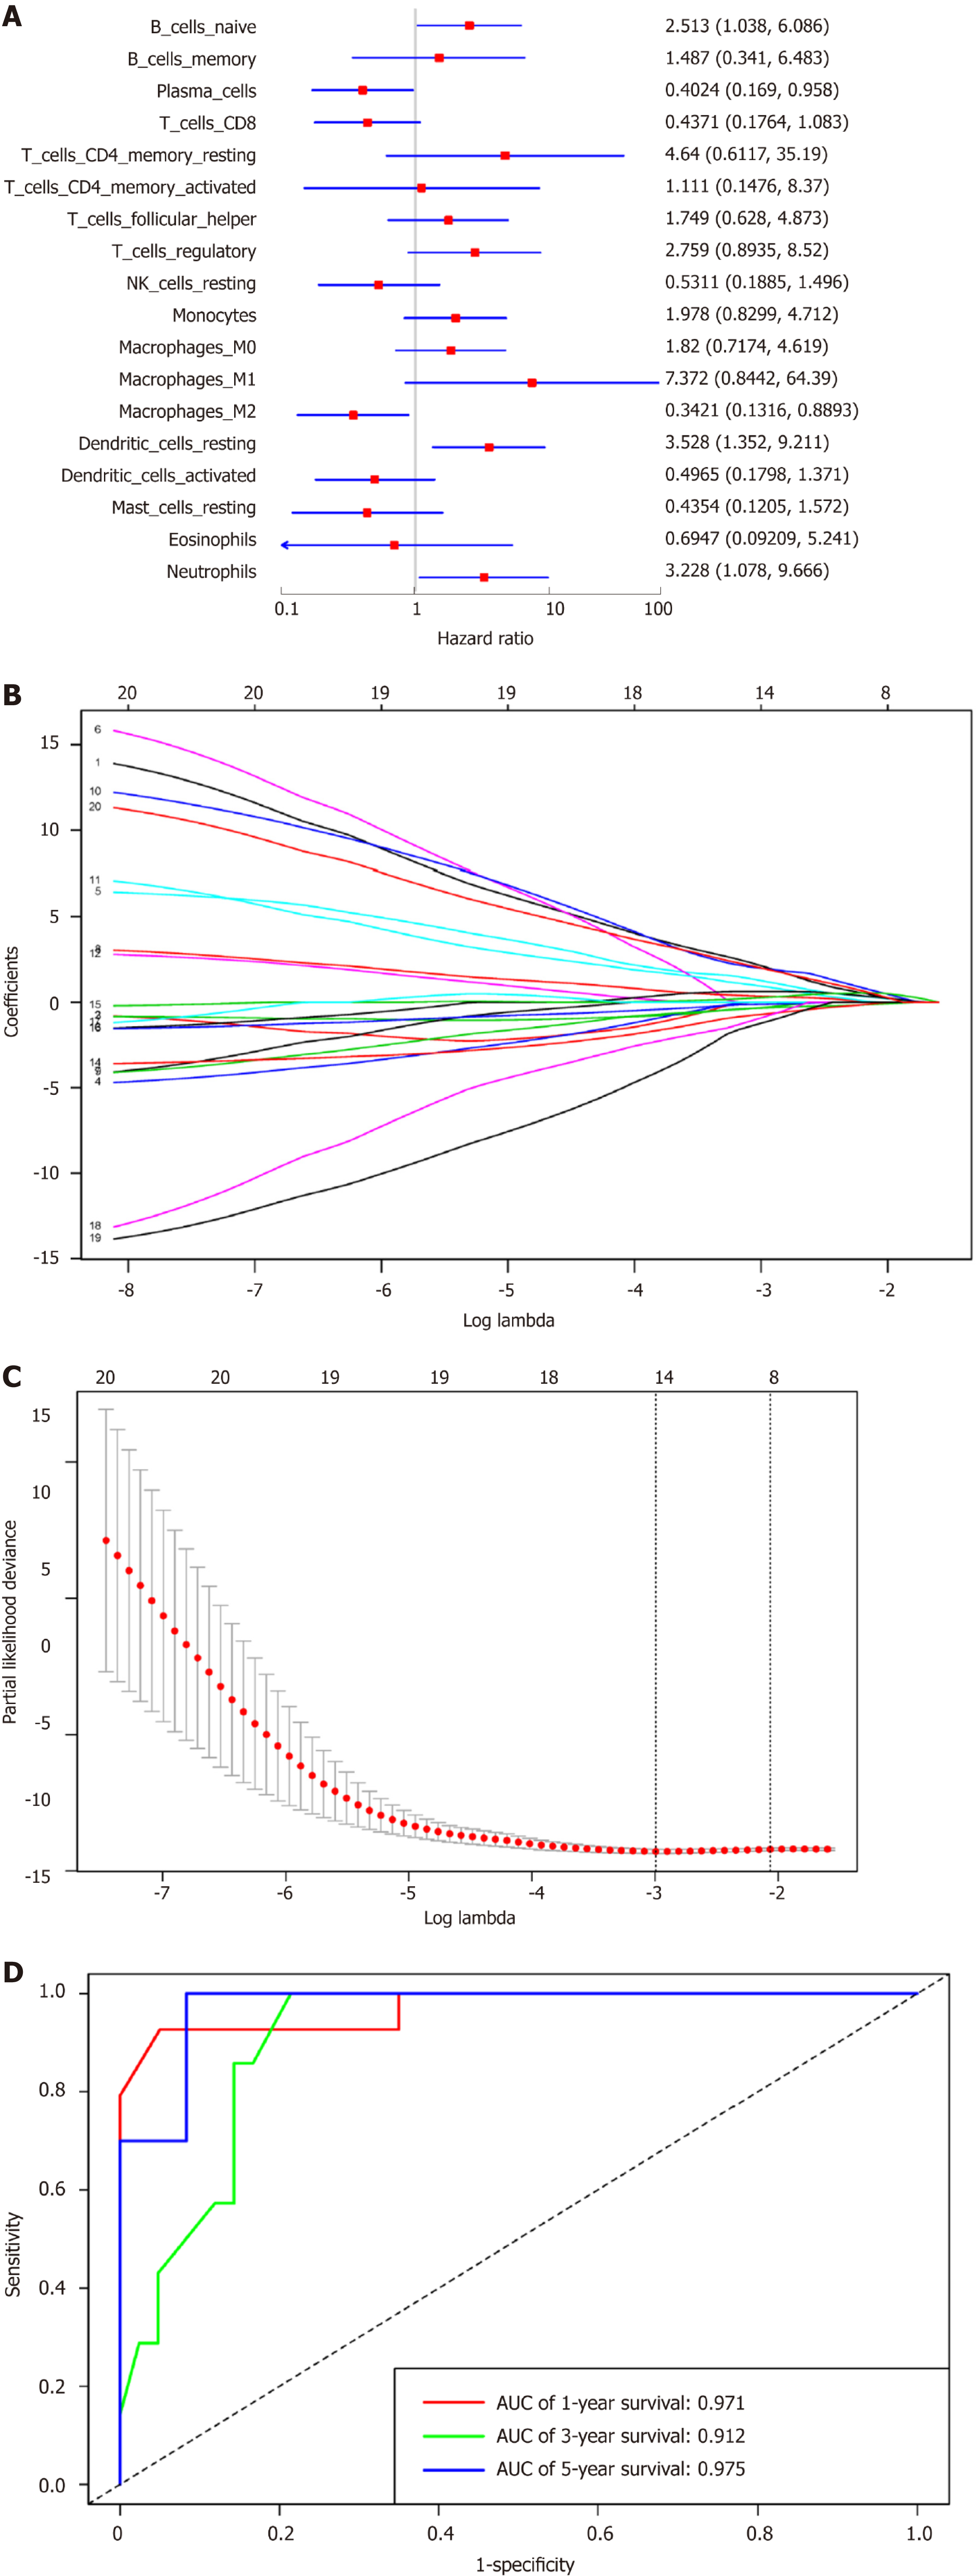
Figure 3 Immunoscore model construction.
A: Forest plots presenting the relationships of various immunocyte subpopulations with overall survival, in which the unadjusted hazard ratios as well as the corresponding 95% confidence intervals are displayed; B: Coefficient profiles of 20 immunocyte type fractions using the least absolute shrinkage and selection operator (LASSO); C: 10-fold cross-validation to select parameters for LASSO model, which can determine the cell type numbers adopted for LASSO model; D: Immunoscore determined using the time dependent receiver operating characteristic curves. For the 1-, 3-, and 5-year OS, the AUCs for the immunoscore were 0.971, 0.912, and 0.975, respectively. aP < 0.05. LASSO: Least absolute shrinkage and selection operator; AUC: Areas under the curve.
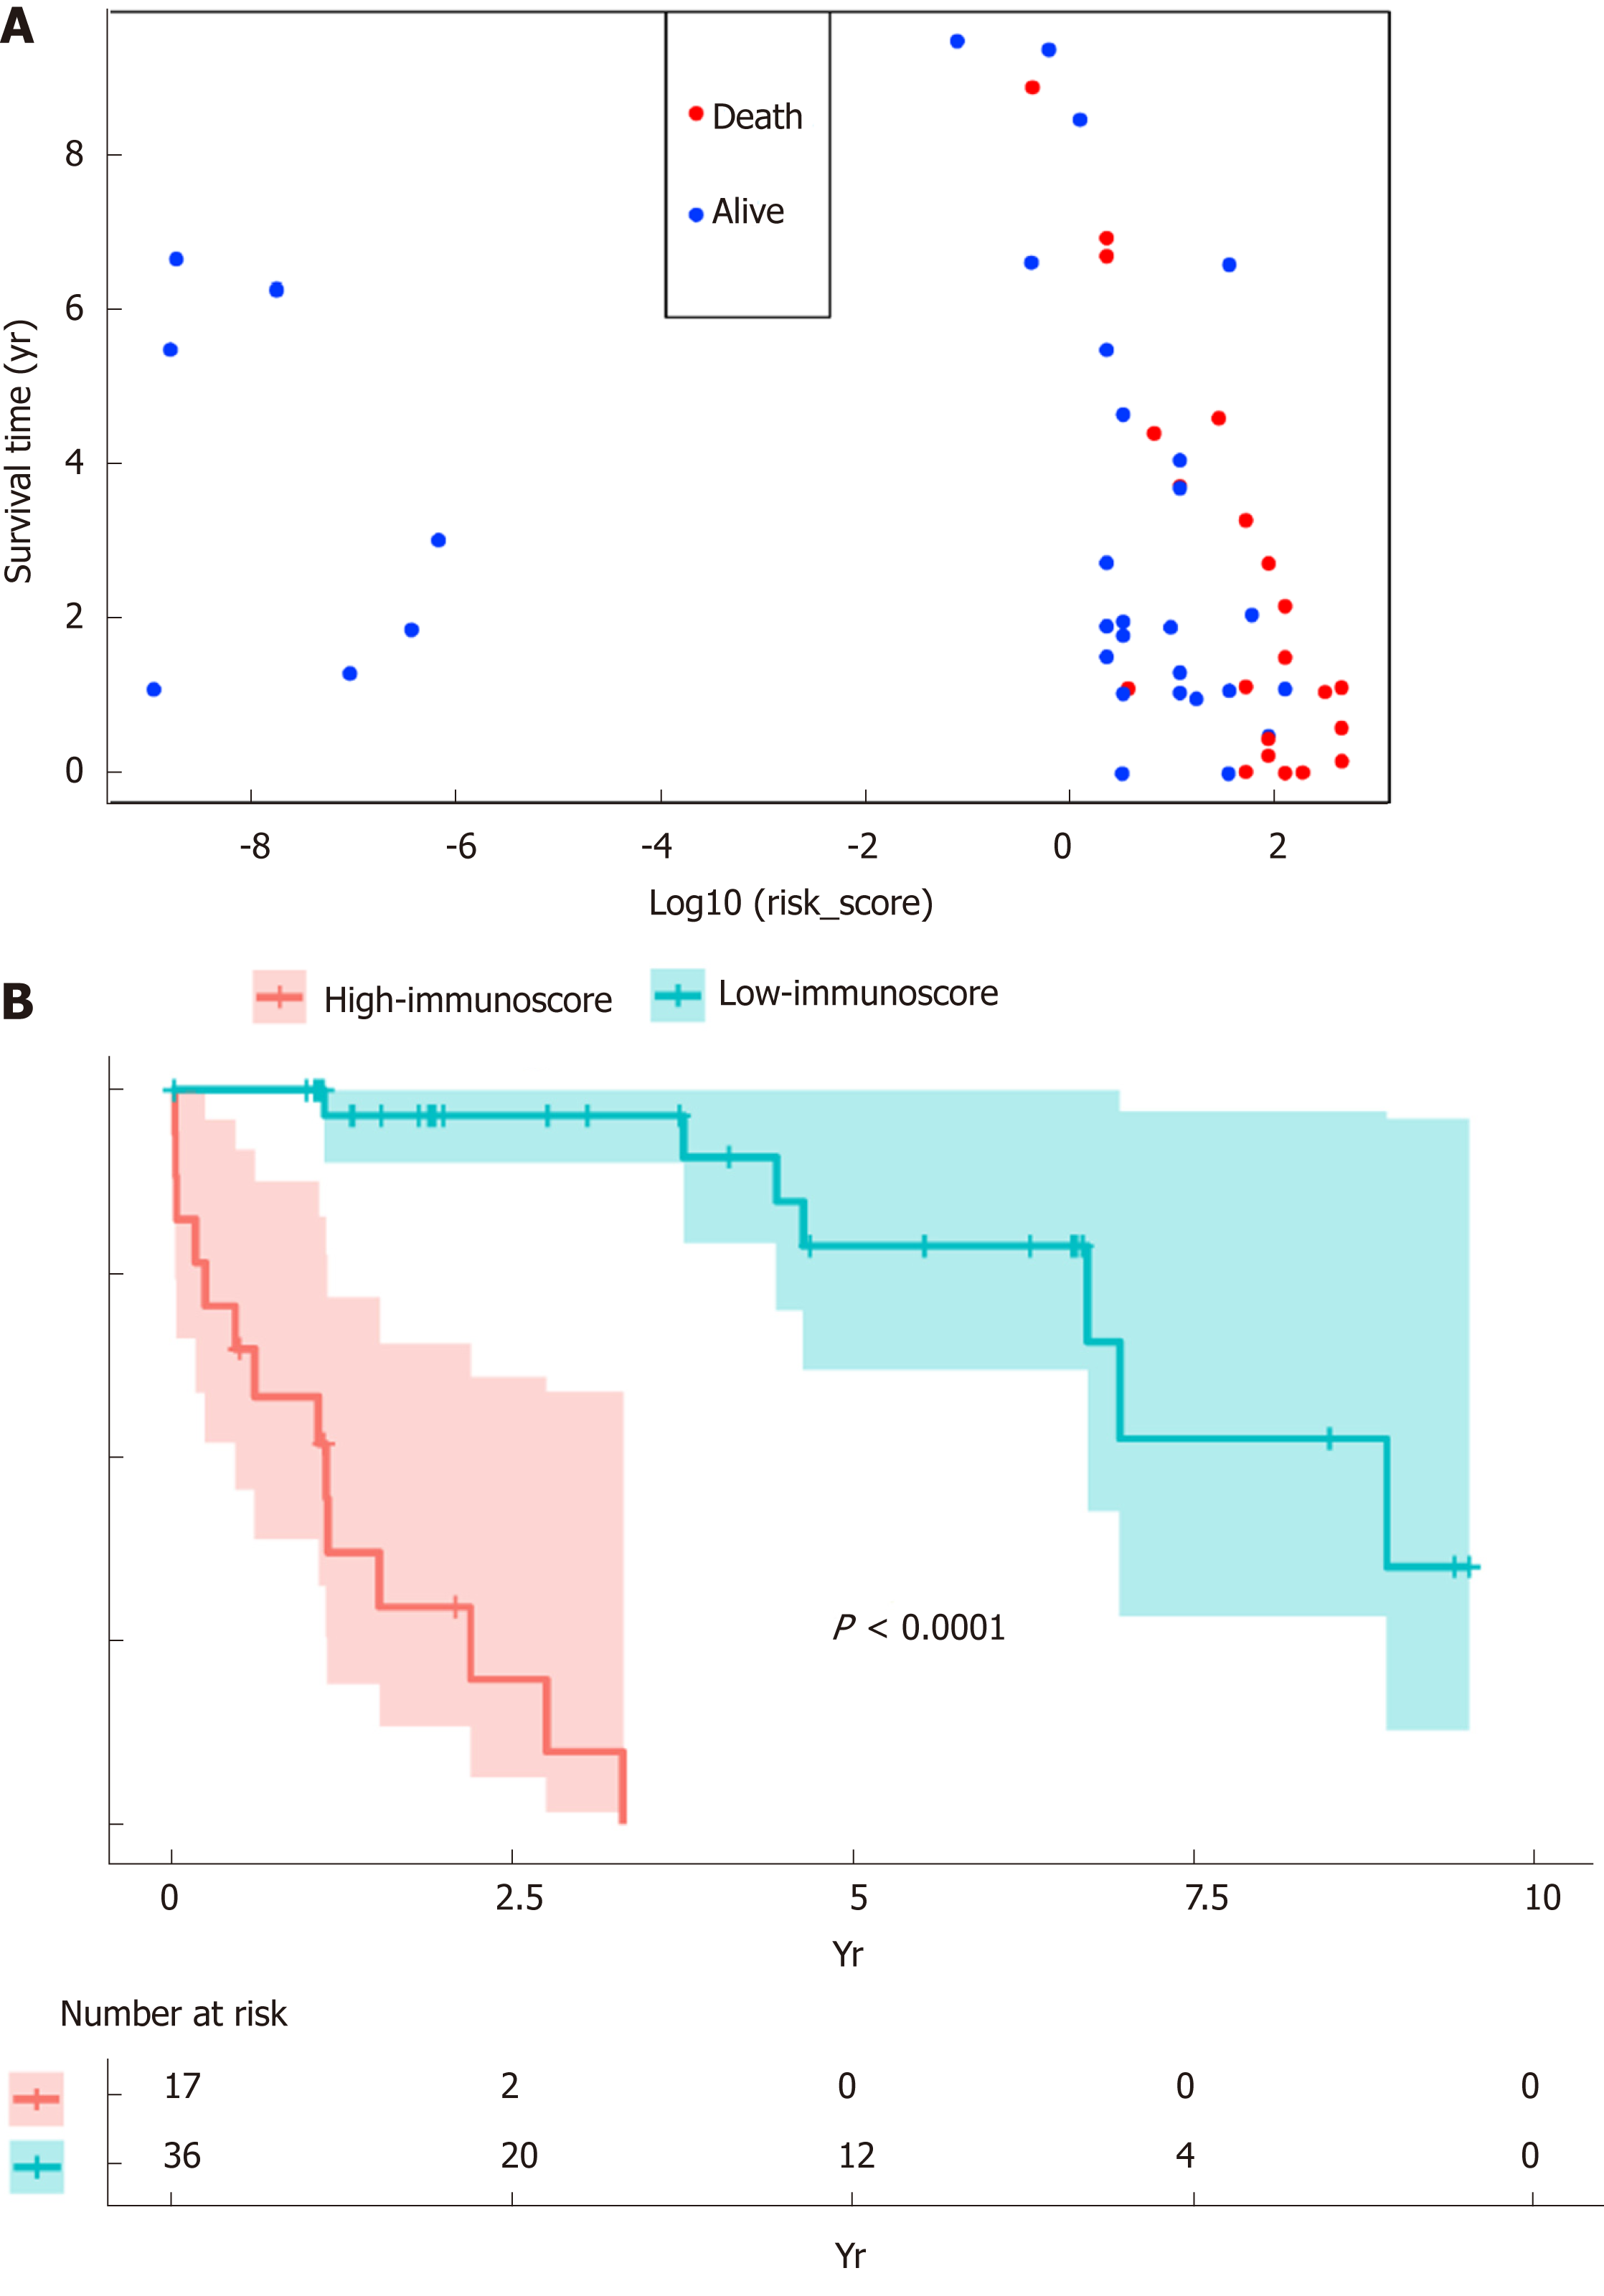
Figure 4 Verification of the immunoscore signature to predict the prognosis for hepatitis B virus-related hepatocellular carcinoma.
A: The vital status and overall survival were distributed based on the immunoscore; B: Kaplan-Meier curve regarding the overall survival of high- vs low- immunoscore groups.
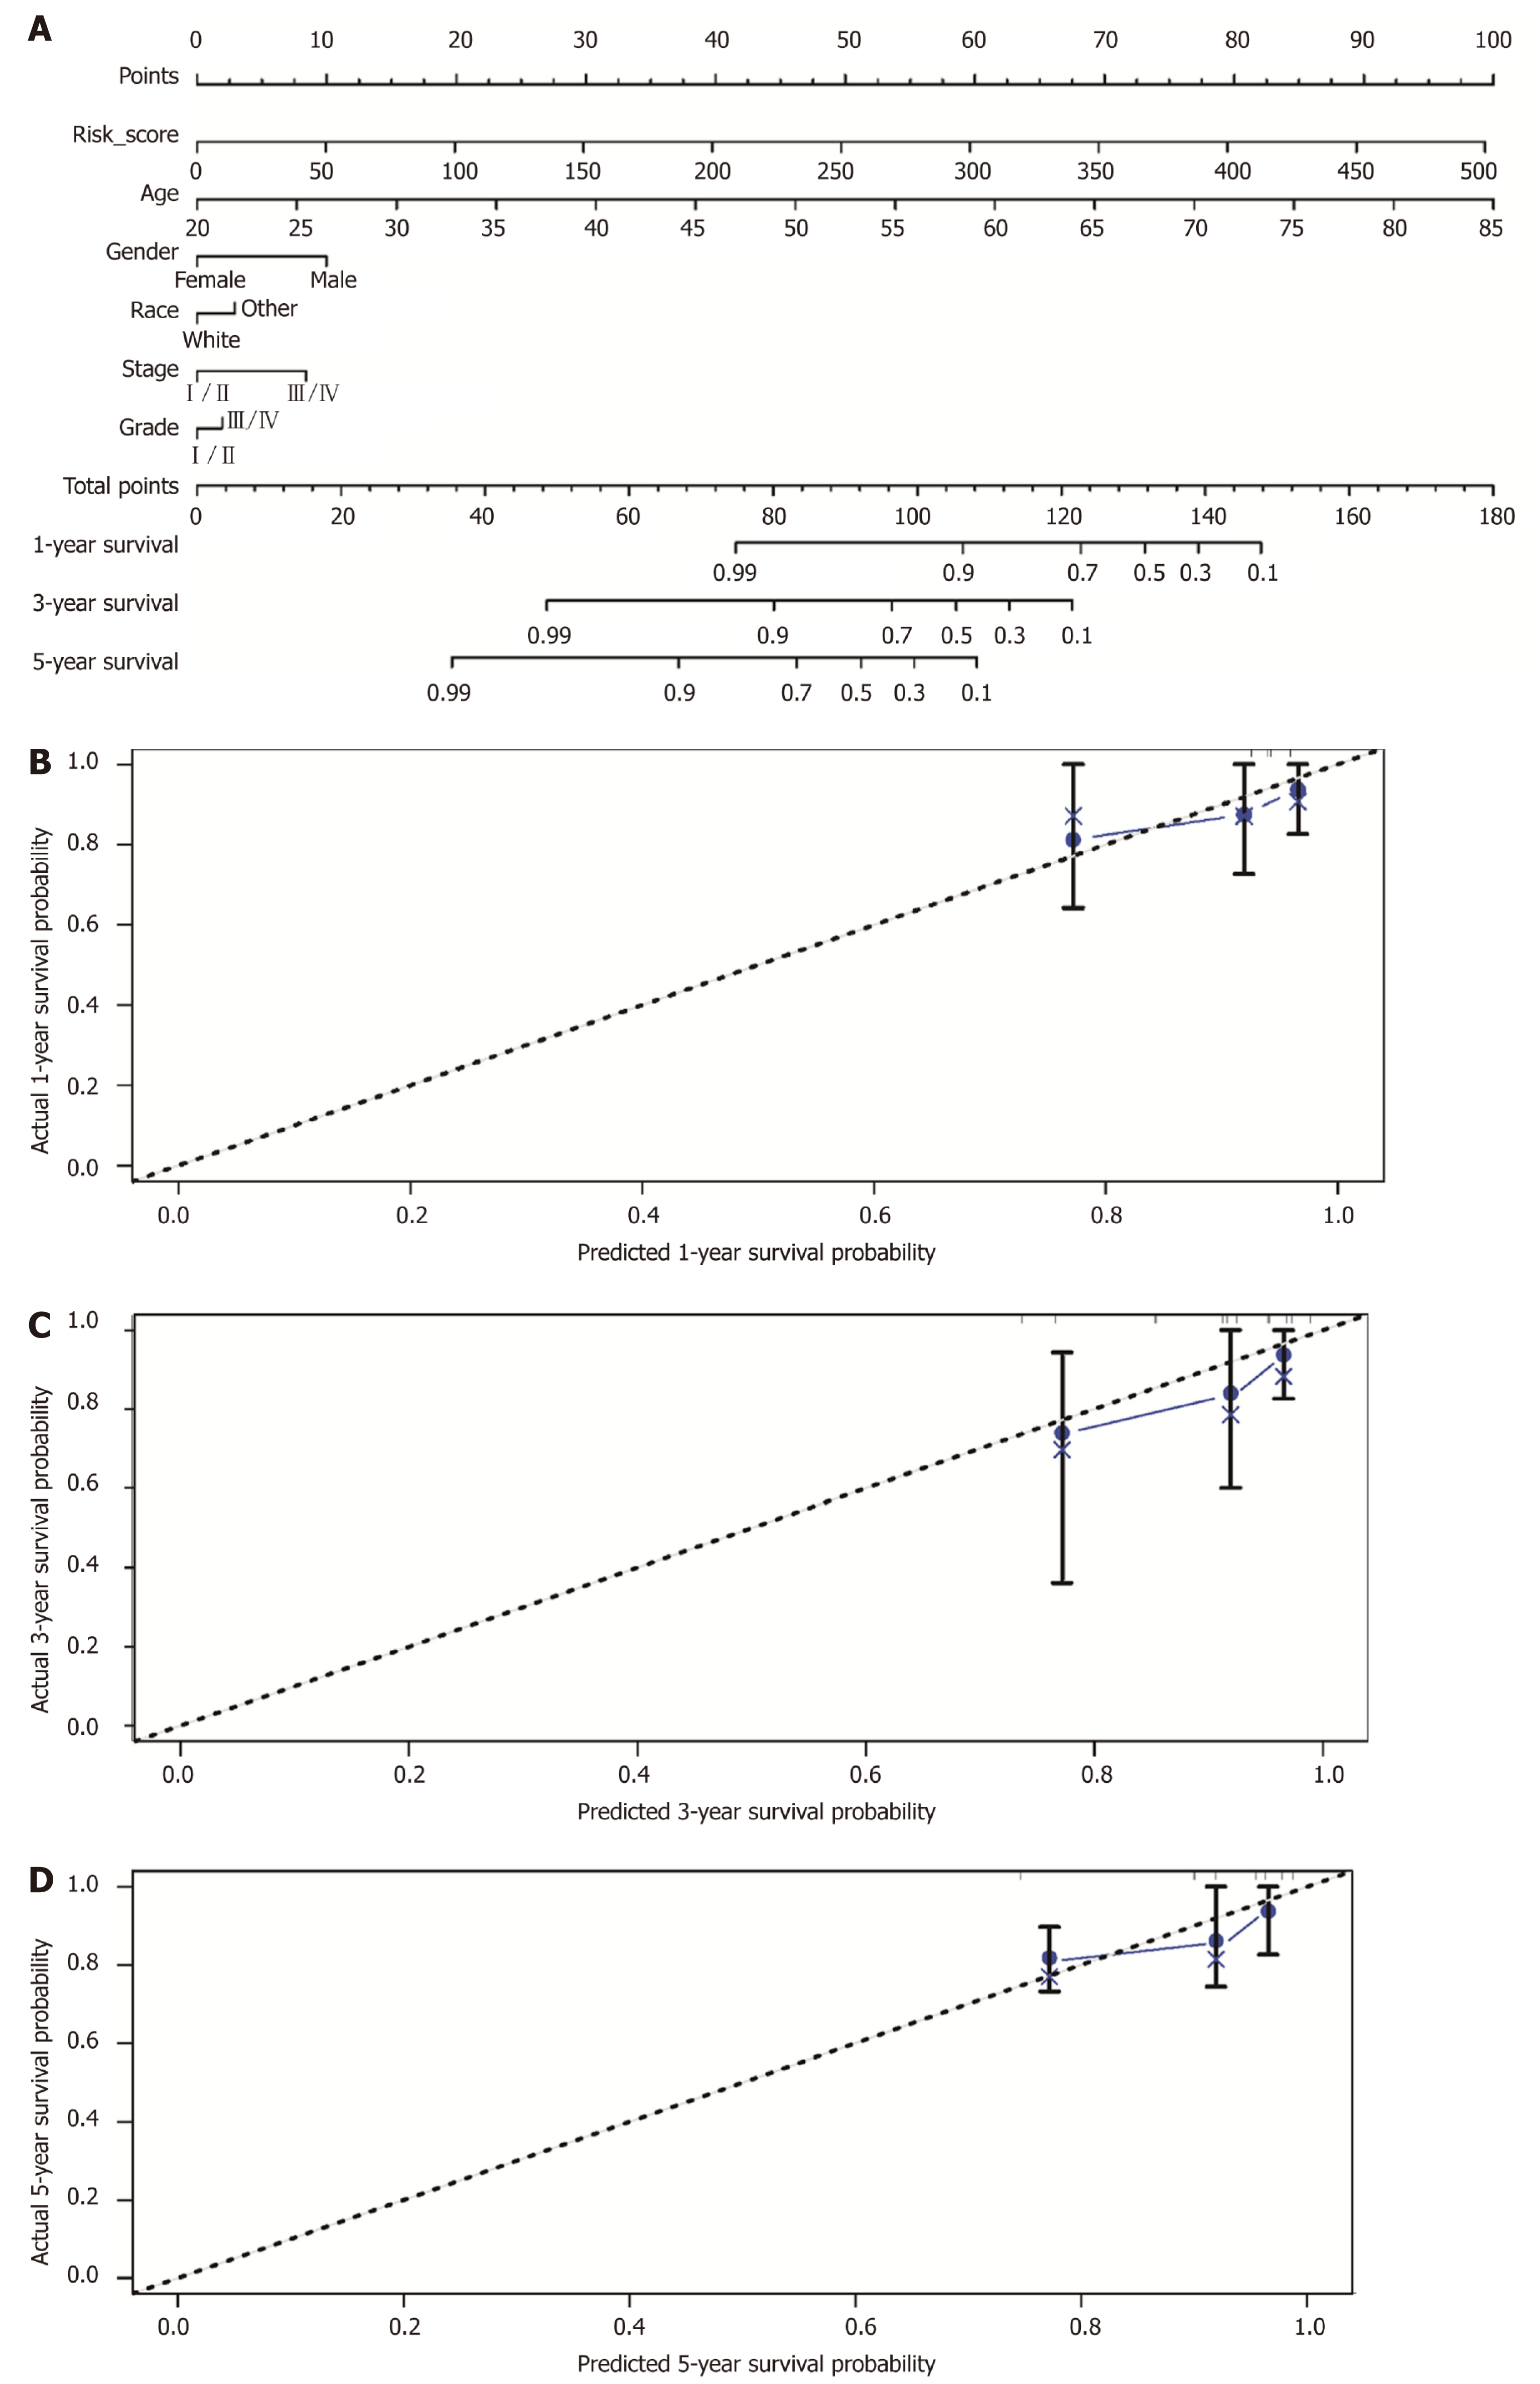
Figure 5 Construction of the nomogram.
A: Nomogram to predict the 1-, 3-, and 5-year overall survival of hepatitis B virus-related hepatocellular carcinoma patients based on the immunoscore and clinicopathological parameters; Calibration curves for predicting patient survival at 1 (B), 3 (C), and 5 (D) years.
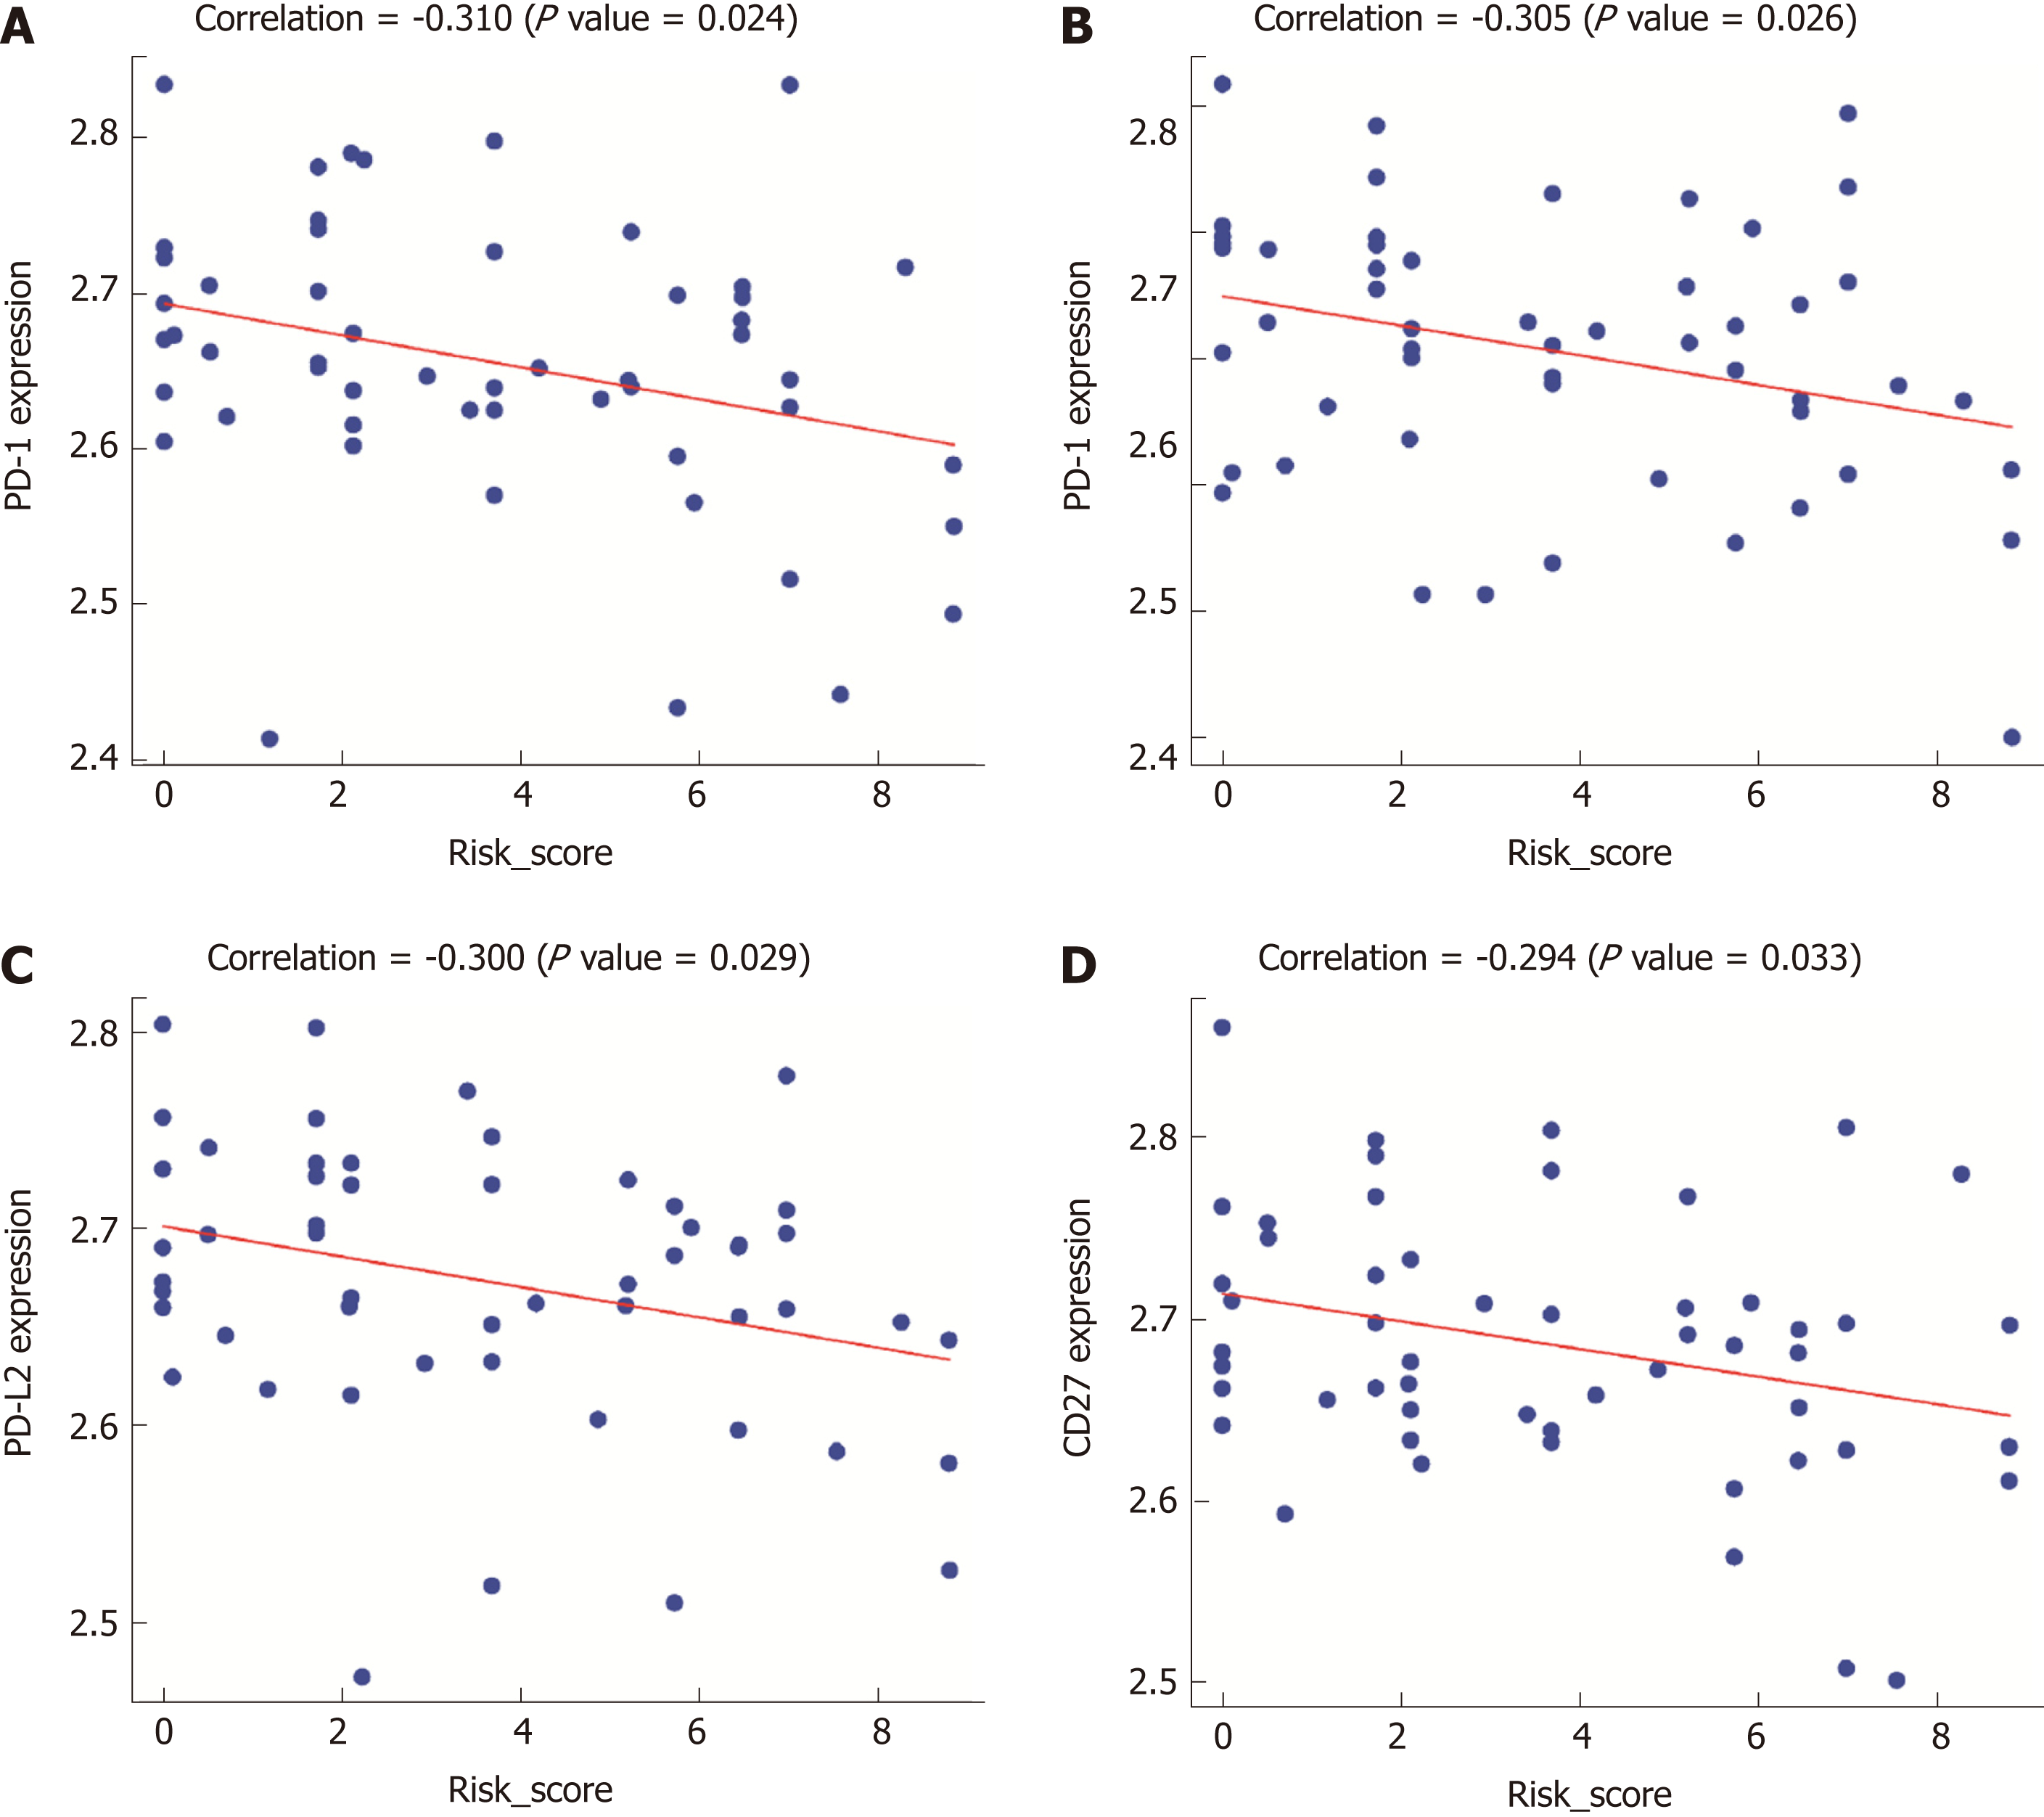
Figure 6 Scatter plots describing the relationship of immunoscore with the expression of immune checkpoint regulators, including PD-1 (A), PD-L1 (B), PD-L2 (C), and CD27 (D).
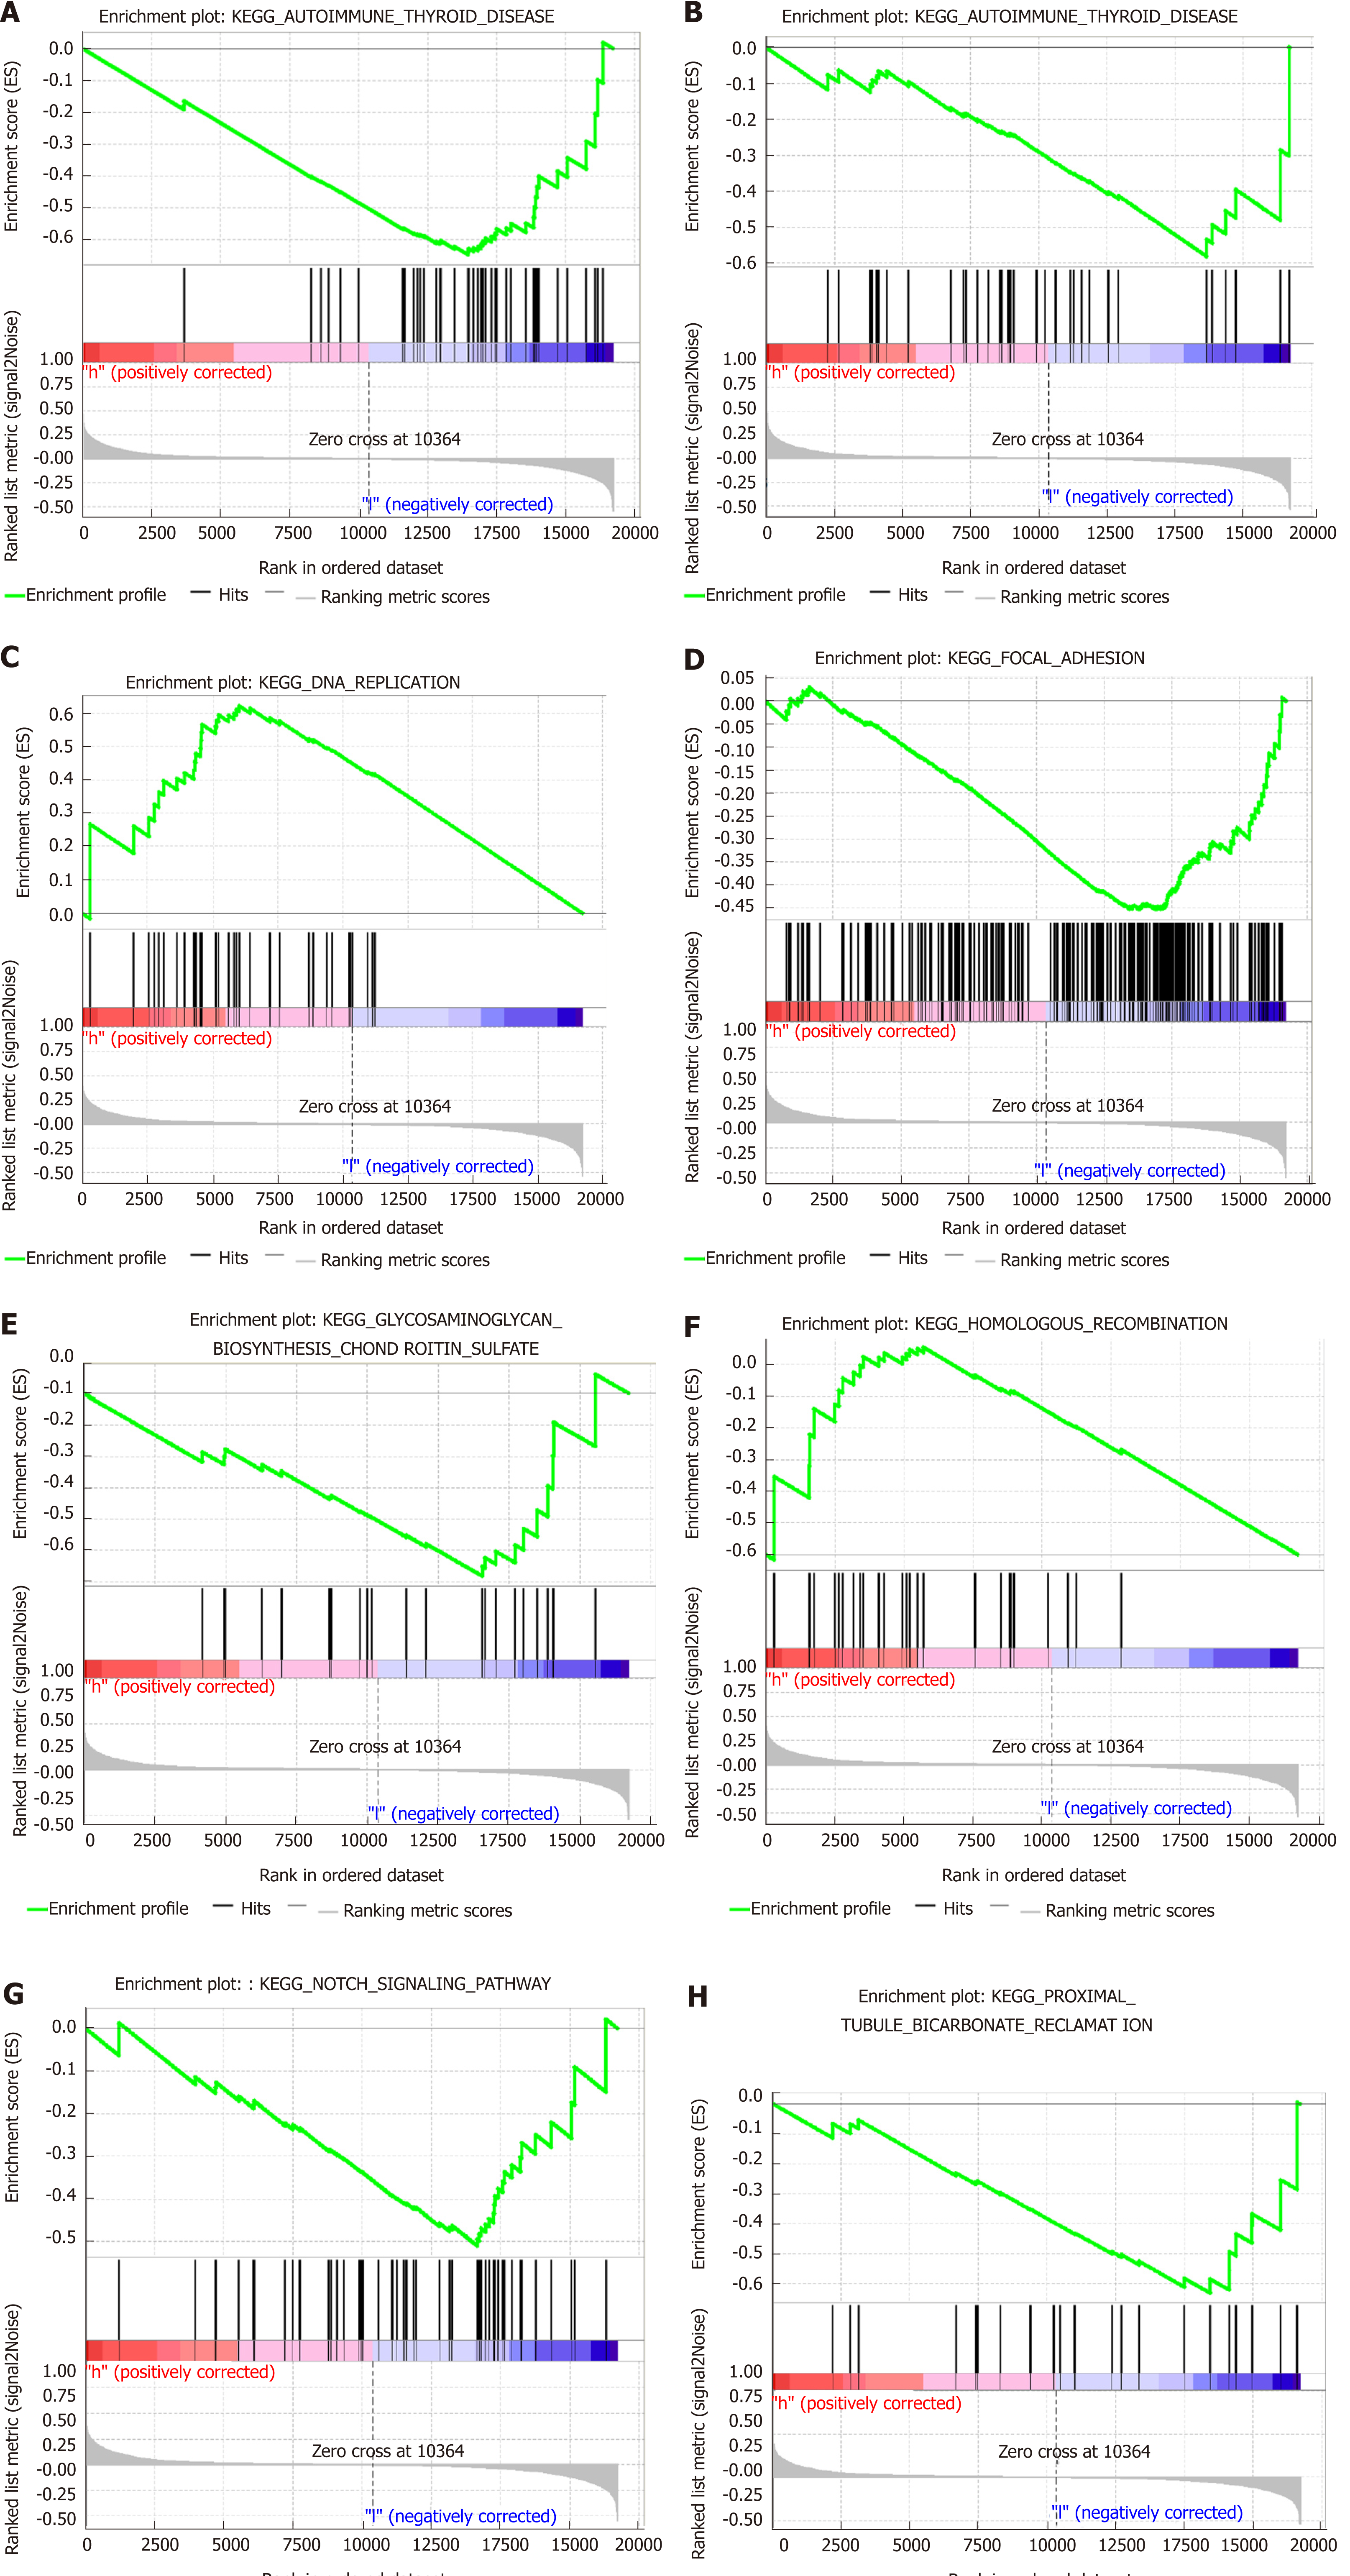
Figure 7 Gene set enrichment analysis delineating the biological pathways related to the immunoscore values using the “c2.
cp.kegg.v6.2.symbols” gene sets.
- Citation: Chen QF, Li W, Wu PH, Shen LJ, Huang ZL. Significance of tumor-infiltrating immunocytes for predicting prognosis of hepatitis B virus-related hepatocellular carcinoma. World J Gastroenterol 2019; 25(35): 5266-5282
- URL: https://www.wjgnet.com/1007-9327/full/v25/i35/5266.htm
- DOI: https://dx.doi.org/10.3748/wjg.v25.i35.5266


