Copyright
©The Author(s) 2019.
World J Gastroenterol. Sep 21, 2019; 25(35): 5266-5282
Published online Sep 21, 2019. doi: 10.3748/wjg.v25.i35.5266
Published online Sep 21, 2019. doi: 10.3748/wjg.v25.i35.5266
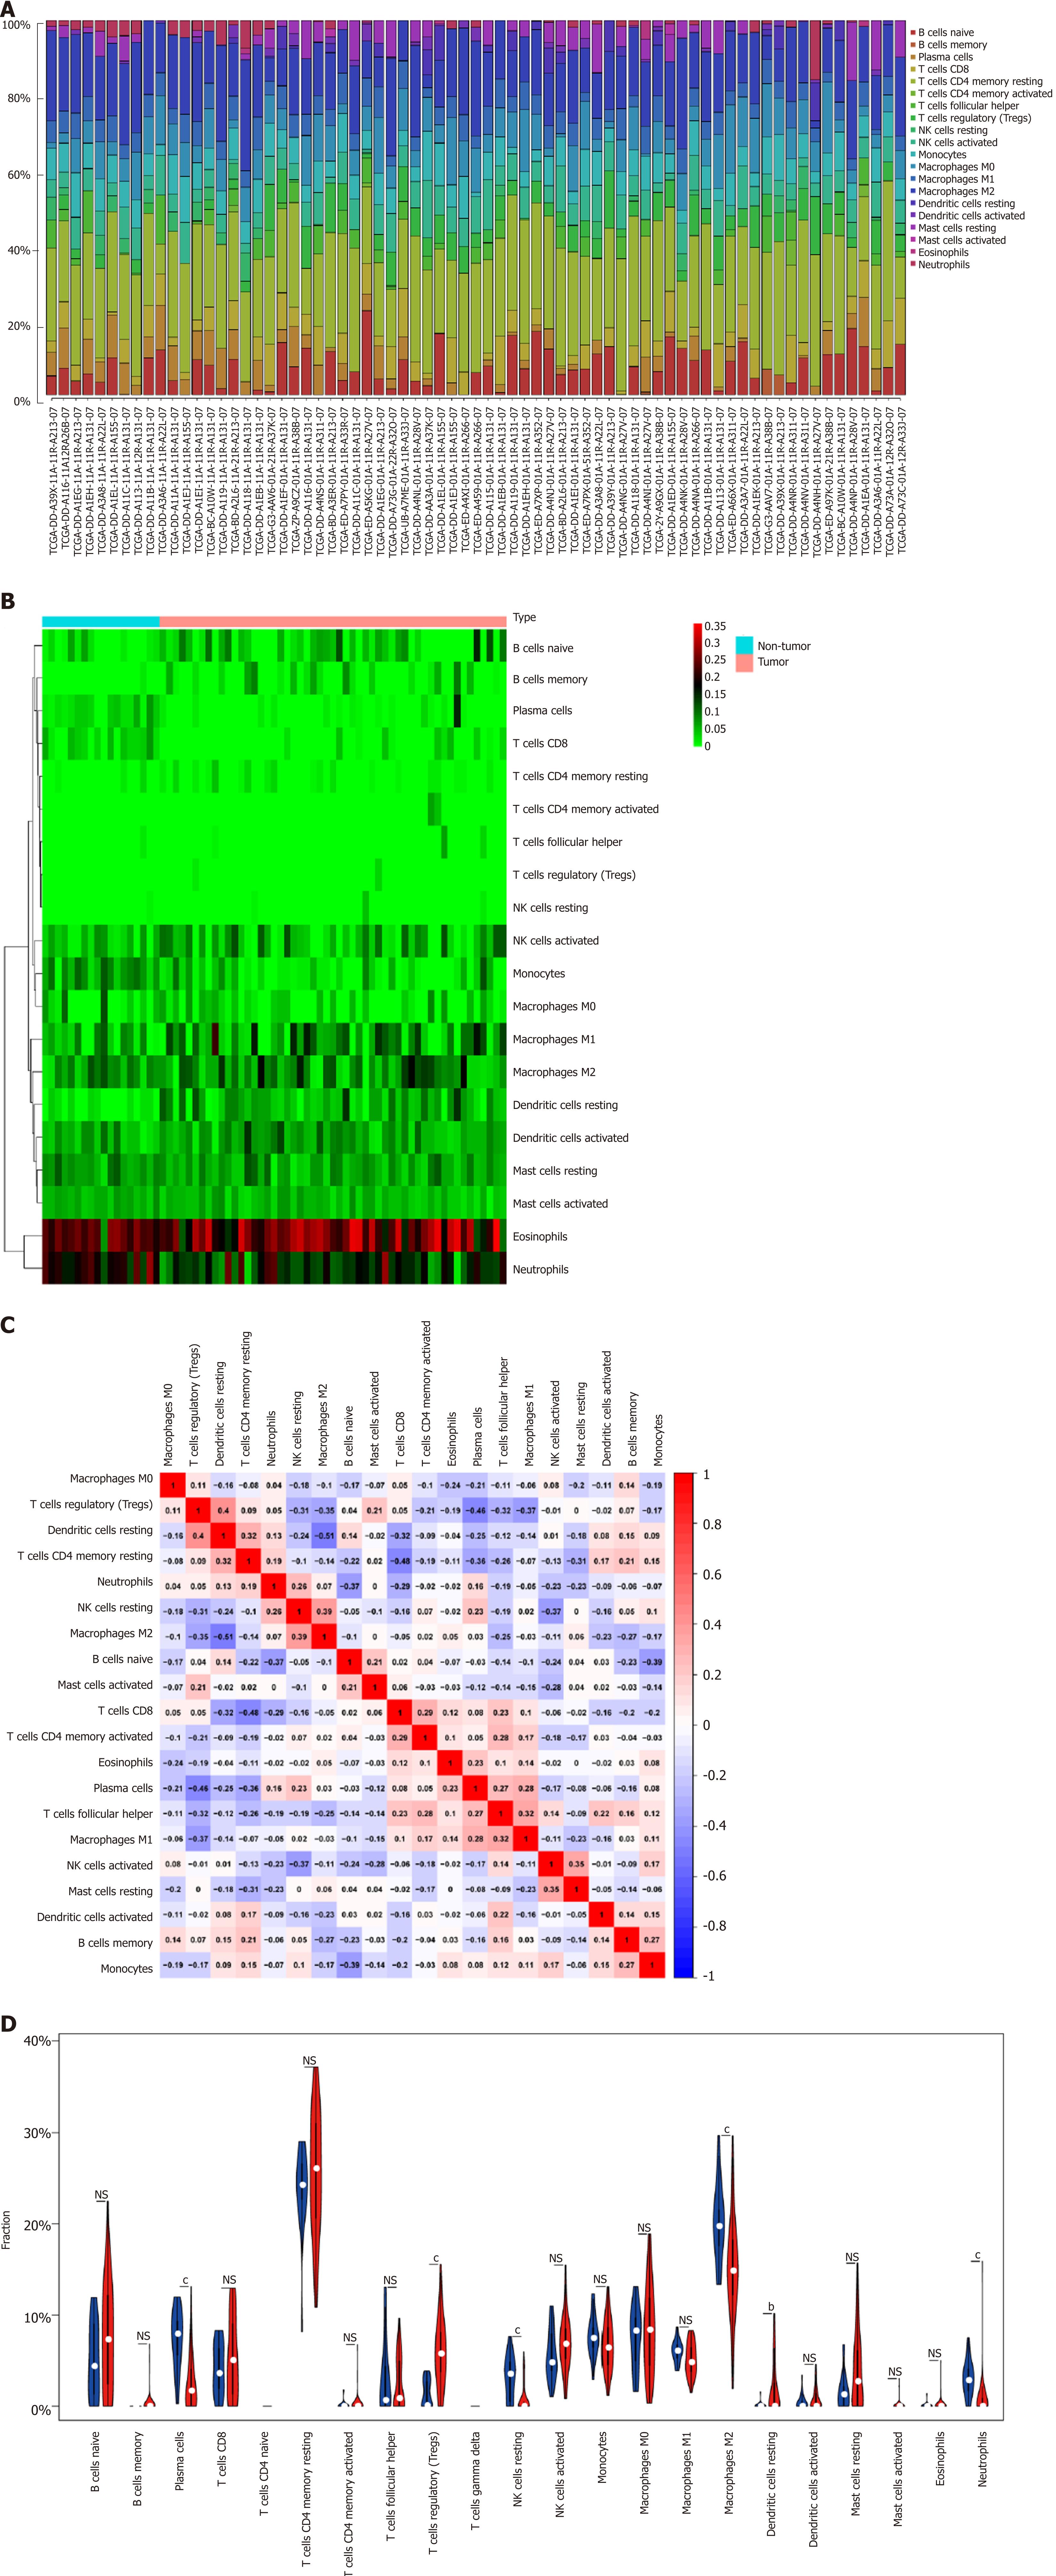
Figure 2 Immune infiltrate landscape for hepatitis B virus-related hepatocellular carcinoma.
A: Immune infiltrate composition in each sample. B: Heatmap showing the 20 fractions of immunocytes, where the horizontal axis displays samples that were classified as two leading clusters; C: Correlation matrix for the 20 immunocyte proportions as well as the immunocyte lytic activity. Variables were sorted according to the mean linkage clustering; D: Violin plot showing differential expression of 20 immunocytes. bP < 0.01, cP < 0.001. NS: Not significant.
- Citation: Chen QF, Li W, Wu PH, Shen LJ, Huang ZL. Significance of tumor-infiltrating immunocytes for predicting prognosis of hepatitis B virus-related hepatocellular carcinoma. World J Gastroenterol 2019; 25(35): 5266-5282
- URL: https://www.wjgnet.com/1007-9327/full/v25/i35/5266.htm
- DOI: https://dx.doi.org/10.3748/wjg.v25.i35.5266


