Copyright
©The Author(s) 2019.
World J Gastroenterol. Sep 7, 2019; 25(33): 4904-4920
Published online Sep 7, 2019. doi: 10.3748/wjg.v25.i33.4904
Published online Sep 7, 2019. doi: 10.3748/wjg.v25.i33.4904
Figure 1 Metabolic parameters in ob/ob mice fed amylin liver non-alcoholic steatohepatitis (AMLN) or Gubra amylin non-alcoholic steatohepatitis (GAN) diet for 8-16 wk.
A: Body weight; B: Body composition; C: Terminal liver weight (week 16); D: An intraperitoneal glucose tolerance test (ipGTT) was performed in week 7 of the feeding period, glucose excursion curves; E: Glucose area under the curve (AUC, 0-180 min); F: Plasma insulin (0, 15, 30 min). aP < 0.05, bP < 0.01, cP < 0.001 vs chow-fed C57BL/6J (Chow C57) controls; dP < 0.001 vs amylin liver non-alcoholic steatohepatitis (AMLN) diet (n = 5-6 mice per group). AMLN: Amylin liver non-alcoholic steatohepatitis diet; GAN: Gubra amylin non-alcoholic steatohepatitis diet; iPGTT: Intraperitoneal glucose tolerance test.
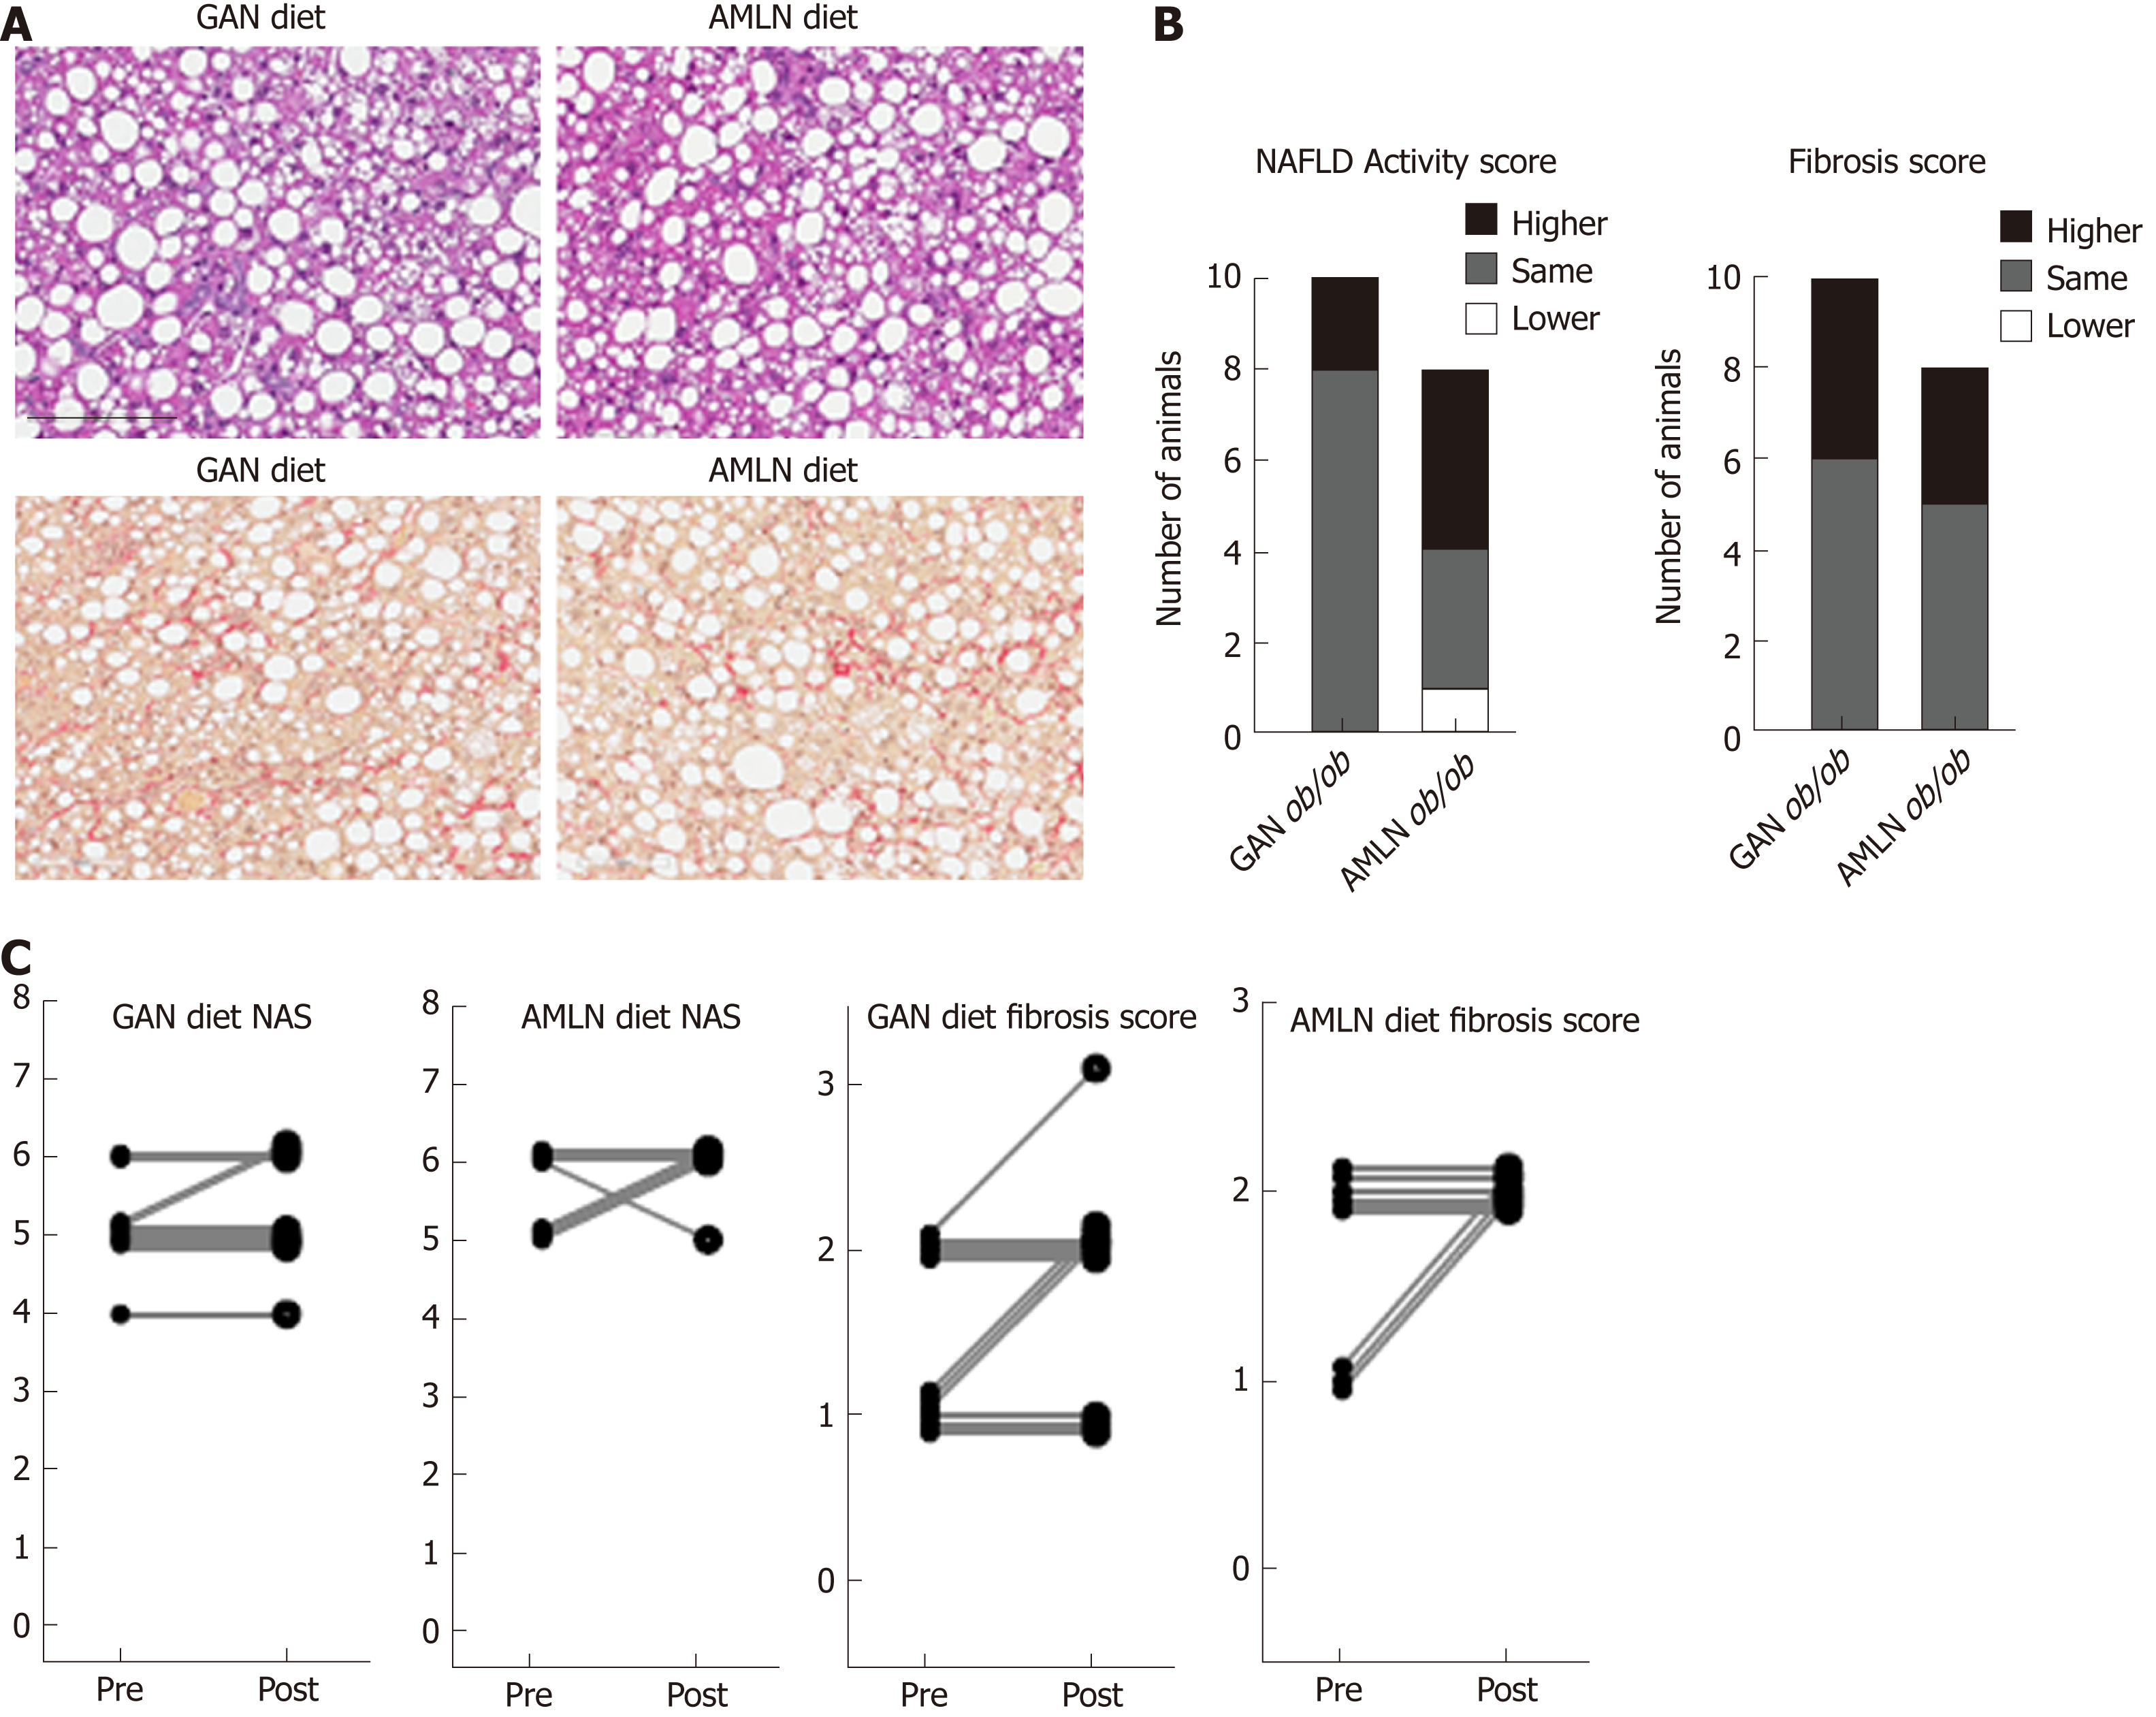
Figure 2 Liver biopsy-confirmed non-alcoholic fatty liver disease activity score and fibrosis scores in ob/ob mice fed amylin liver non-alcoholic steatohepatitis (AMLN) or Gubra amylin non-alcoholic steatohepatitis (GAN) diet for 16 wk.
A: Representative images of terminal liver morphology (upper panel: hematoxylin-eosin staining, lower panel: Picro-Sirus red staining, 20× magnification, scale bar 100 µm); B: Number of animals with higher, same or lower post-biopsy histopathology score compared to corresponding pre-biopsy score (n = 8-10 mice per group). Left panel: Non-alcoholic fatty liver disease activity score (NAS); right panel: Fibrosis score; C: Individual pre-biopsy and terminal NAS and fibrosis scores. AMLN: Amylin liver non-alcoholic steatohepatitis diet; GAN: Gubra amylin non-alcoholic steatohepatitis diet; NAFLD: Non-alcoholic fatty liver disease; NAS: Non-alcoholic fatty liver disease activity score.
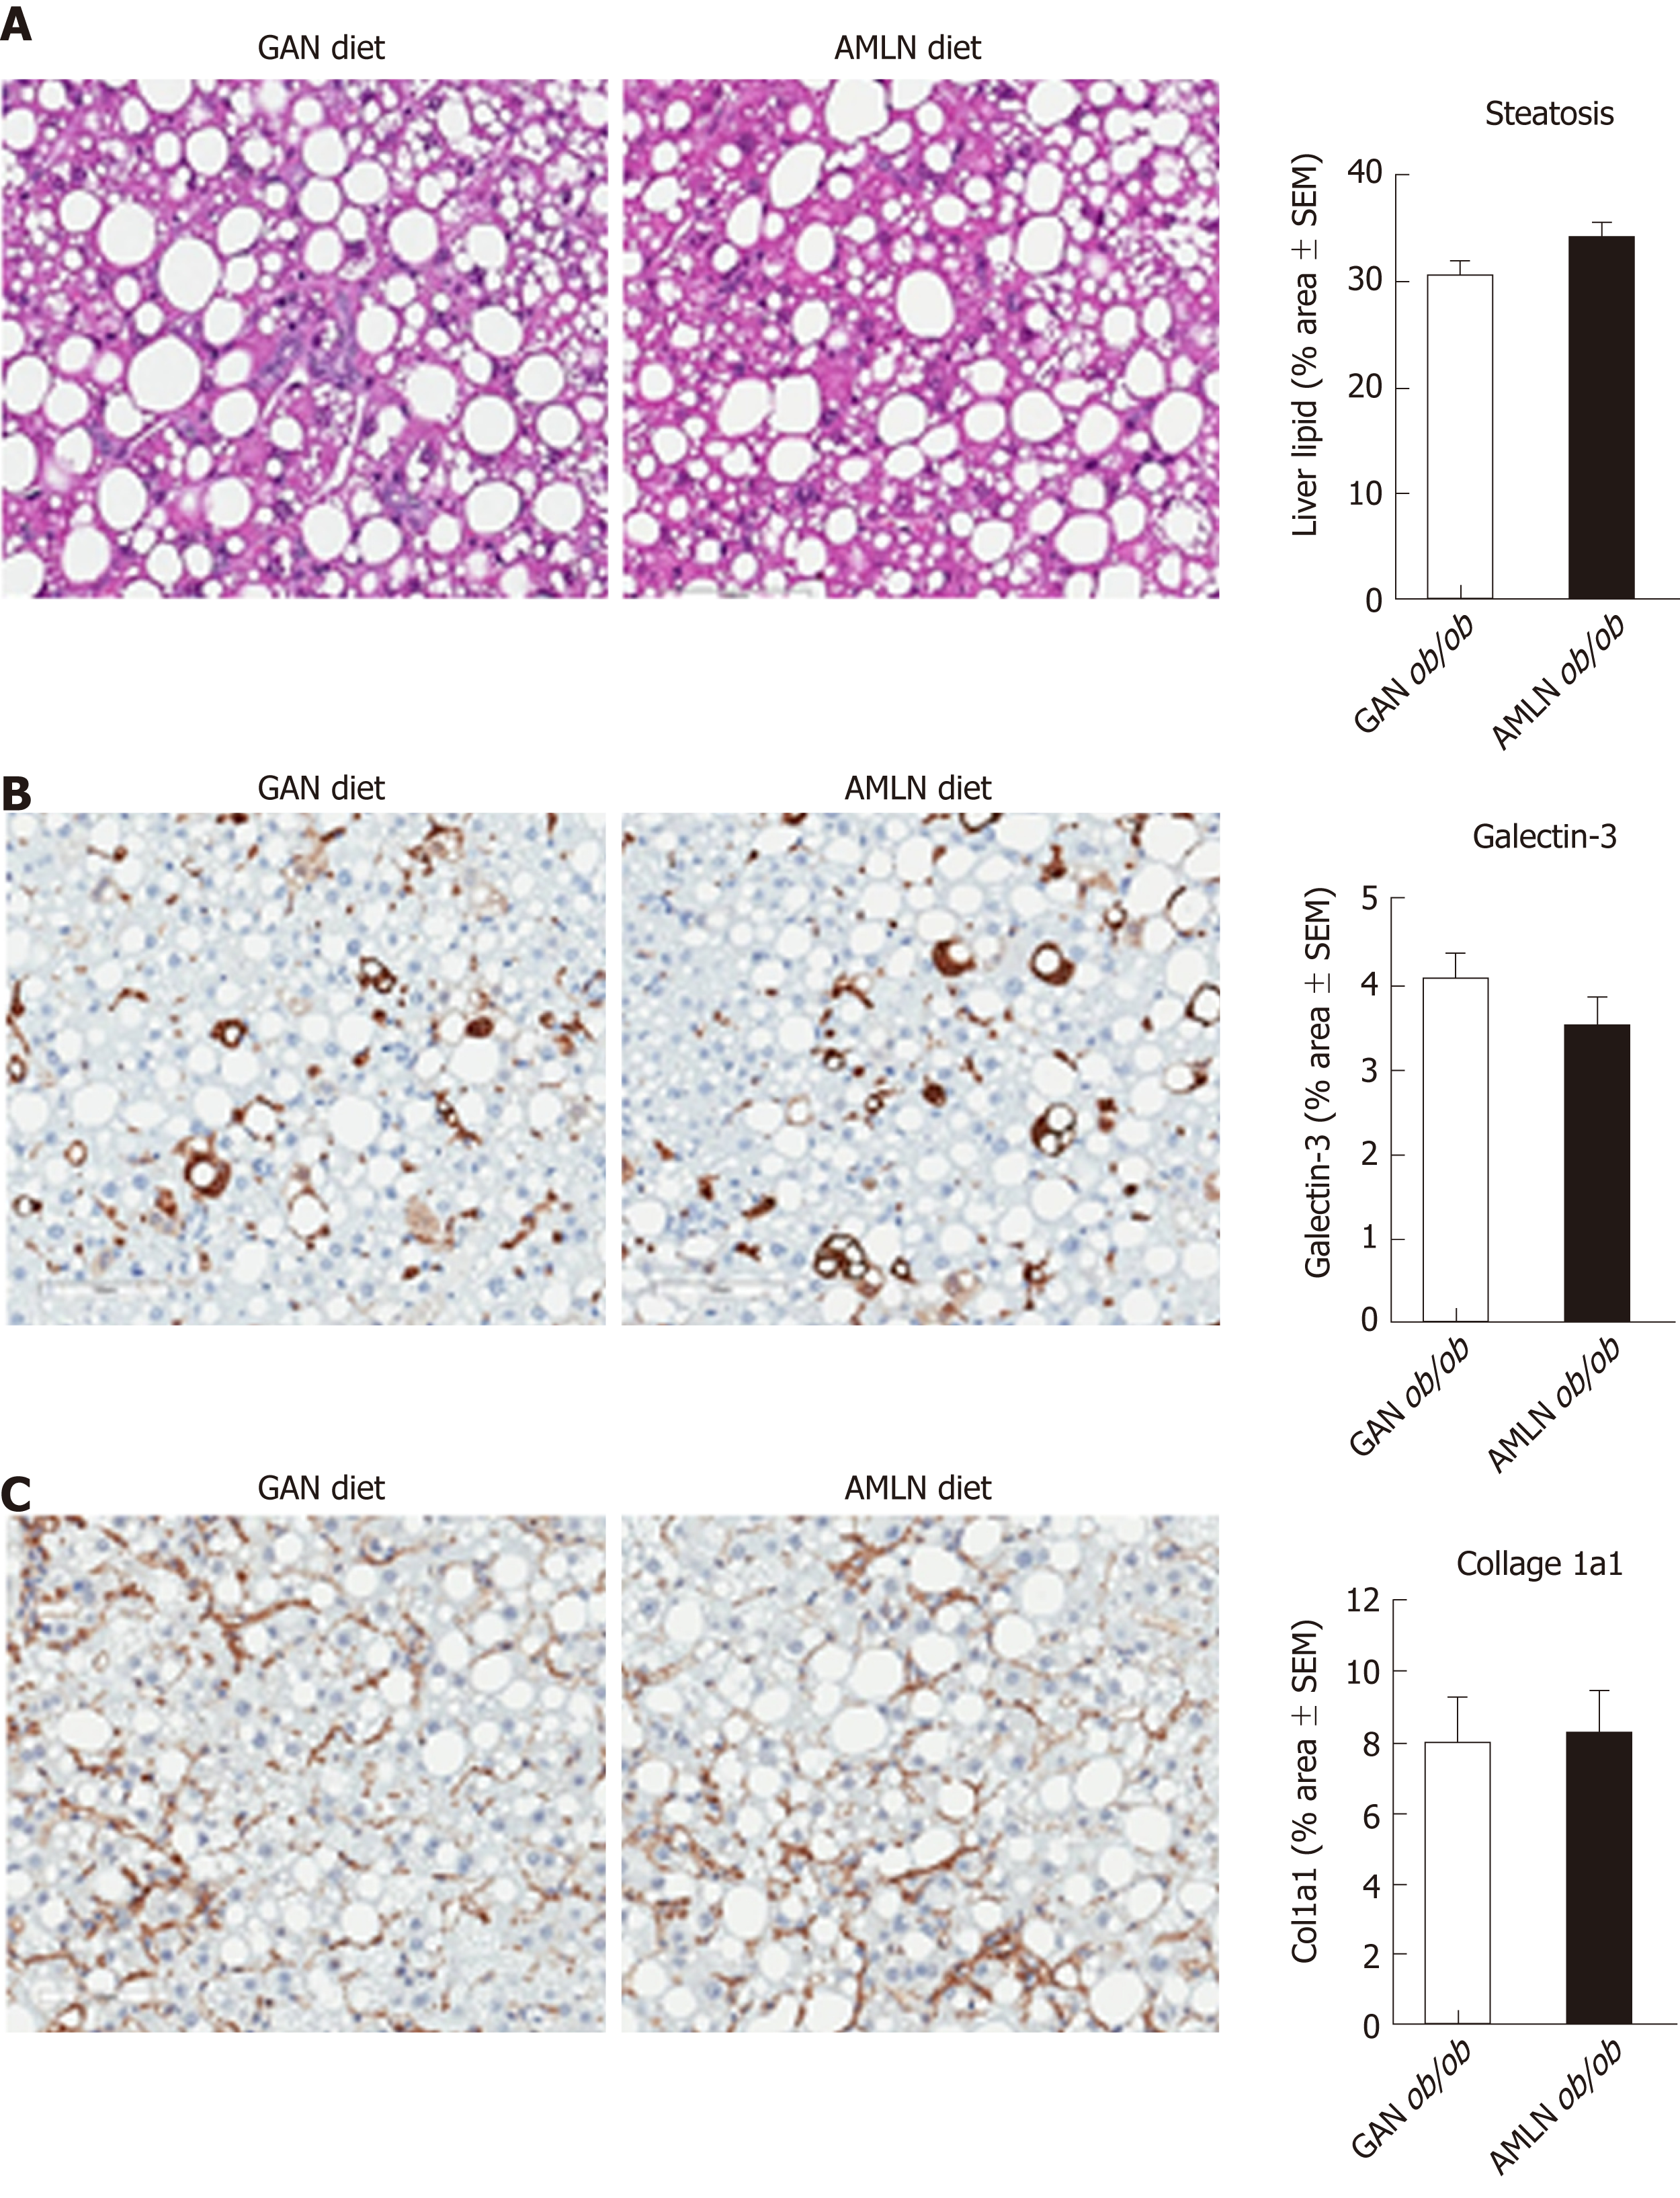
Figure 3 Quantitative histopathological changes in ob/ob mice fed amylin liver non-alcoholic steatohepatitis (AMLN) or Gubra amylin non-alcoholic steatohepatitis (GAN) diet for 16 wk.
Fractional (%) area of steatosis (hematoxylin-eosin staining), inflammation [galectin-3 immunostaining and fibrosis (collagen-1a1) immunostaining] determined by imaging-based morphometry (n = 8-10 mice per group). A: Steatosis; Galectin-3; C: Collagen-1a1. Scale bar 100 µm. AMLN: Amylin liver non-alcoholic steatohepatitis diet; GAN: Gubra amylin non-alcoholic steatohepatitis diet; Col1a1: Collagen-1a1.
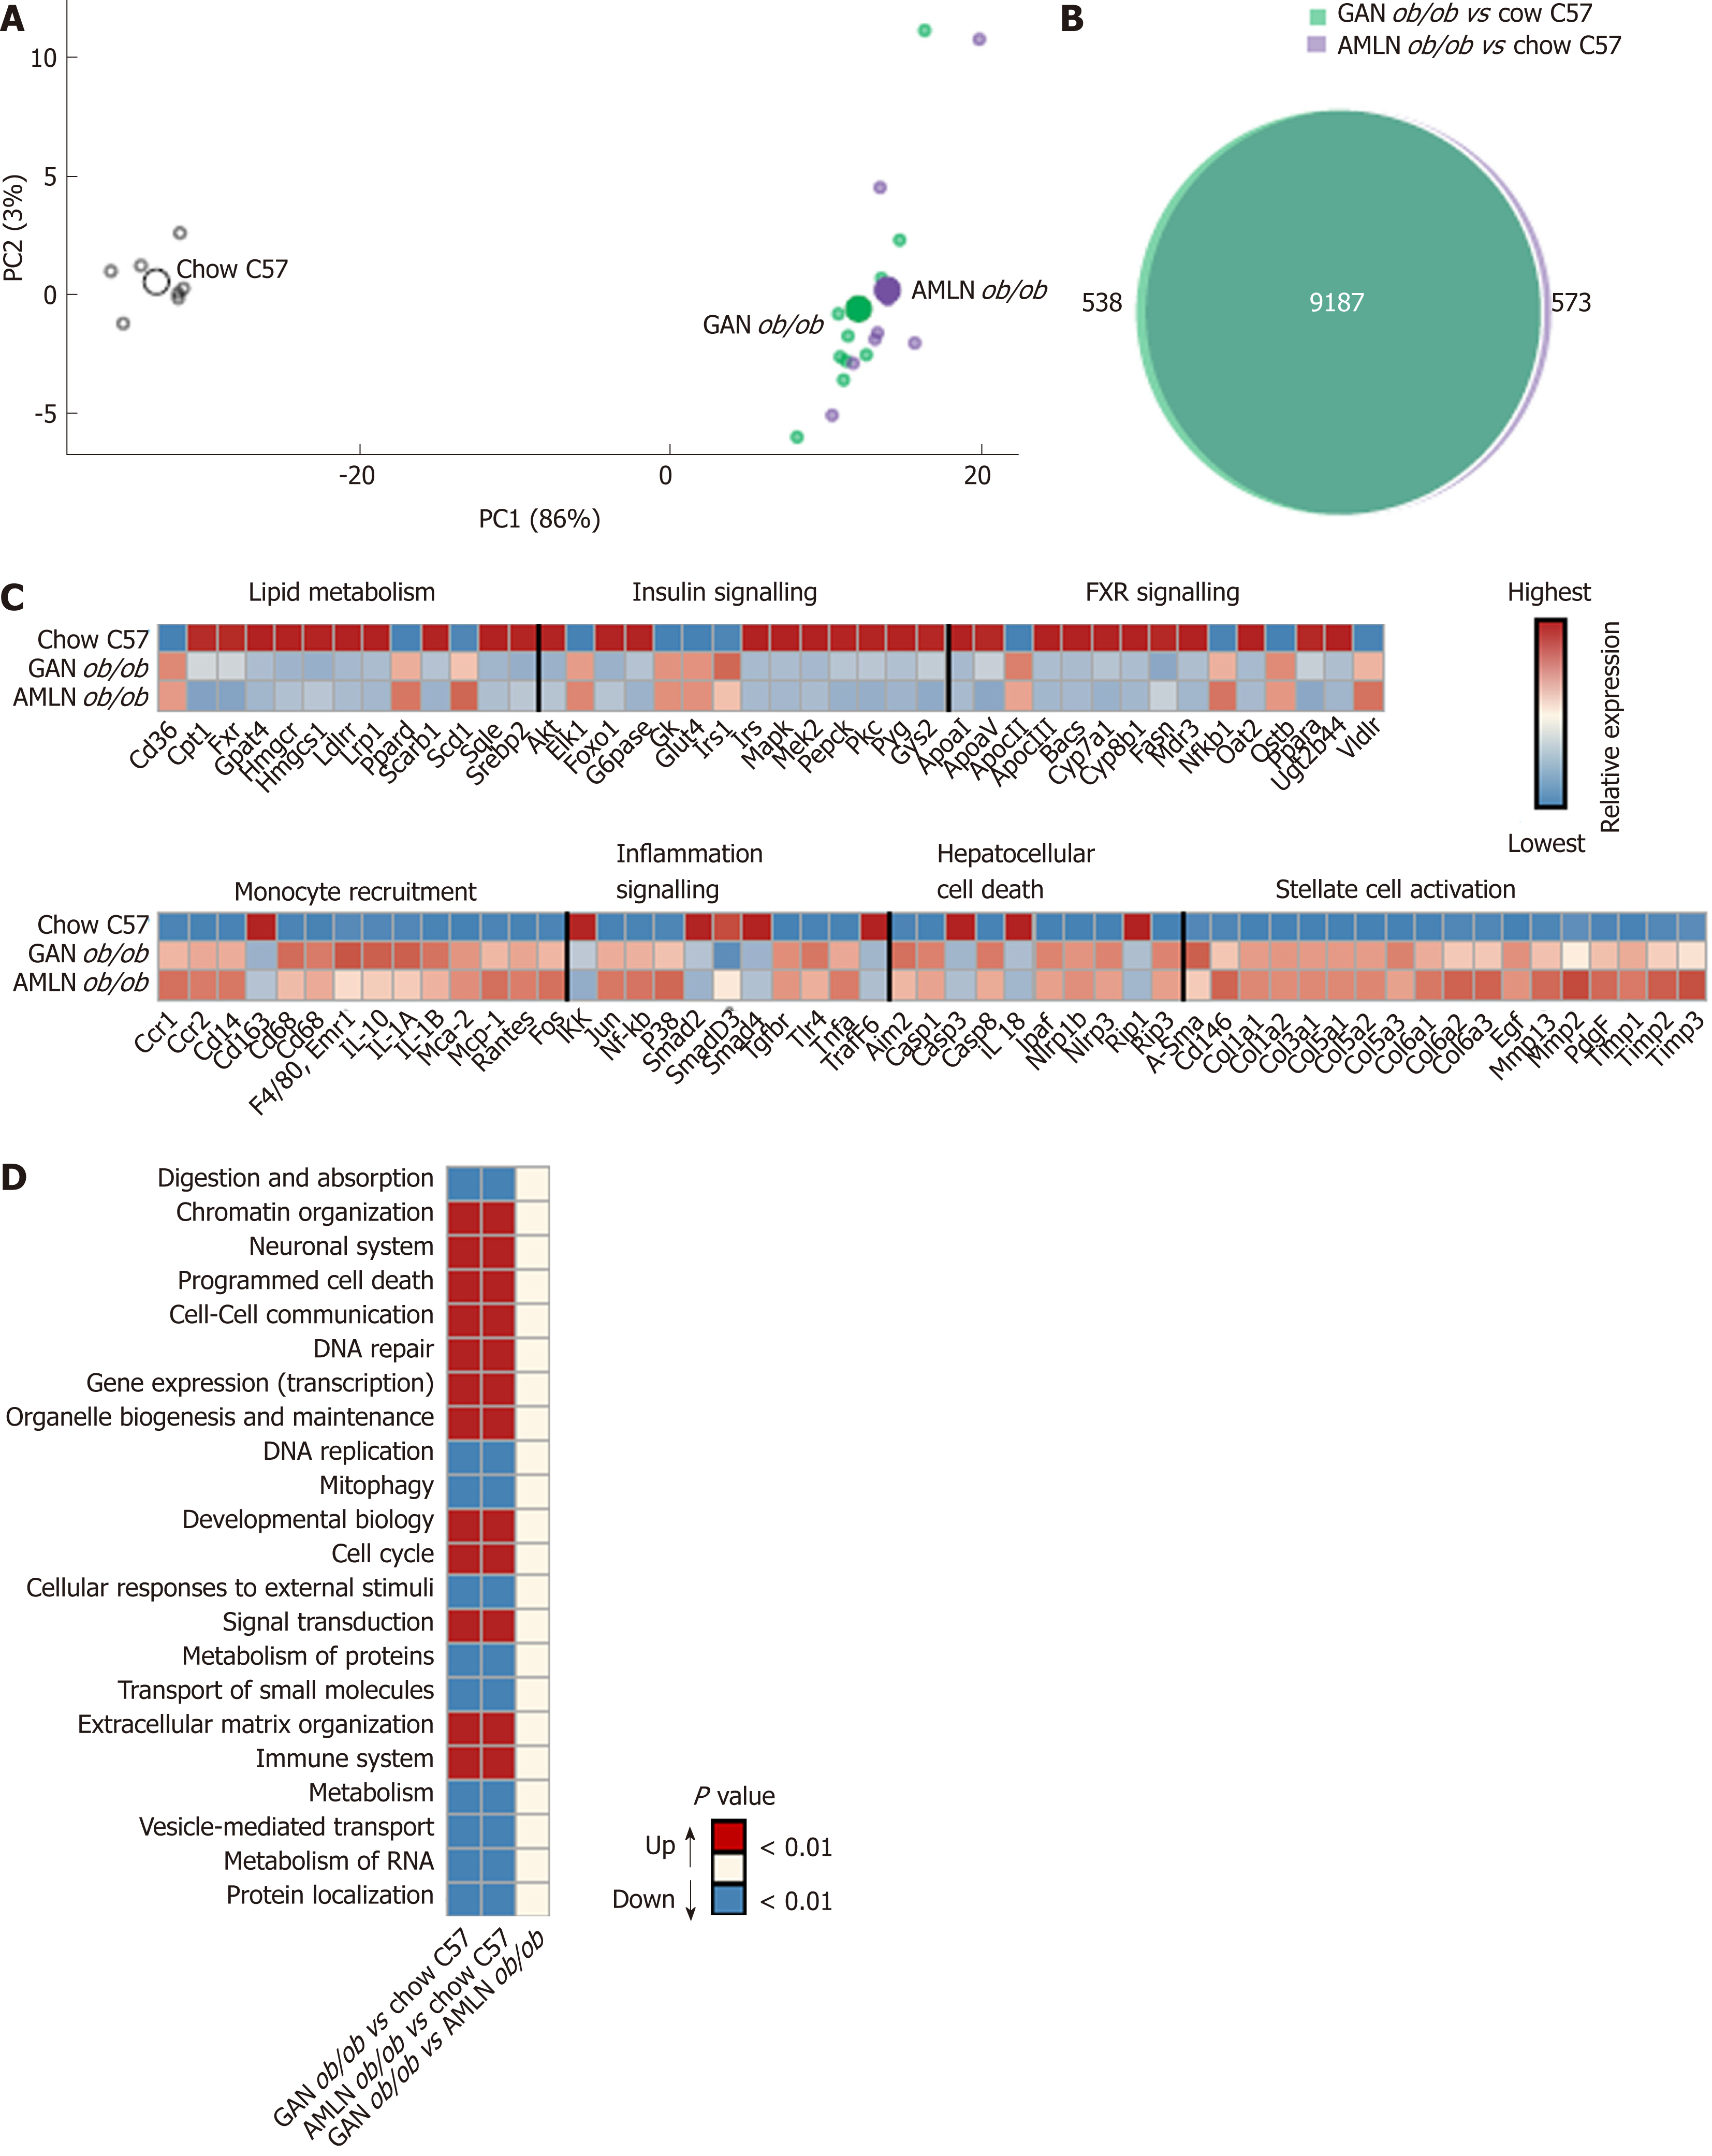
Figure 4 Liver transcriptome changes in ob/ob mice fed amylin liver non-alcoholic steatohepatitis (AMLN) or Gubra amylin non-alcoholic steatohepatitis (GAN) diet for 16 wk.
Overview of hepatic gene expression profiles in ob/ob mice fed amylin liver non-alcoholic steatohepatitis (AMLN) or Gubra amylin non-alcoholic steatohepatitis (GAN) diet compared to age-matched chow-fed ob/ob mice (n = 8-10 mice per group). A: Principal component analysis of samples based on top 500 most variable gene expression levels; B: Group-wise comparison of total number of differentially expressed genes (false discovery rate < 0.05) between ob/ob mice fed AMLN or GAN diet for 16 wk vs chow-fed C57BL/6J (Chow C57) mice; C: Relative gene expression levels (z-scores) of differentially regulated candidate genes associated with NASH and fibrosis. In-house gene panel on candidate genes is indicated in Supplemental Table 1; D: Group-wise comparison of global liver transcriptome changes according to enrichment of individual gene sets in the Reactome pathway database. Regulated pathways are ranked according to level of statistical significance (P value). AMLN: Amylin liver non-alcoholic steatohepatitis diet; GAN: Gubra amylin non-alcoholic steatohepatitis diet; NASH: Non-alcoholic steatohepatitis.
Figure 5 Liver histopathological scores and collagen 1a1 deposition in C57BL/6J mice fed chow, amylin liver non-alcoholic steatohepatitis (AMLN) or Gubra amylin non-alcoholic steatohepatitis (GAN) diet for 28 wk.
A: Steatosis; B: Lobular inflammation; C: Hepatocyte ballooning; D: Non-alcoholic fatty liver disease activity score (NAS); E: Fibrosis score; F: Collagen-1a1 fractional area (mean ± SEM). cP < 0.001 vs chow-fed C57BL/6J (Chow C57) mice. AMLN: Amylin liver non-alcoholic steatohepatitis diet; GAN: Gubra amylin non-alcoholic steatohepatitis diet; NASH: Non-alcoholic steatohepatitis.
- Citation: Boland ML, Oró D, Tølbøl KS, Thrane ST, Nielsen JC, Cohen TS, Tabor DE, Fernandes F, Tovchigrechko A, Veidal SS, Warrener P, Sellman BR, Jelsing J, Feigh M, Vrang N, Trevaskis JL, Hansen HH. Towards a standard diet-induced and biopsy-confirmed mouse model of non-alcoholic steatohepatitis: Impact of dietary fat source. World J Gastroenterol 2019; 25(33): 4904-4920
- URL: https://www.wjgnet.com/1007-9327/full/v25/i33/4904.htm
- DOI: https://dx.doi.org/10.3748/wjg.v25.i33.4904


