Copyright
©The Author(s) 2019.
World J Gastroenterol. Jun 21, 2019; 25(23): 2898-2910
Published online Jun 21, 2019. doi: 10.3748/wjg.v25.i23.2898
Published online Jun 21, 2019. doi: 10.3748/wjg.v25.i23.2898
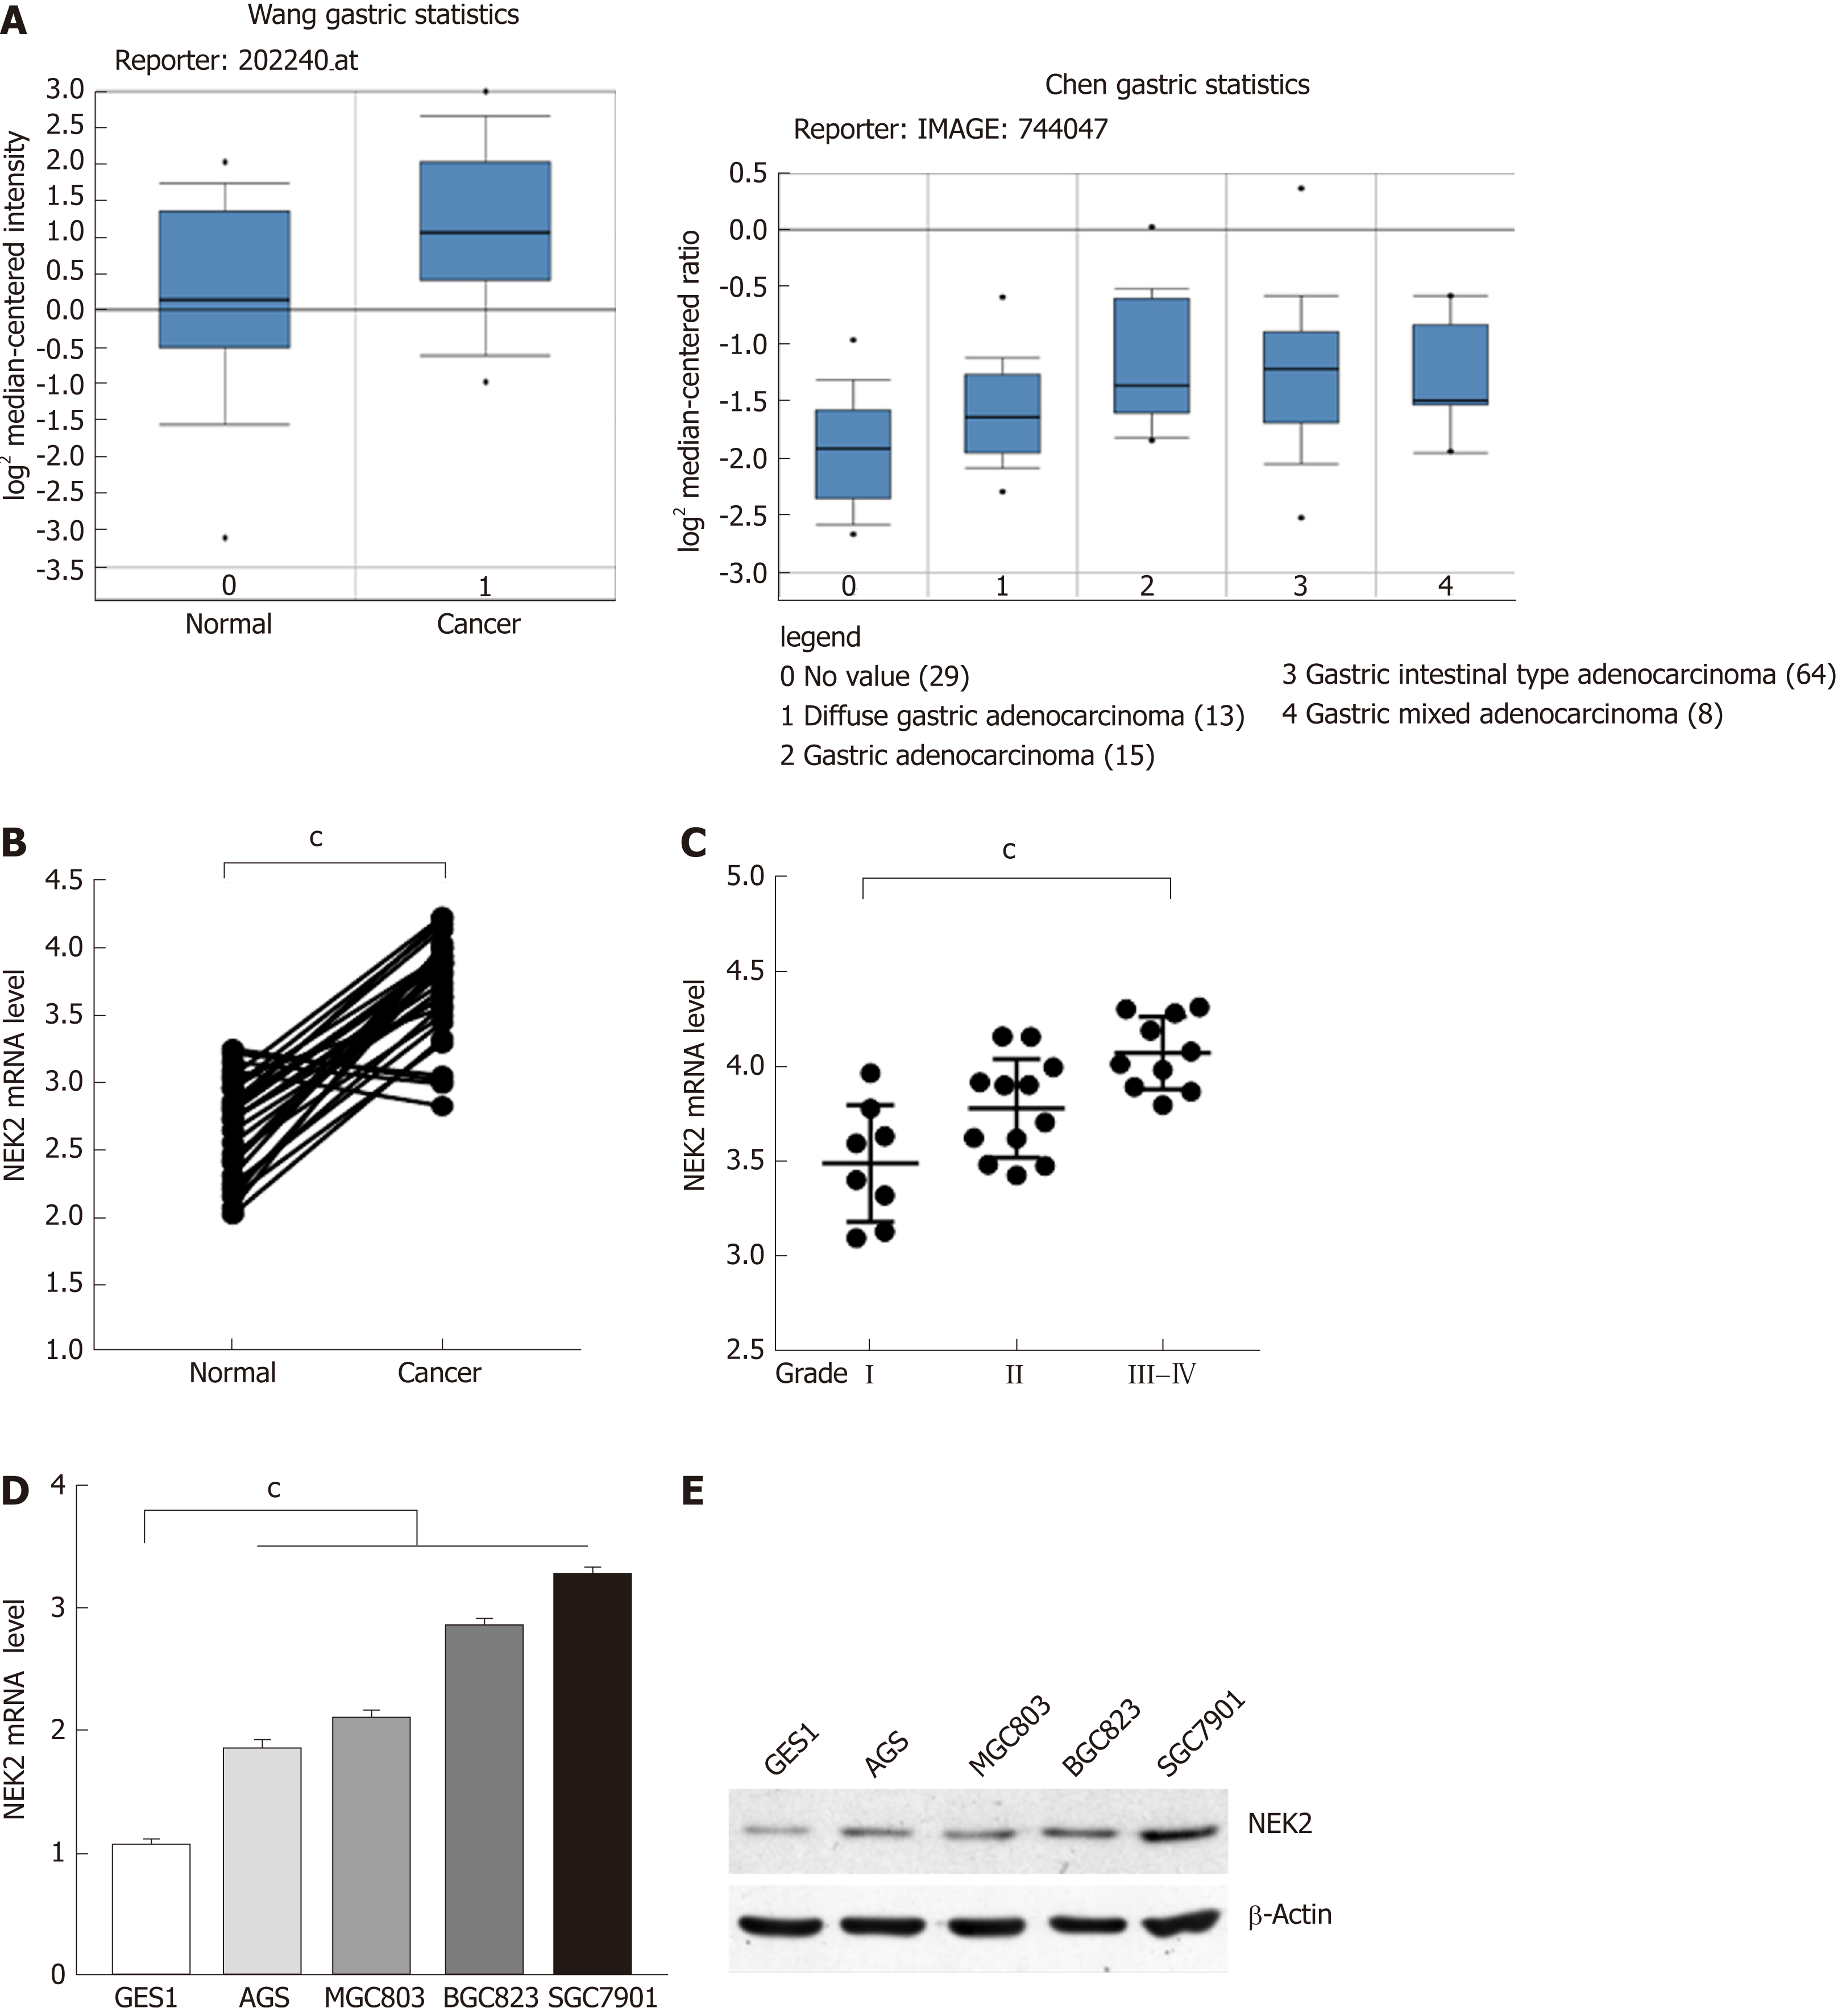
Figure 1 Expression of NIMA related kinase 2 in tissues and cells of gastric cancer.
A: Relative mRNA expression level of NIMA related kinase 2 (NEK2) in gastric cancer and normal tissues (datasets from Oncomine). B: Relative mRNA expression level of NEK2 analyzed by quantitative real-time PCR in 30 pairs of human gastric cancer tissues (Cancer) and adjacent tissues (Normal). (Paired t-test, P < 0.001). C: The mRNA expression level of NEK2 in different grades of cancer samples. Data represents the mean ± SD of three replicates. D: Relative NEK2 mRNA expression level in four gastric cancer cell lines compared to gastric mucosal epithelial cell line (GES1). E: Relative NEK2 protein expression level in different gastric cancer cell lines. β-actin was used as the loading control. NEK2: NIMA related kinase 2.
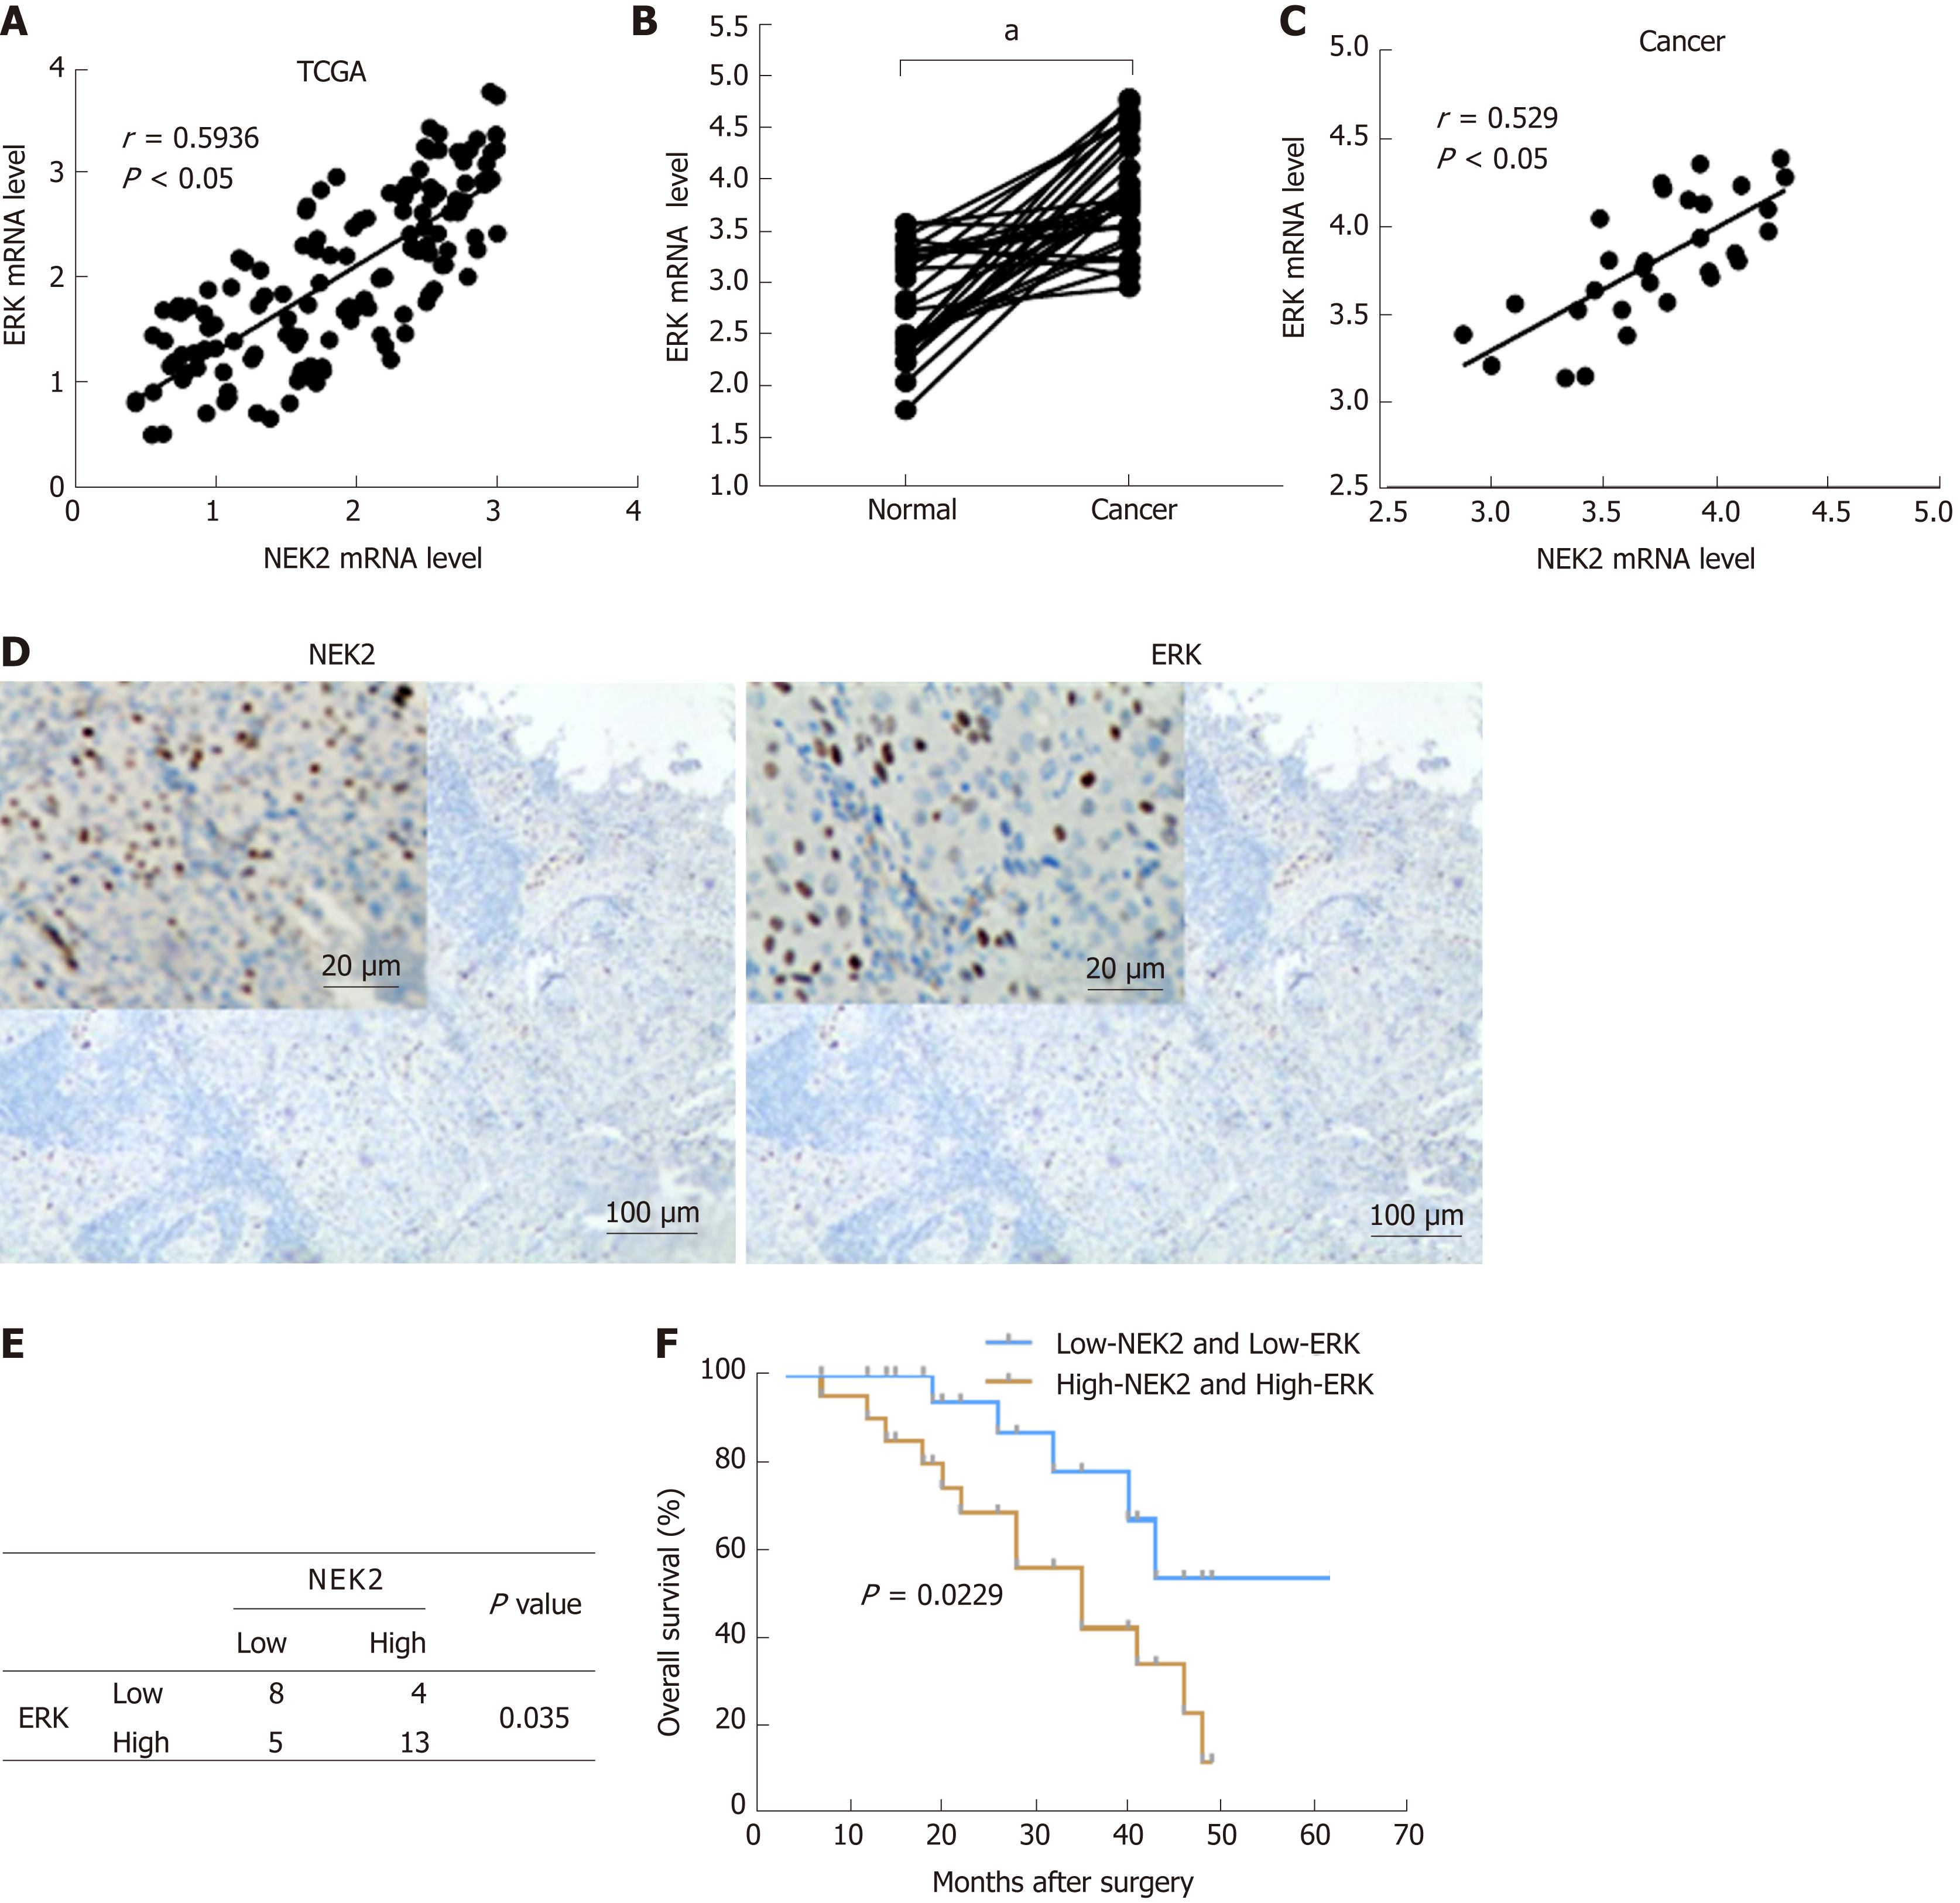
Figure 2 Combined NIMA related kinase 2 and ERK expression may predict overall survival in patients with gastric cancer.
A: ERK co-expressed with NIMA related kinase 2 (NEK2) in gastric cancer (datasets from TCGA). B: Relative mRNA expression level of ERK analyzed by quantitative real-time PCR in 30 pairs of human gastric cancer tissues. C: ERK expression is significantly correlated to NEK2 expression in human gastric cancer tissues. D: Immunohistochemistry analysis of NEK2 and ERK expression in serial gastric cancer samples. E: Correlation between NEK2 and ERK expression. F: Overall survival of patients with gastric cancer calculated using Kaplan–Meier analysis according to the staining level. NEK2: NIMA related kinase 2.
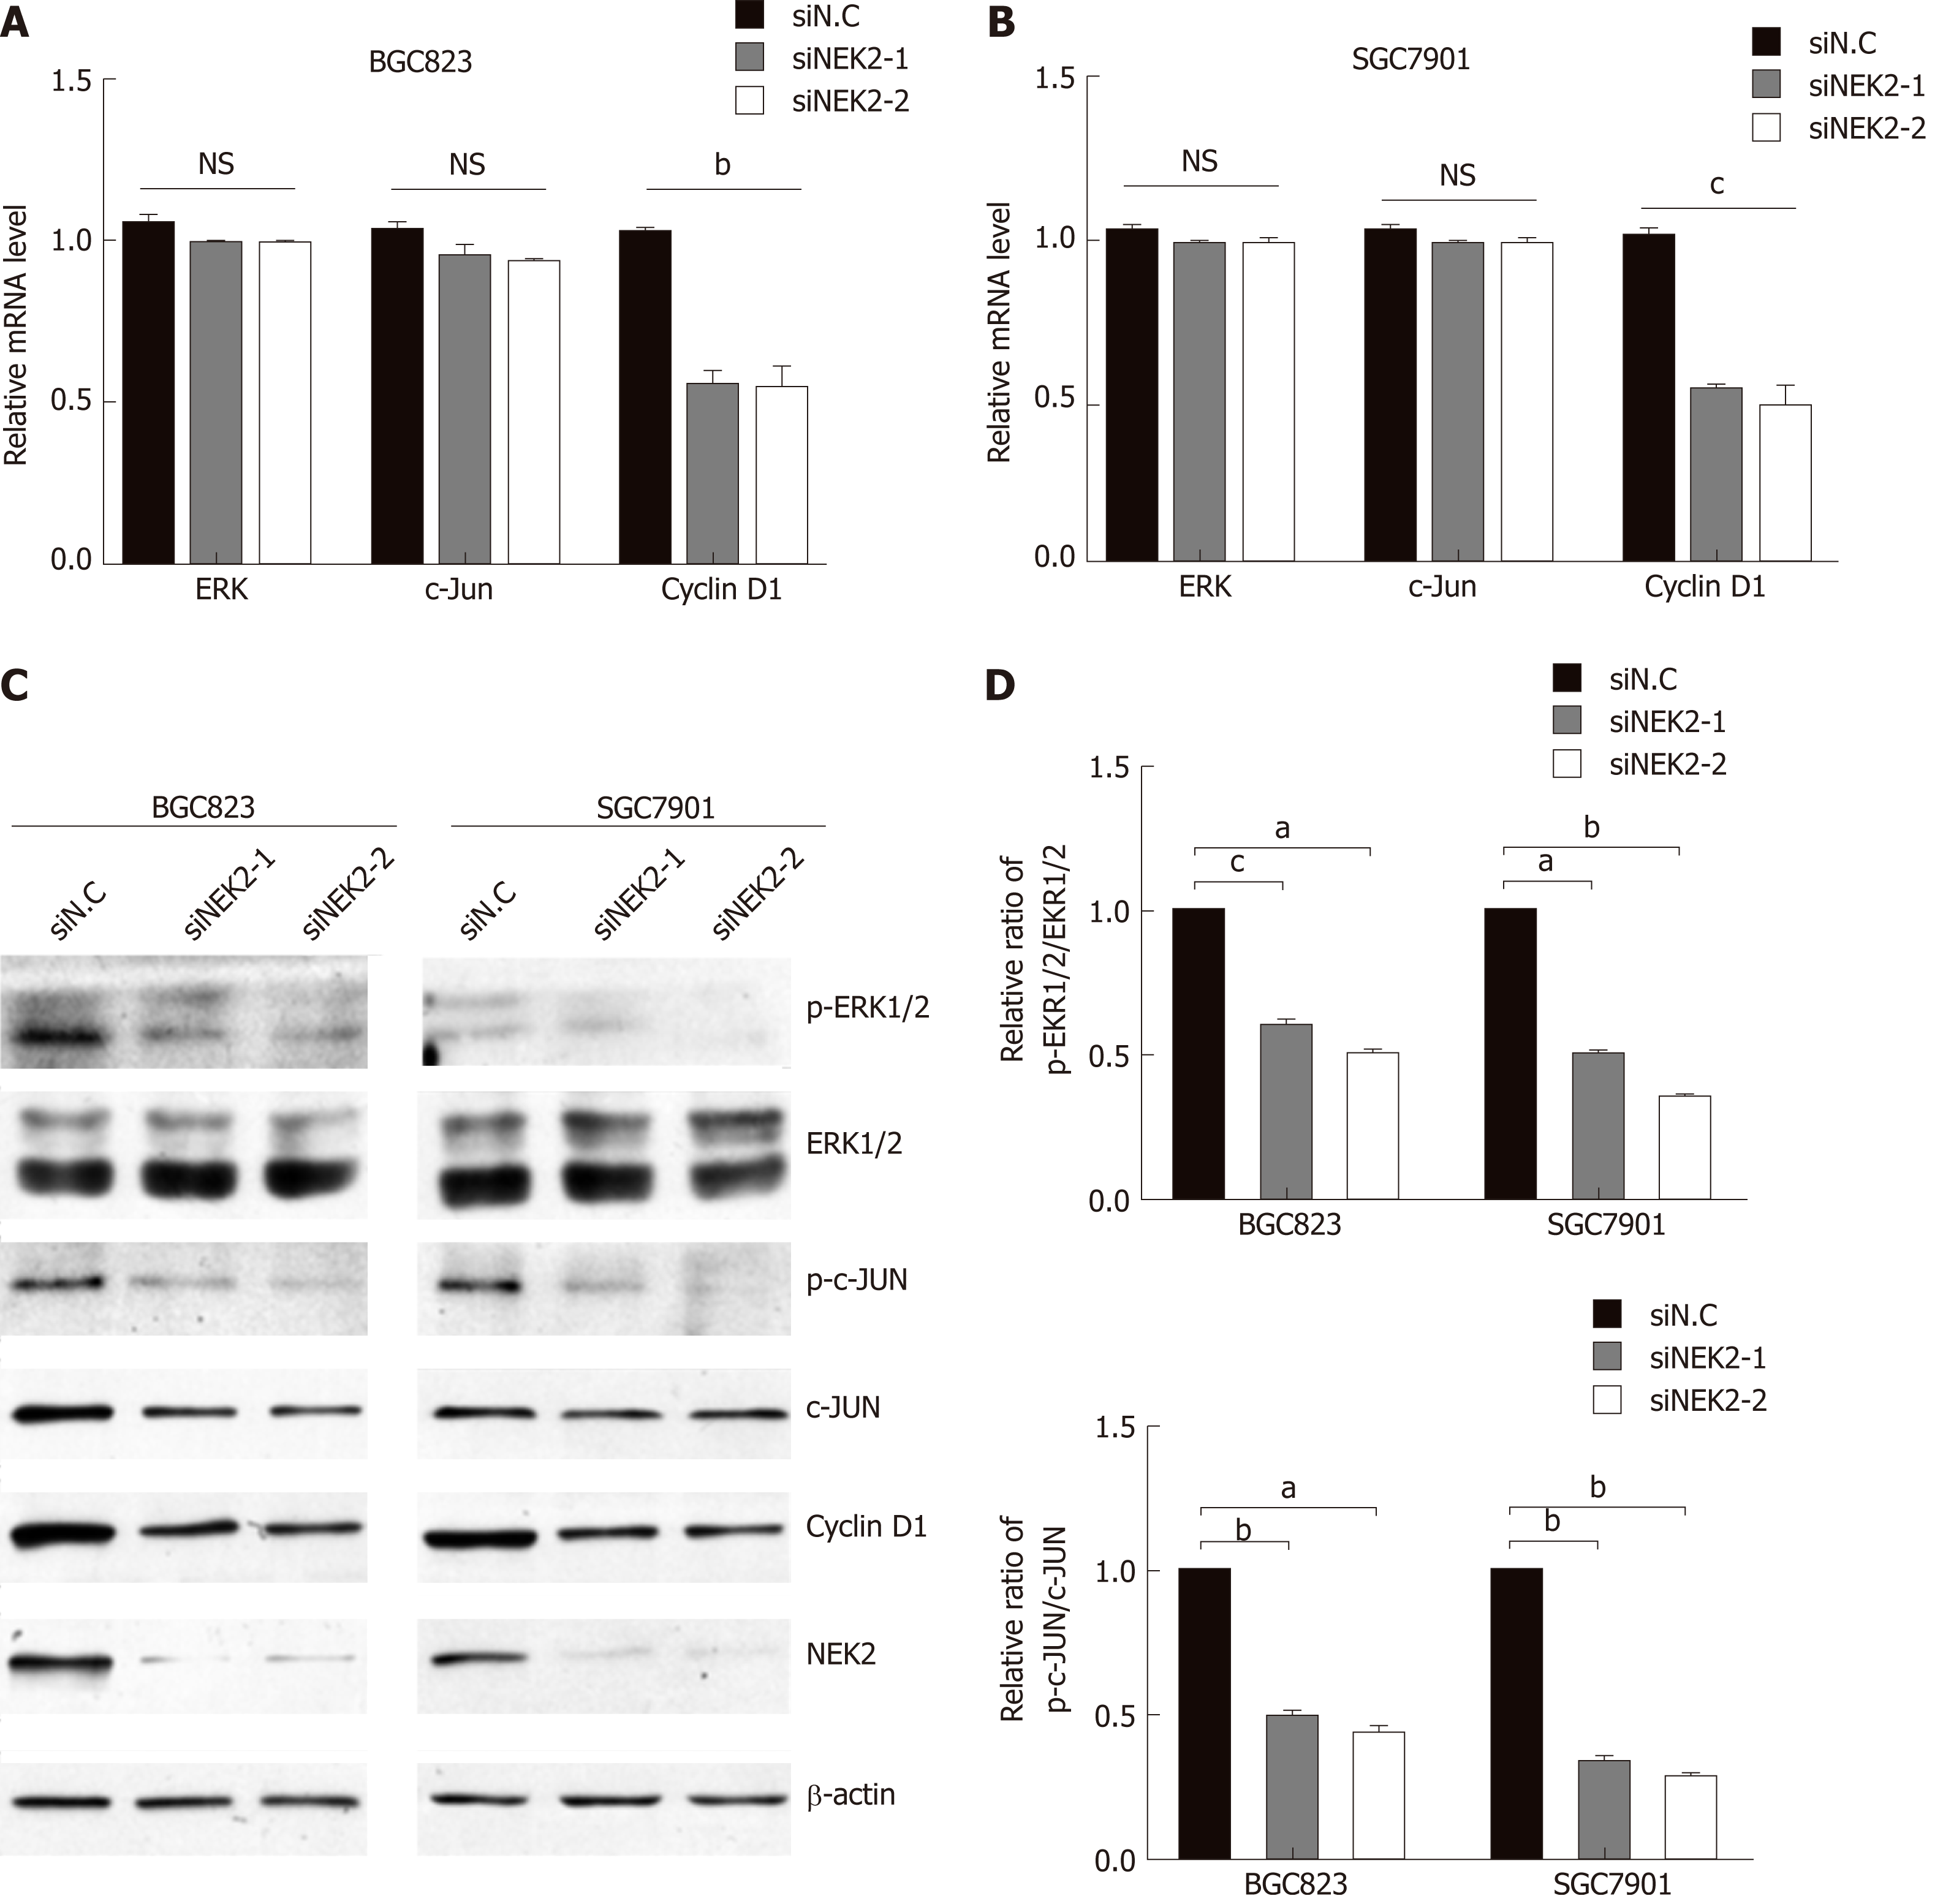
Figure 3 NIMA related kinase 2 mediates the activation of ERK/MAPK signaling.
A and B: Relative mRNA expression of ERK/MAPK signaling key factors analyzed by quantitative real-time PCR in NIMA related kinase 2 (NEK2) silenced BGC823 and SGC7901 cell lines and negative controls. C: Western blot analysis of ERK/MAPK signaling key factors (ERK, c-JUN, and cyclin D1) and their phosphorylated forms (p-ERK and p-c-JUN) in NEK2 silenced BGC823 and SGC7901 cell lines and negative controls. D: Relative phosphorylation levels of ERK and c-JUN in C were calculated. β-actin was used as the internal control. Values are presented as the mean ± SEM. NEK2: NIMA related kinase 2.
Figure 4 NIMA related kinase 2 promotes gastric cancer cell viability, proliferation, and cell cycle progression via ERK/MAPK signaling.
A and B: Relative mRNA and protein expression of cyclin D1 in cell lines with ERK silencing and NEK2 overexpression. C and D: CCK8 assay showing cell viability in BGC823 and SGC7901 cell lines and negative controls. E: Flow cytometry analysis of cell cycle distribution in BGC823 and SGC7901 cell lines. F: Quantification of the data shown in E (n = 3). G: EdU incorporation assay showing the percentage of cells in S-phase. H: Quantification of the data shown in G (n = 3). NEK2: NIMA related kinase 2.
- Citation: Fan WD, Chen T, Liu PJ. NIMA related kinase 2 promotes gastric cancer cell proliferation via ERK/MAPK signaling. World J Gastroenterol 2019; 25(23): 2898-2910
- URL: https://www.wjgnet.com/1007-9327/full/v25/i23/2898.htm
- DOI: https://dx.doi.org/10.3748/wjg.v25.i23.2898


