Copyright
©The Author(s) 2019.
World J Gastroenterol. May 14, 2019; 25(18): 2204-2216
Published online May 14, 2019. doi: 10.3748/wjg.v25.i18.2204
Published online May 14, 2019. doi: 10.3748/wjg.v25.i18.2204
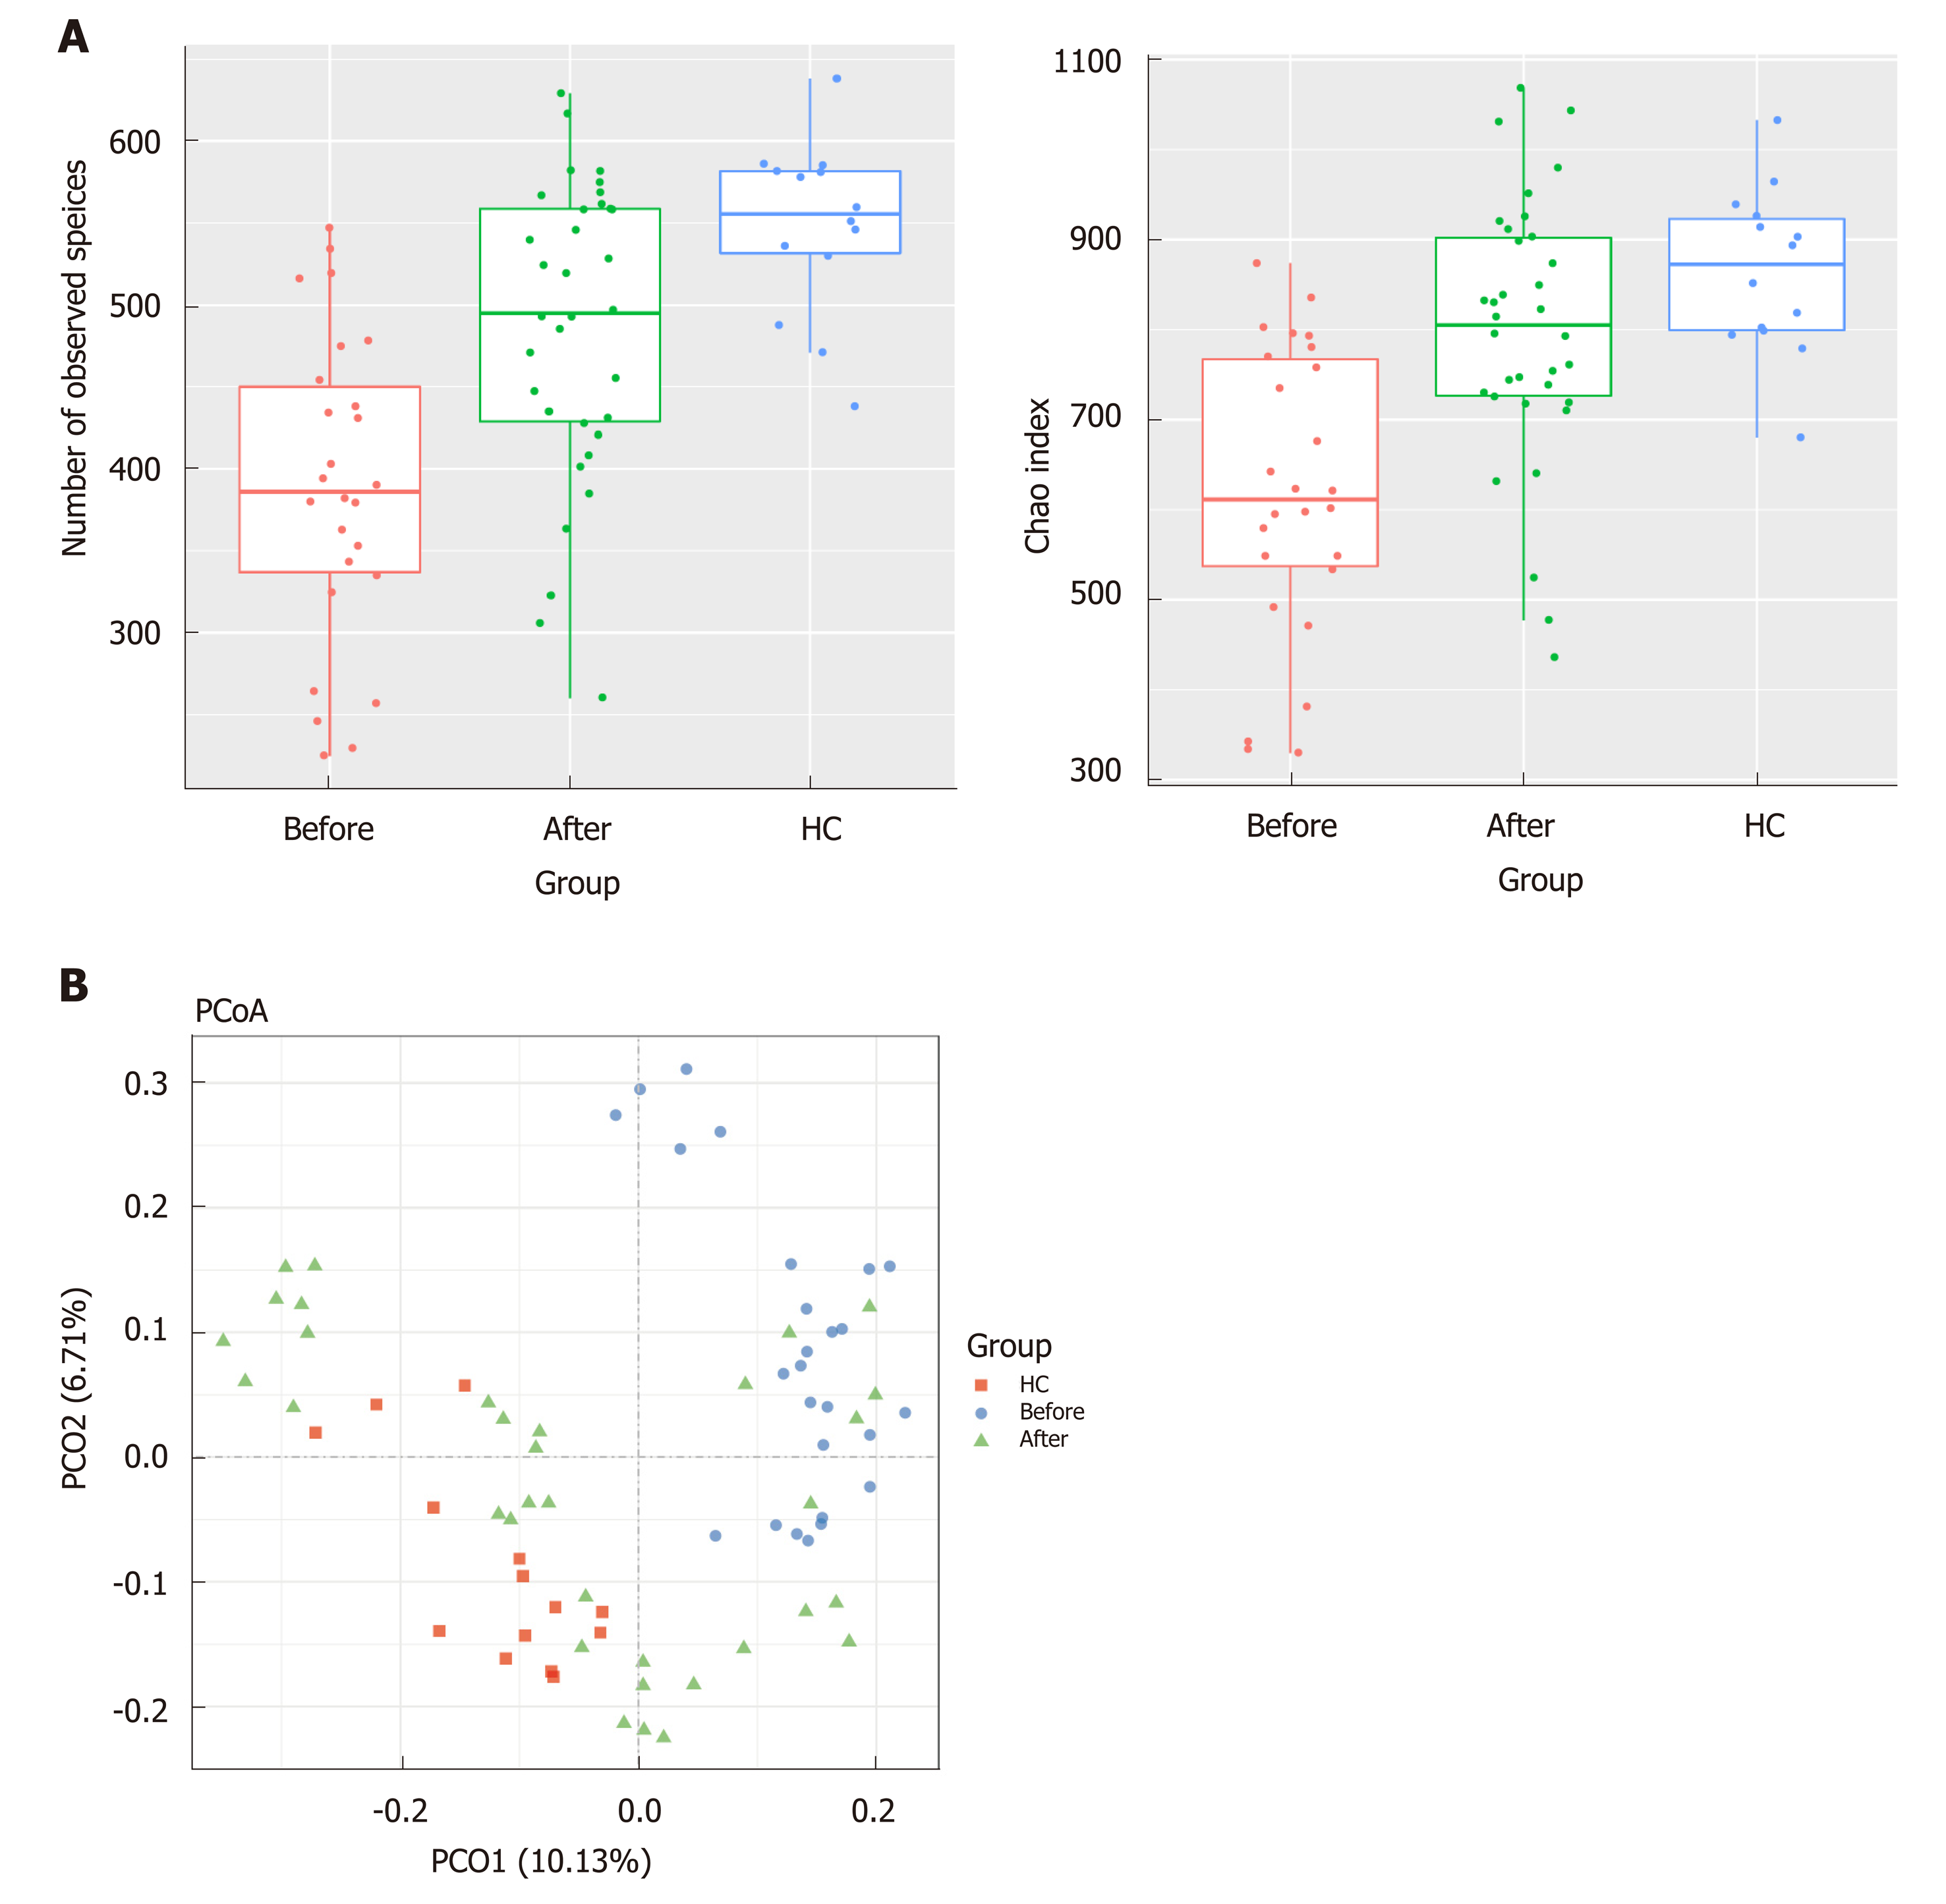
Figure 1 Richness and diversity in the mucosa-associated microbiota of the patients with Crohn’s disease and healthy controls before and after induction of remission.
A: The number of observed species was 388.26 ± 94.22 in the Before group, 475.03 ± 96.01 in the After group and 547.85 ± 52.85 in the healthy controls (HC) group. The Chao1 index was 617.78 ± 161.04 in the Before group, 771.40 ± 146.62 in the After group and 864.08 ± 91.59 in the HC group; B: Plots shown were generated using the weighted version of the UniFrac-based Principal coordinate analysis. Samples from After group (green triangle) clustered separately from Before group (blue circle) while got close to the HC group (red square). HC: Healthy controls.
Figure 2 The microbial dysbiosis index characterizes the activity of Crohn’s disease.
A: The composition of mucosa-associated microbiota at phylum level; B: The heatmap of 65 differentially abundant genera between patients before and after treatment. Each column represented a mucosal sample from patients before and after treatment as well as healthy controls. The first letter means the site of the colon (L: Ascending colon; R: Descending colon; i: Terminal ileum; Z: Rectum); C: The identified 65 genera were used to calculate the microbial dysbiosis index (MDI). The Pearson correlation analysis was constructed between MDI and the Crohn’s disease activity index as well as MDI and Chao index. MDI: Microbial dysbiosis index; HC: Healthy controls; CDAI: Crohn’s disease activity index.
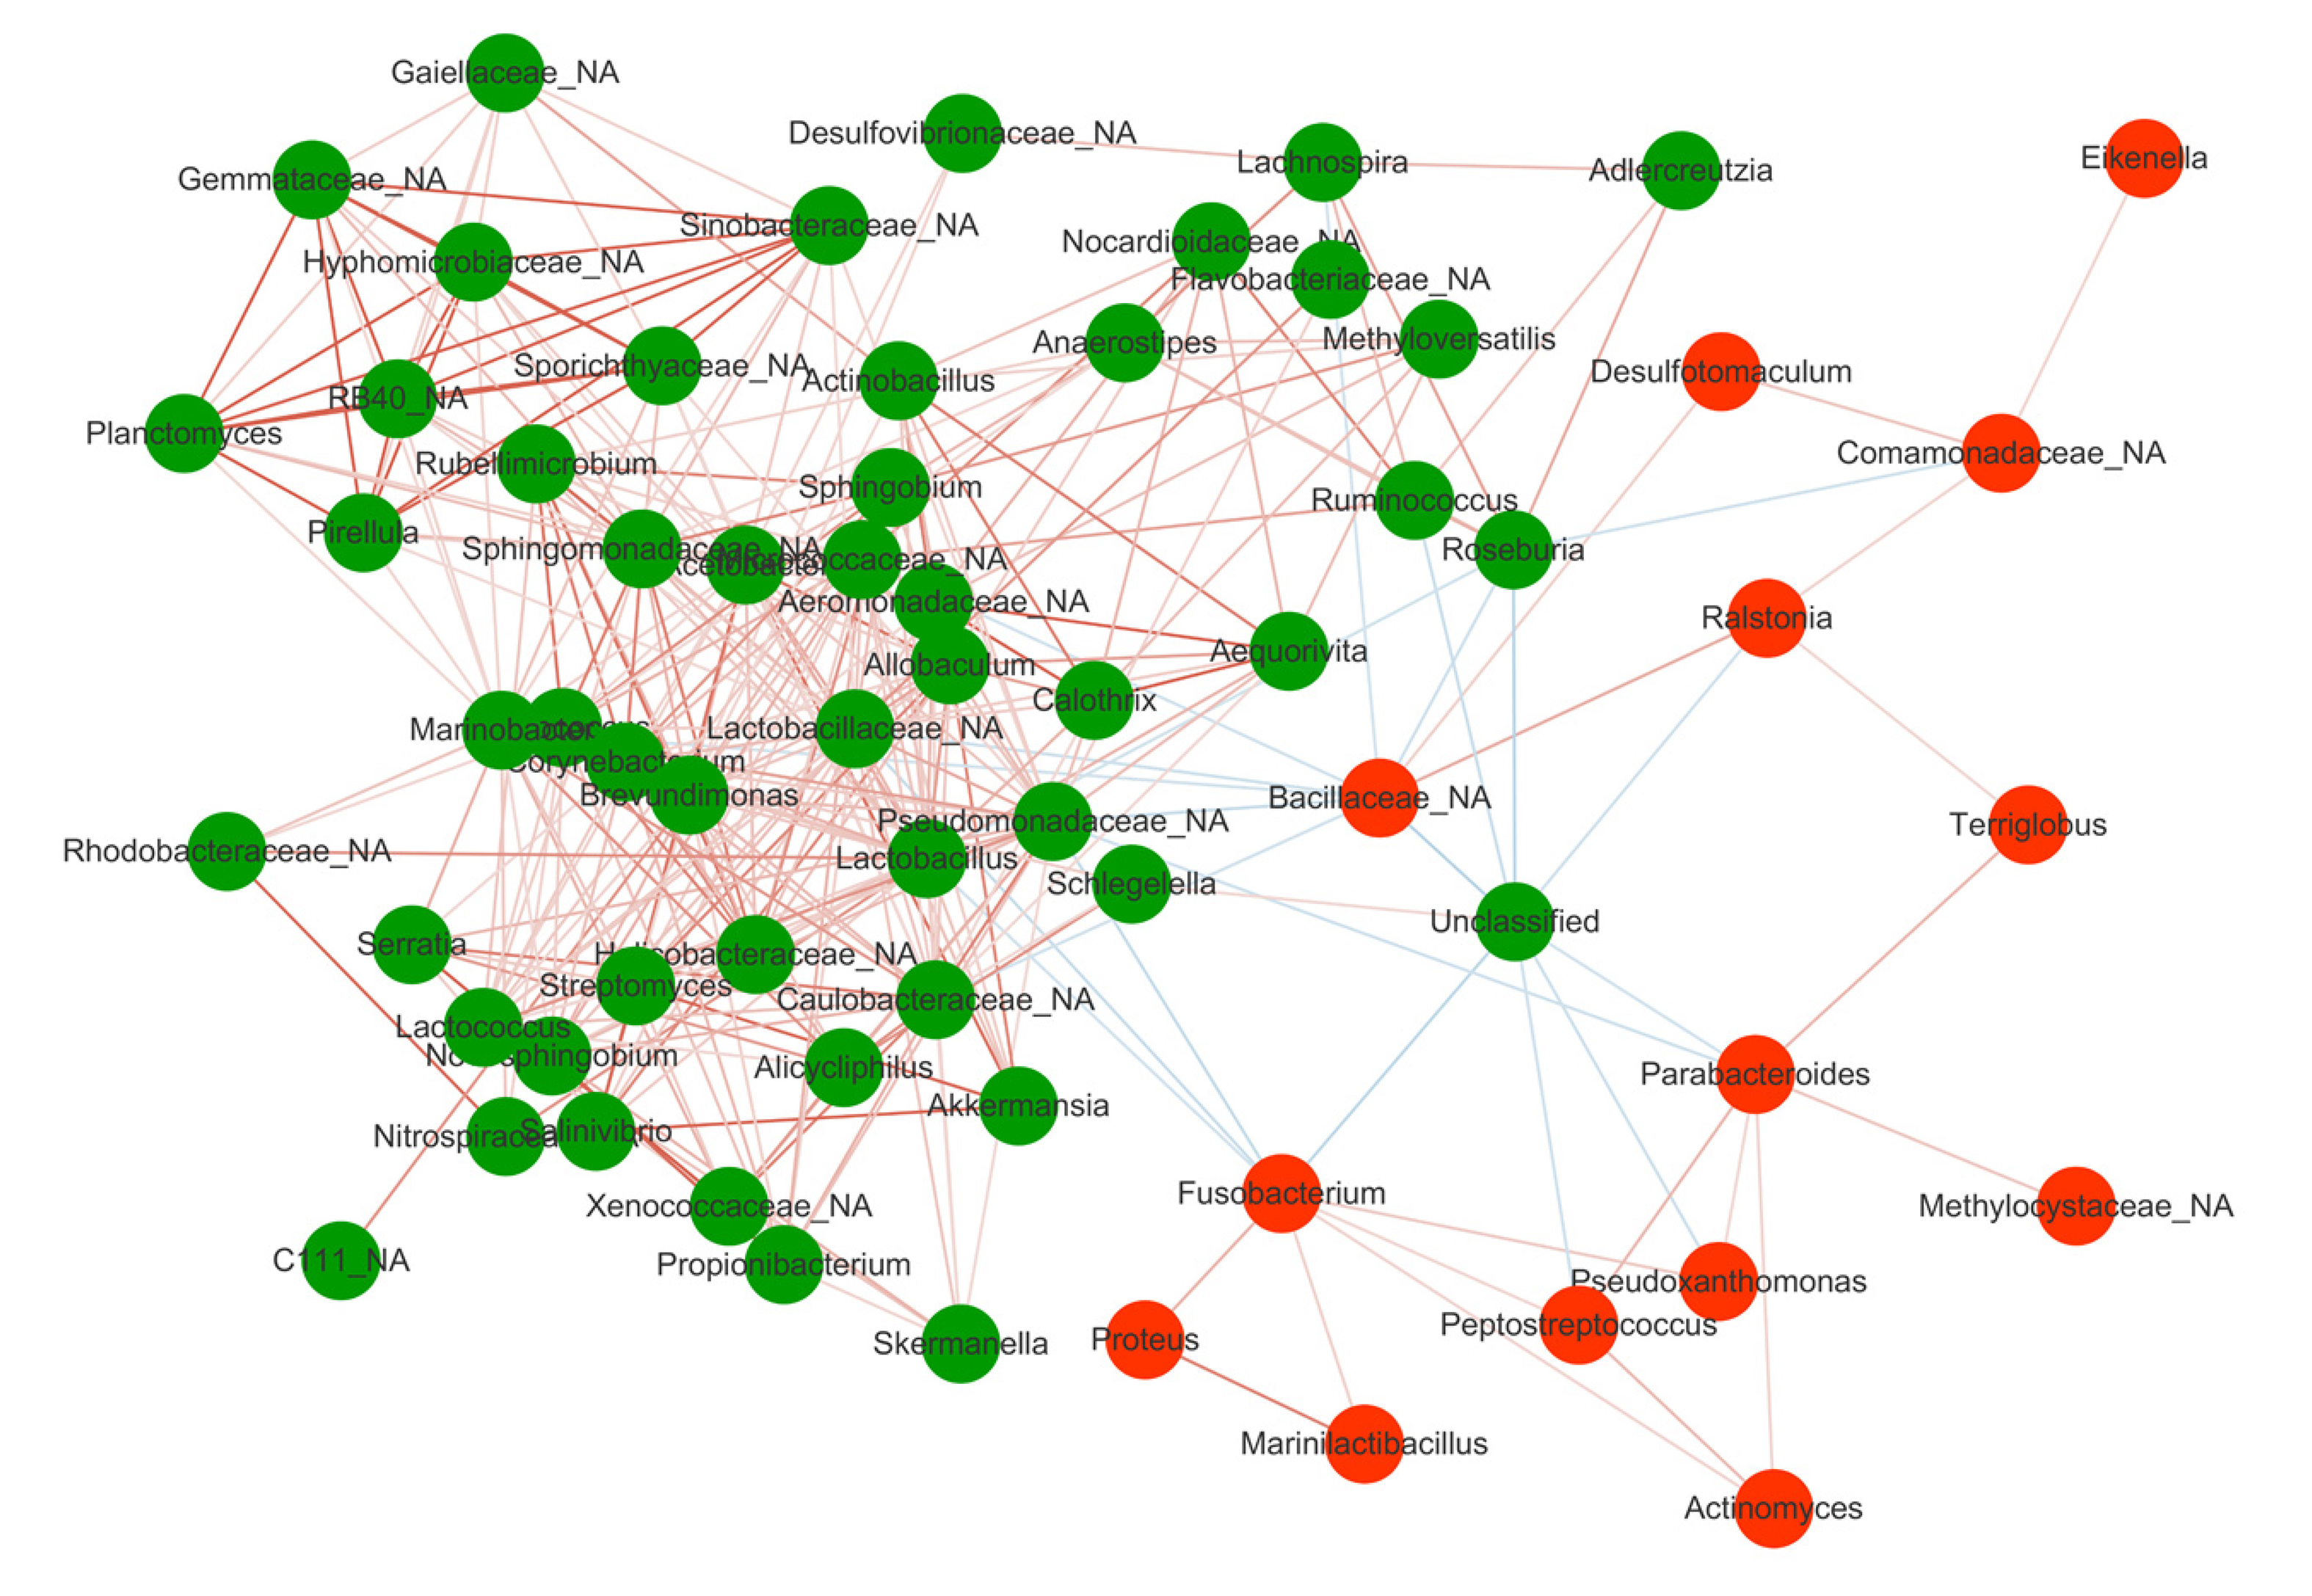
Figure 3 Spearman correlations among the 65 Crohn’s disease-associated genera in gut mucosal samples.
The green circle represented taxa enriched in patients after treatment while the red circle represented taxa enriched in patients before treatment. Lines between nodes denoted Pearson correlation (r > 0.2 and P < 0.05). The red and blue lines represented the positive and negative correlation, respectively.
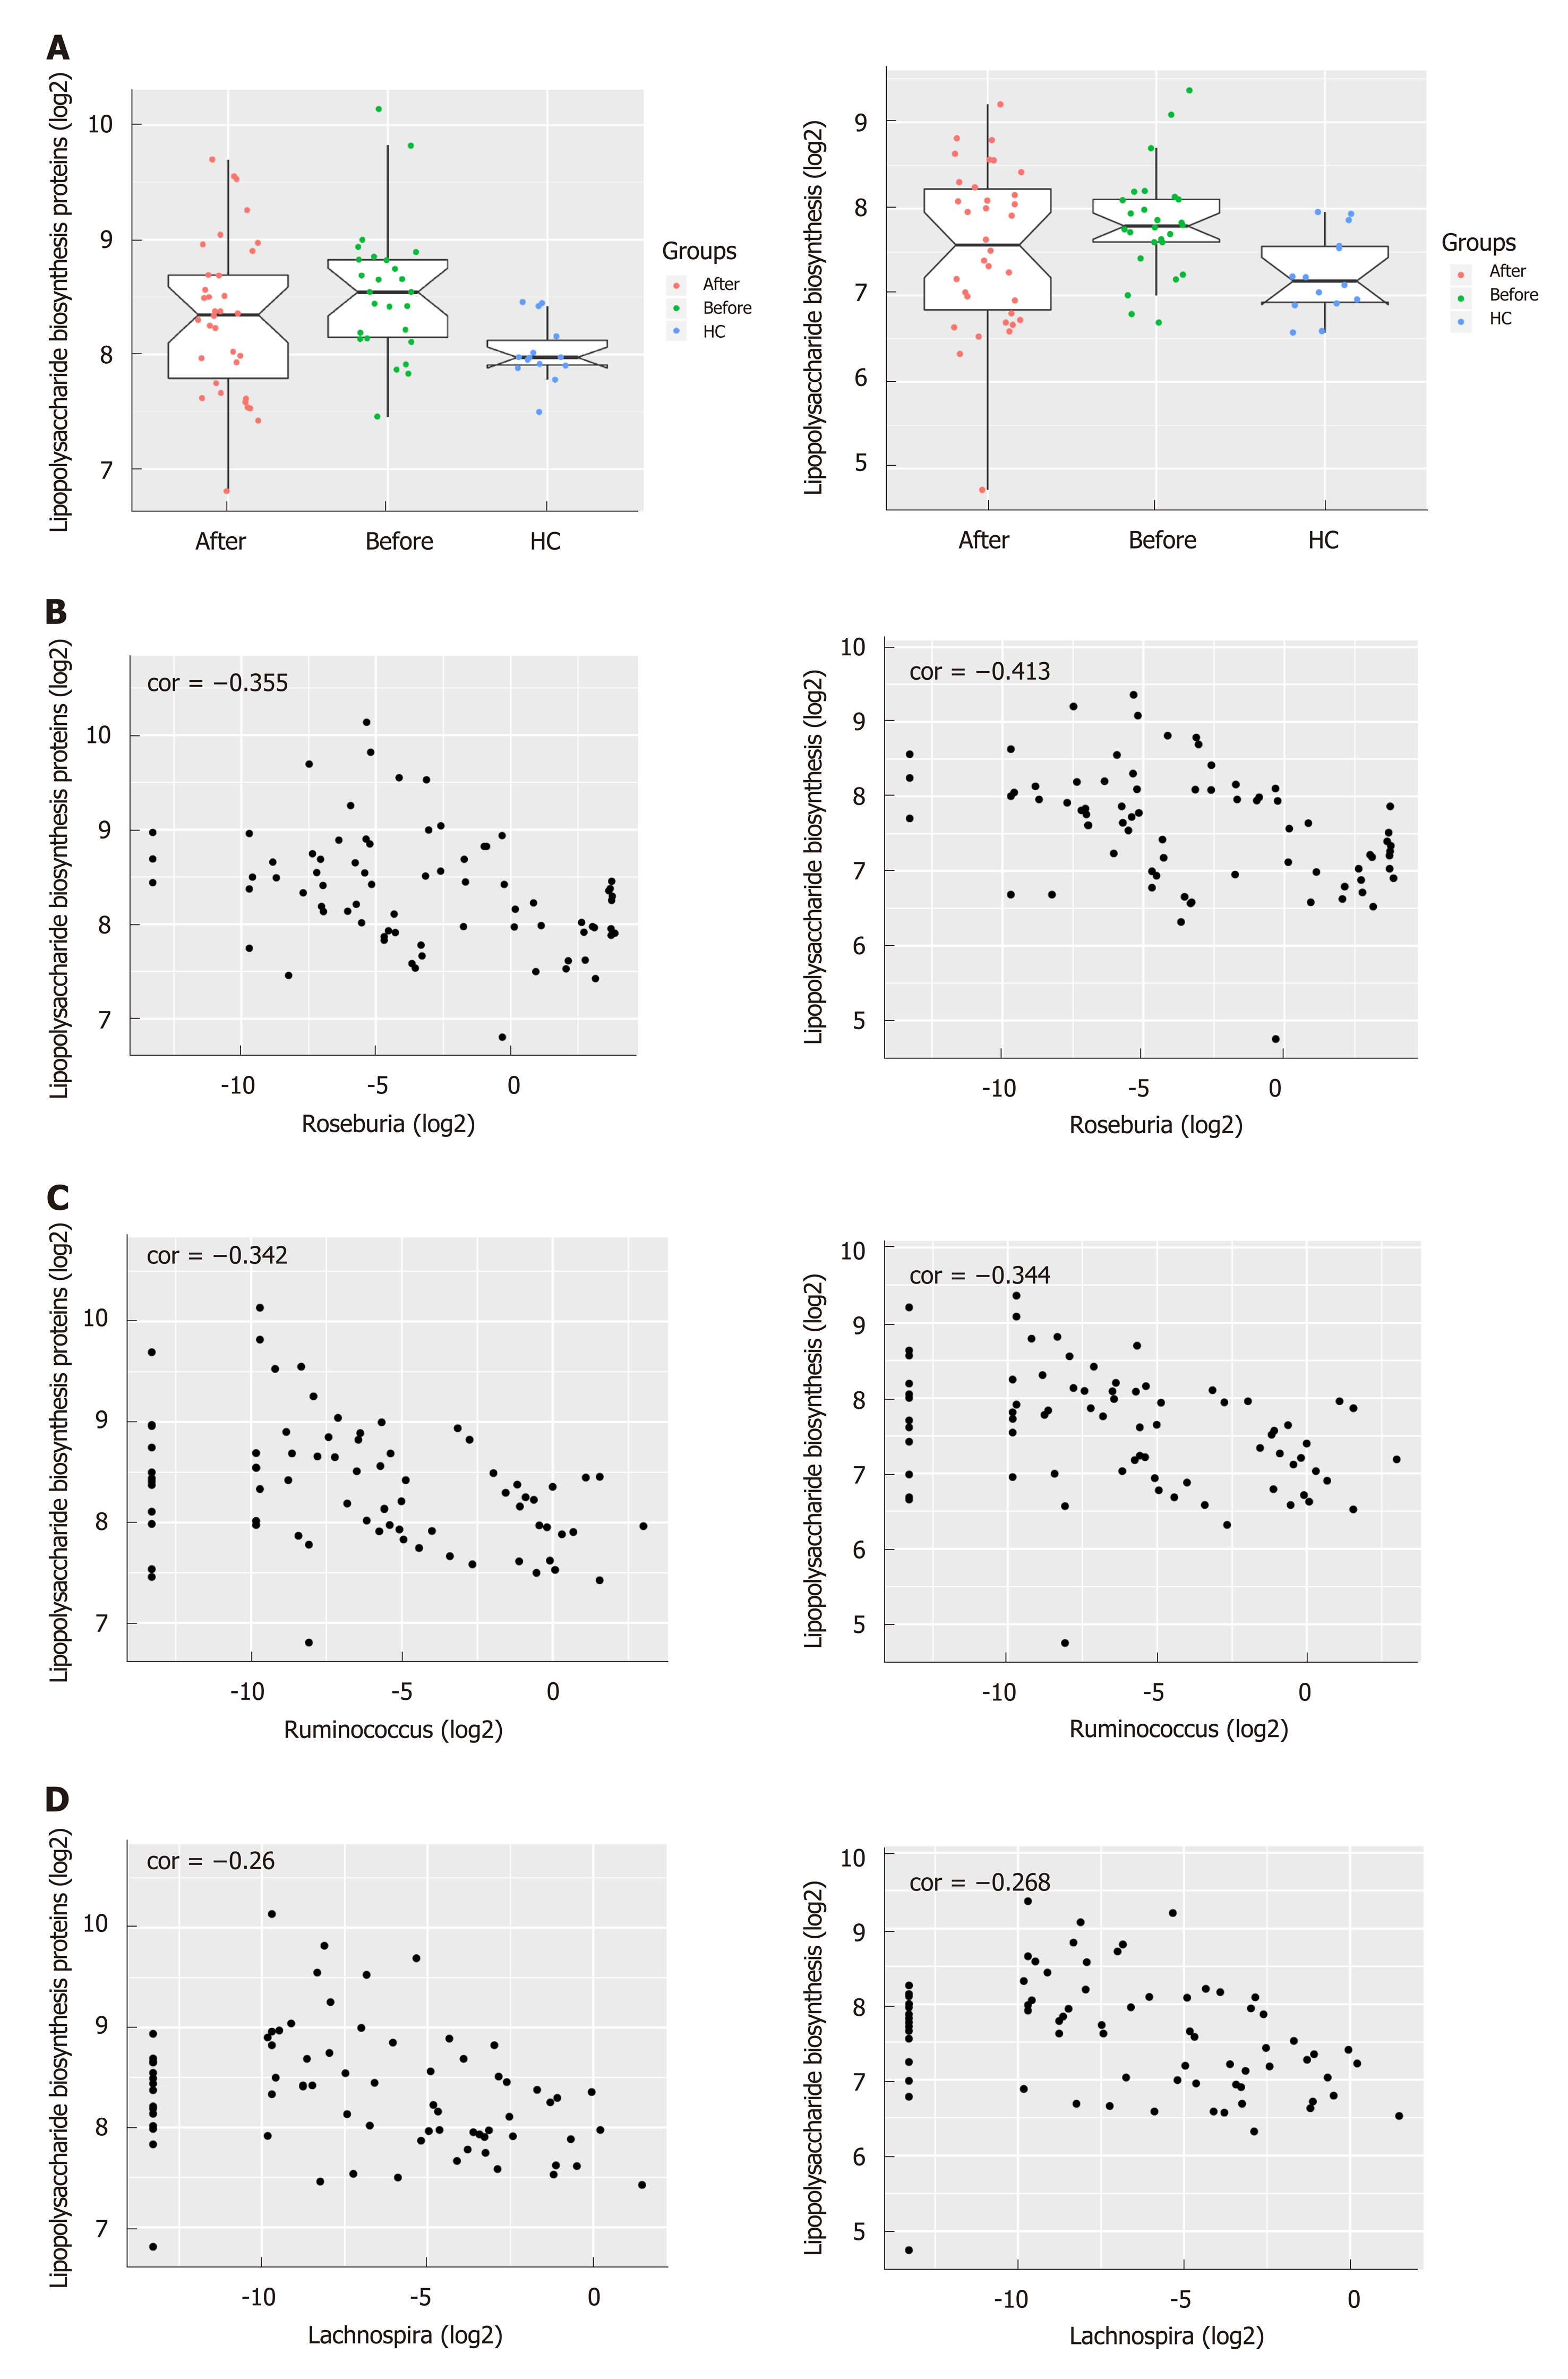
Figure 4 The predicted functional module involving pro-inflammatory pathways altered in Crohn’s disease compared to healthy controls.
A: Pathways including Lipopolysaccharide biosynthesis proteins and Lipopolysaccharide biosynthesis predicted to show significant different abundances among before, after and healthy controls group according to Kyoto Encyclopedia of Genes and Genome pathway analysis. The Crohn’s disease-depleted genera including Roseburia, Ruminococcus and Lachnospira were negatively correlated with Lipopolysaccharide biosynthesis proteins (P = 0.001 for Roseburia, P = 0.002 for Ruminococcus and P = 0.025 for Lachnospira) and Lipopolysaccharide biosynthesis (P = 0.0002 for Roseburia, P = 0.002 for Ruminococcus and P = 0.021 for Lachnospira). B: Roseburia; C: Ruminococcus; D: Lachnospira.
- Citation: He C, Wang H, Liao WD, Peng C, Shu X, Zhu X, Zhu ZH. Characteristics of mucosa-associated gut microbiota during treatment in Crohn’s disease. World J Gastroenterol 2019; 25(18): 2204-2216
- URL: https://www.wjgnet.com/1007-9327/full/v25/i18/2204.htm
- DOI: https://dx.doi.org/10.3748/wjg.v25.i18.2204


