Copyright
©The Author(s) 2019.
World J Gastroenterol. Apr 14, 2019; 25(14): 1715-1728
Published online Apr 14, 2019. doi: 10.3748/wjg.v25.i14.1715
Published online Apr 14, 2019. doi: 10.3748/wjg.v25.i14.1715
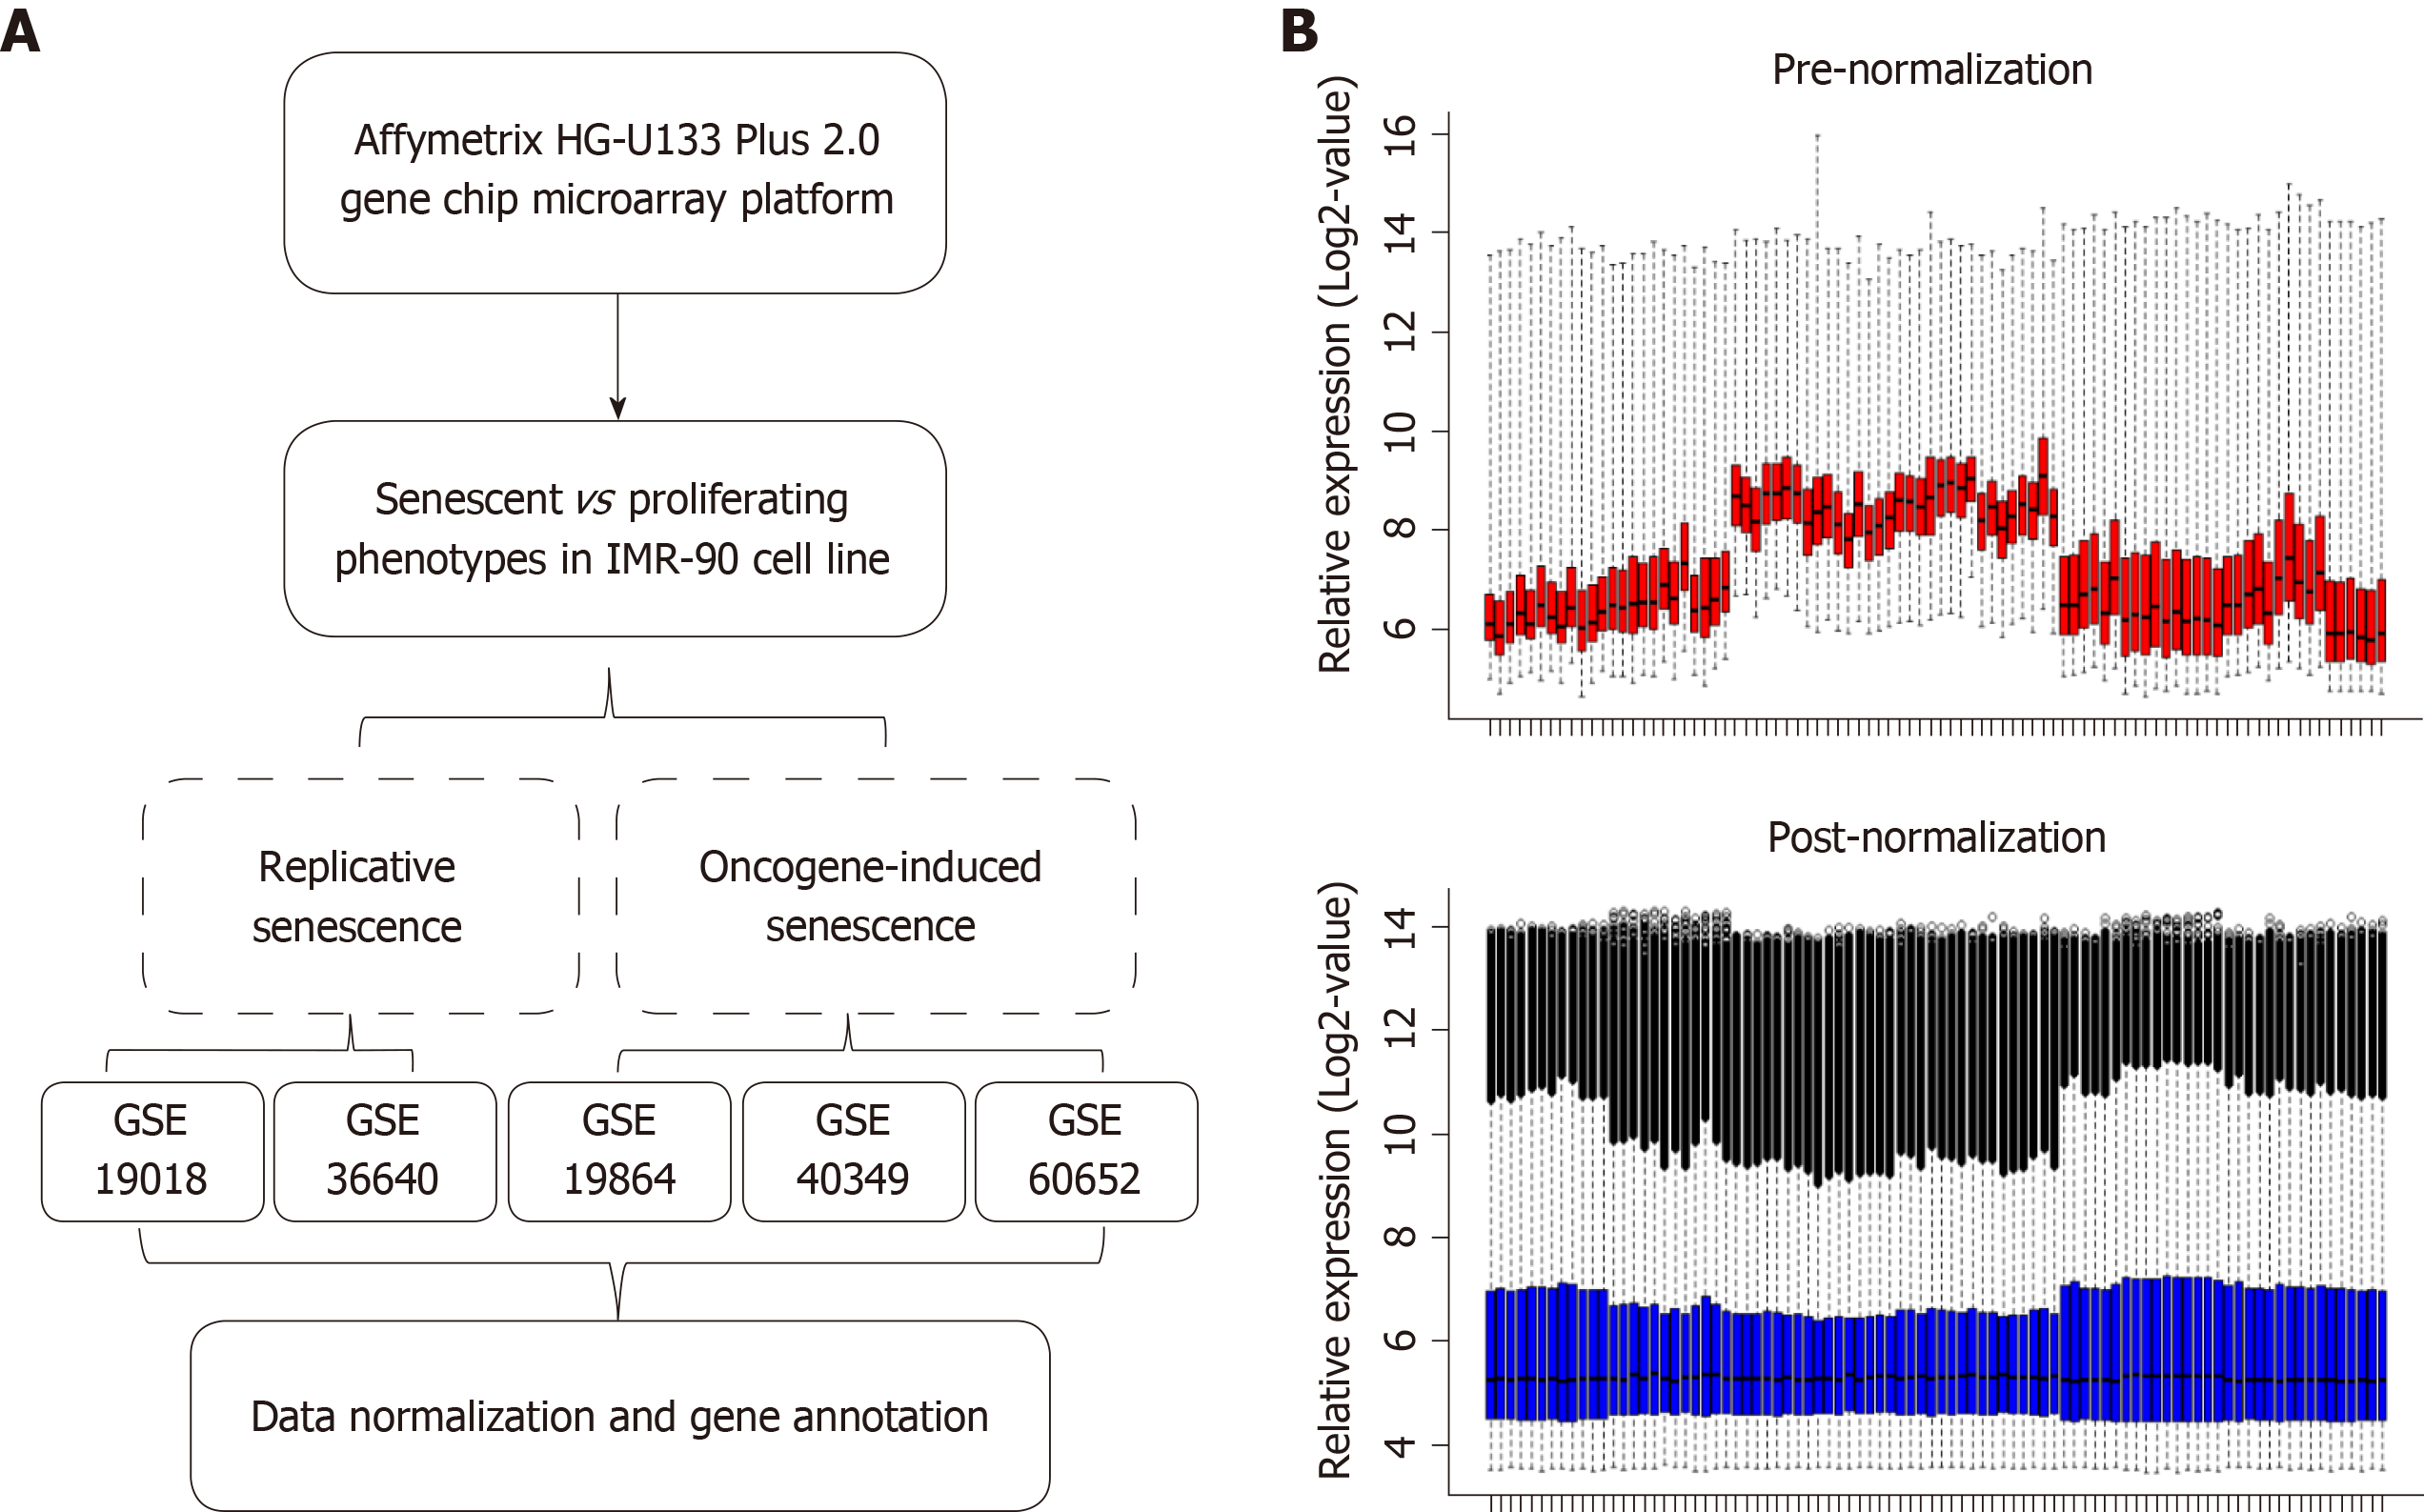
Figure 1 Data sources and processing.
A: Flowchart describing the process used to generate differentially expressed senescence-associated genes; B: The relative expression in all samples pre- and post-normalization.
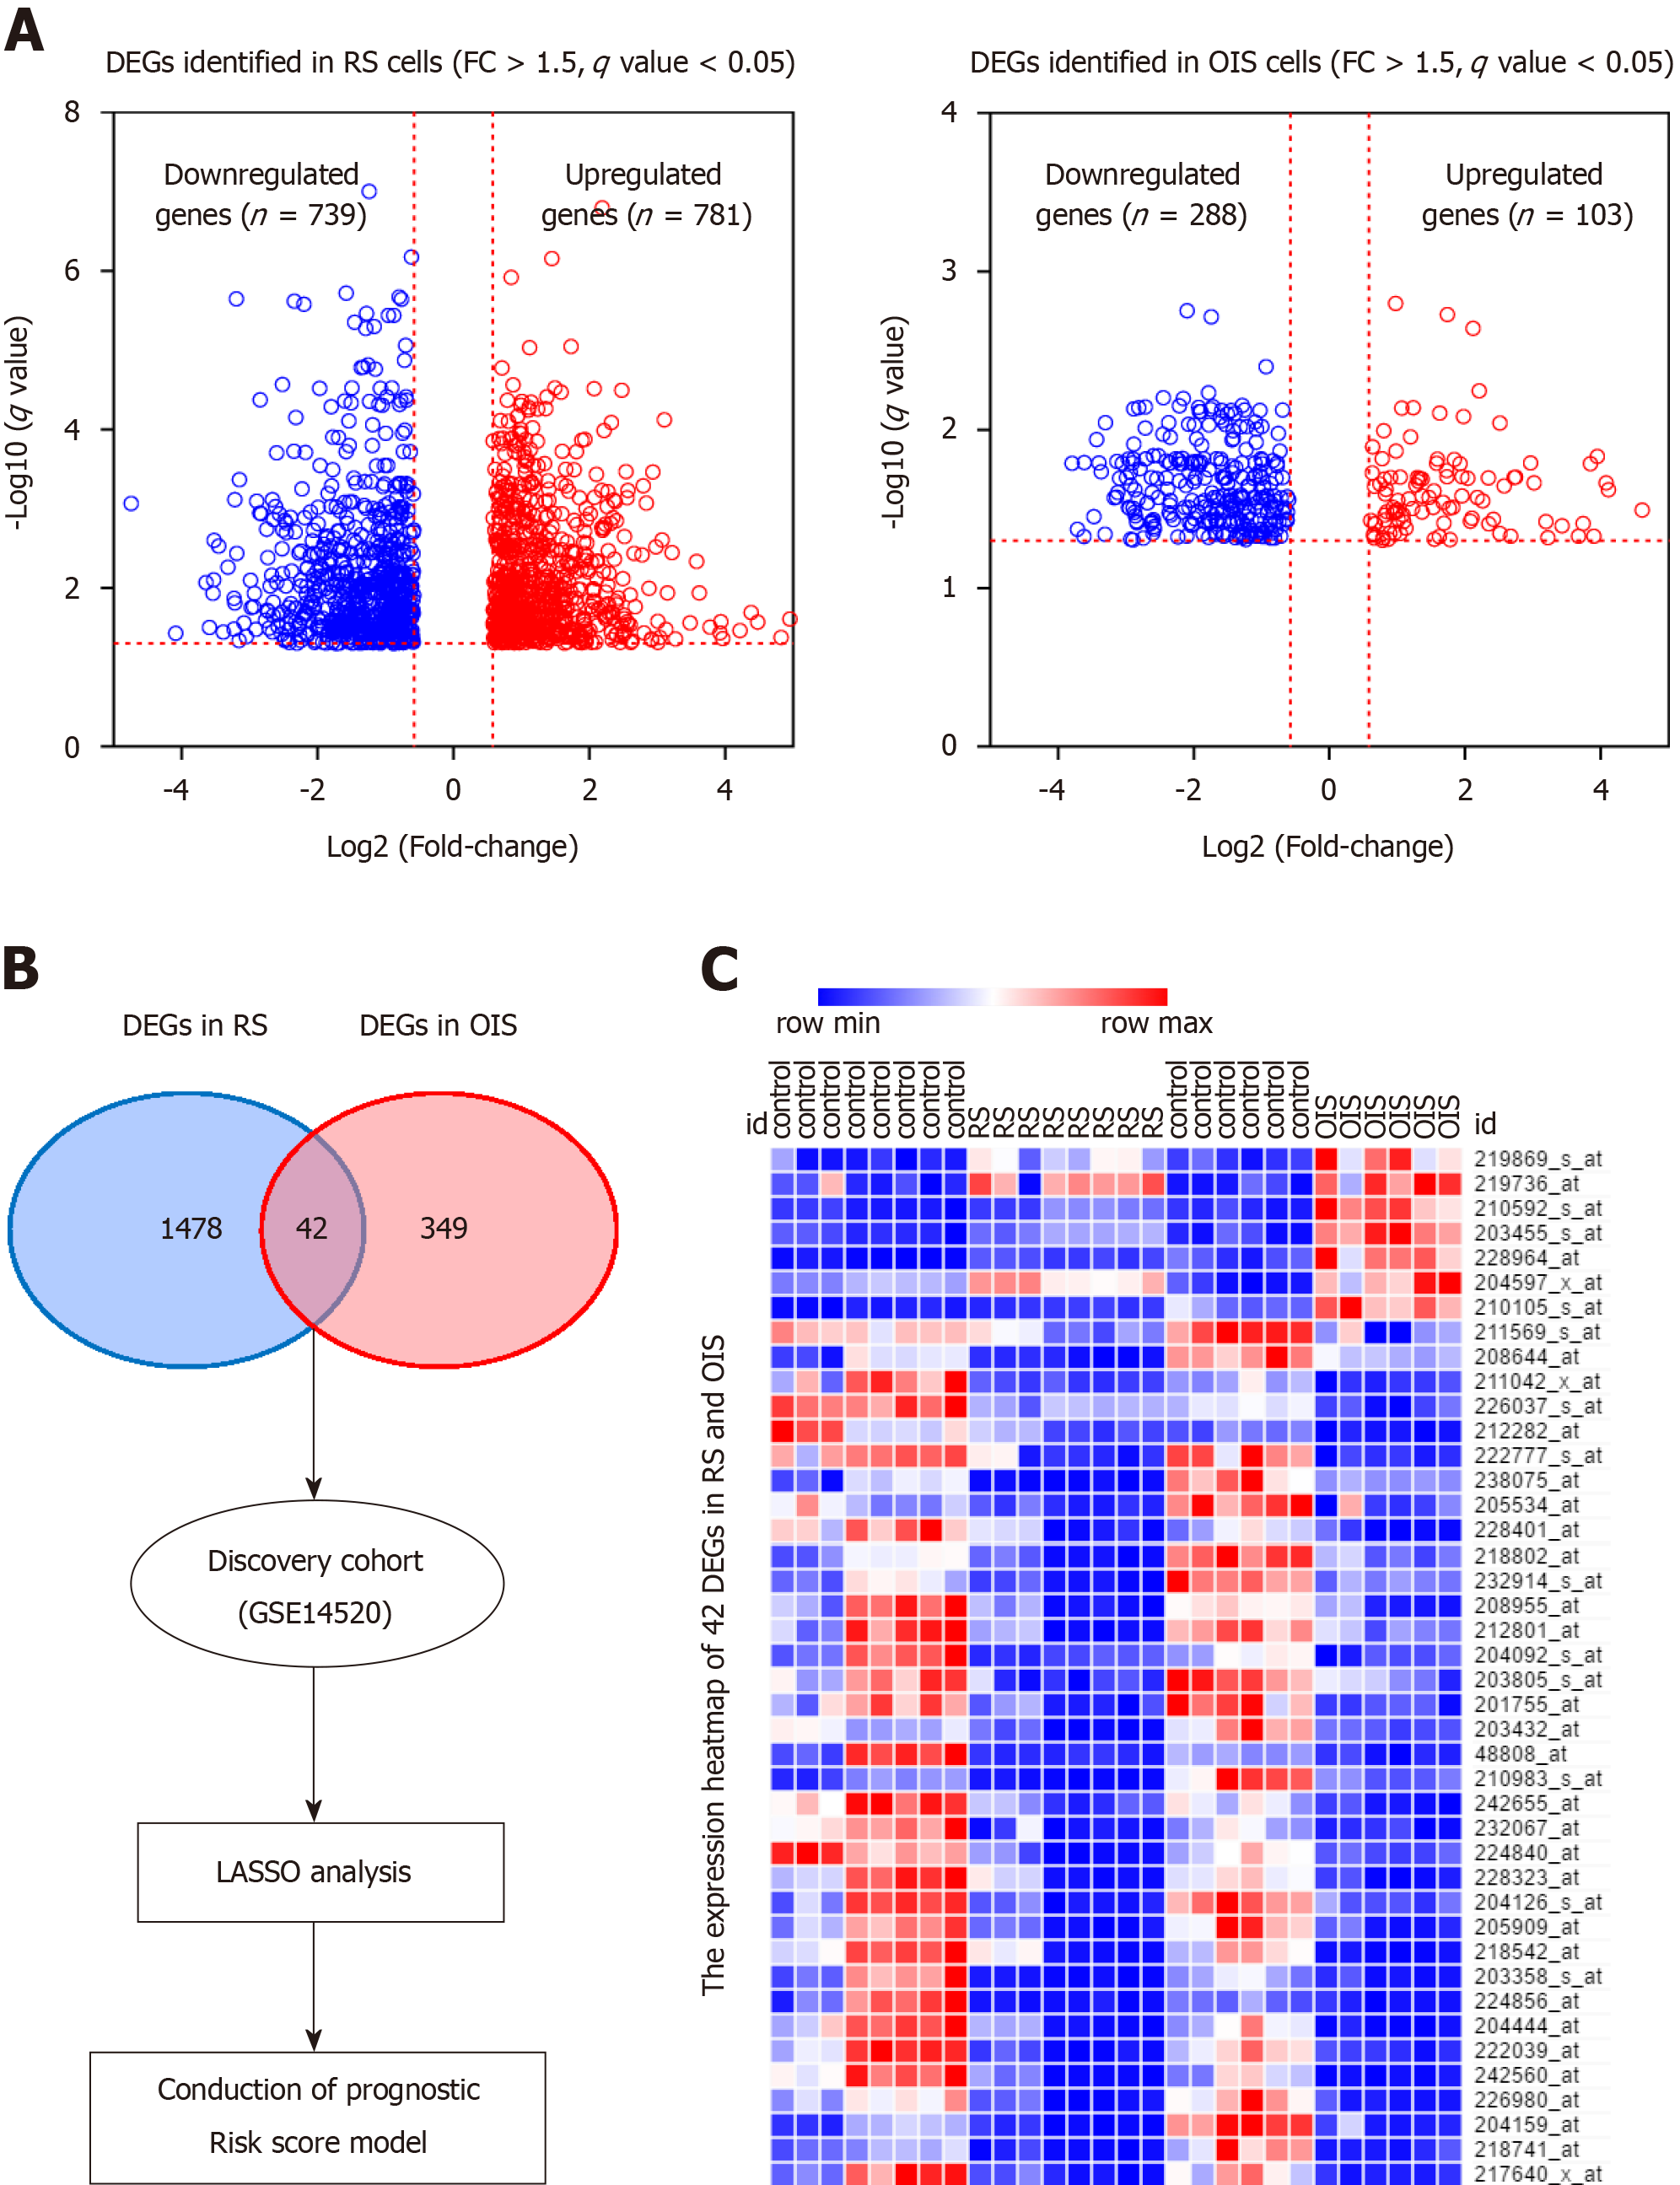
Figure 2 Expression of differentially expressed genes in senescent cells.
A: The differentially expressed genes were identified in replicative senescence (RS) and oncogene-induced senescence (OIS) models. There were 781 up-regulated and 739 down-regulated genes selected using the RS model, and 103 up-regulated and 288 down-regulated genes selected using the OIS model; B: Overlapping the two lists, 42 common differentially expressed genes were selected as senescence associated genes; C: The expression levels of 42 genes are presented as a heat map in RS and OIS models. DEGs: Differentially expressed genes; RS: Replicative senescence; OIS: Oncogene-induced senescence; SAGs: Senescence associated genes; FC: Fold change; LASSO: Least absolute shrinkage and selection operator.
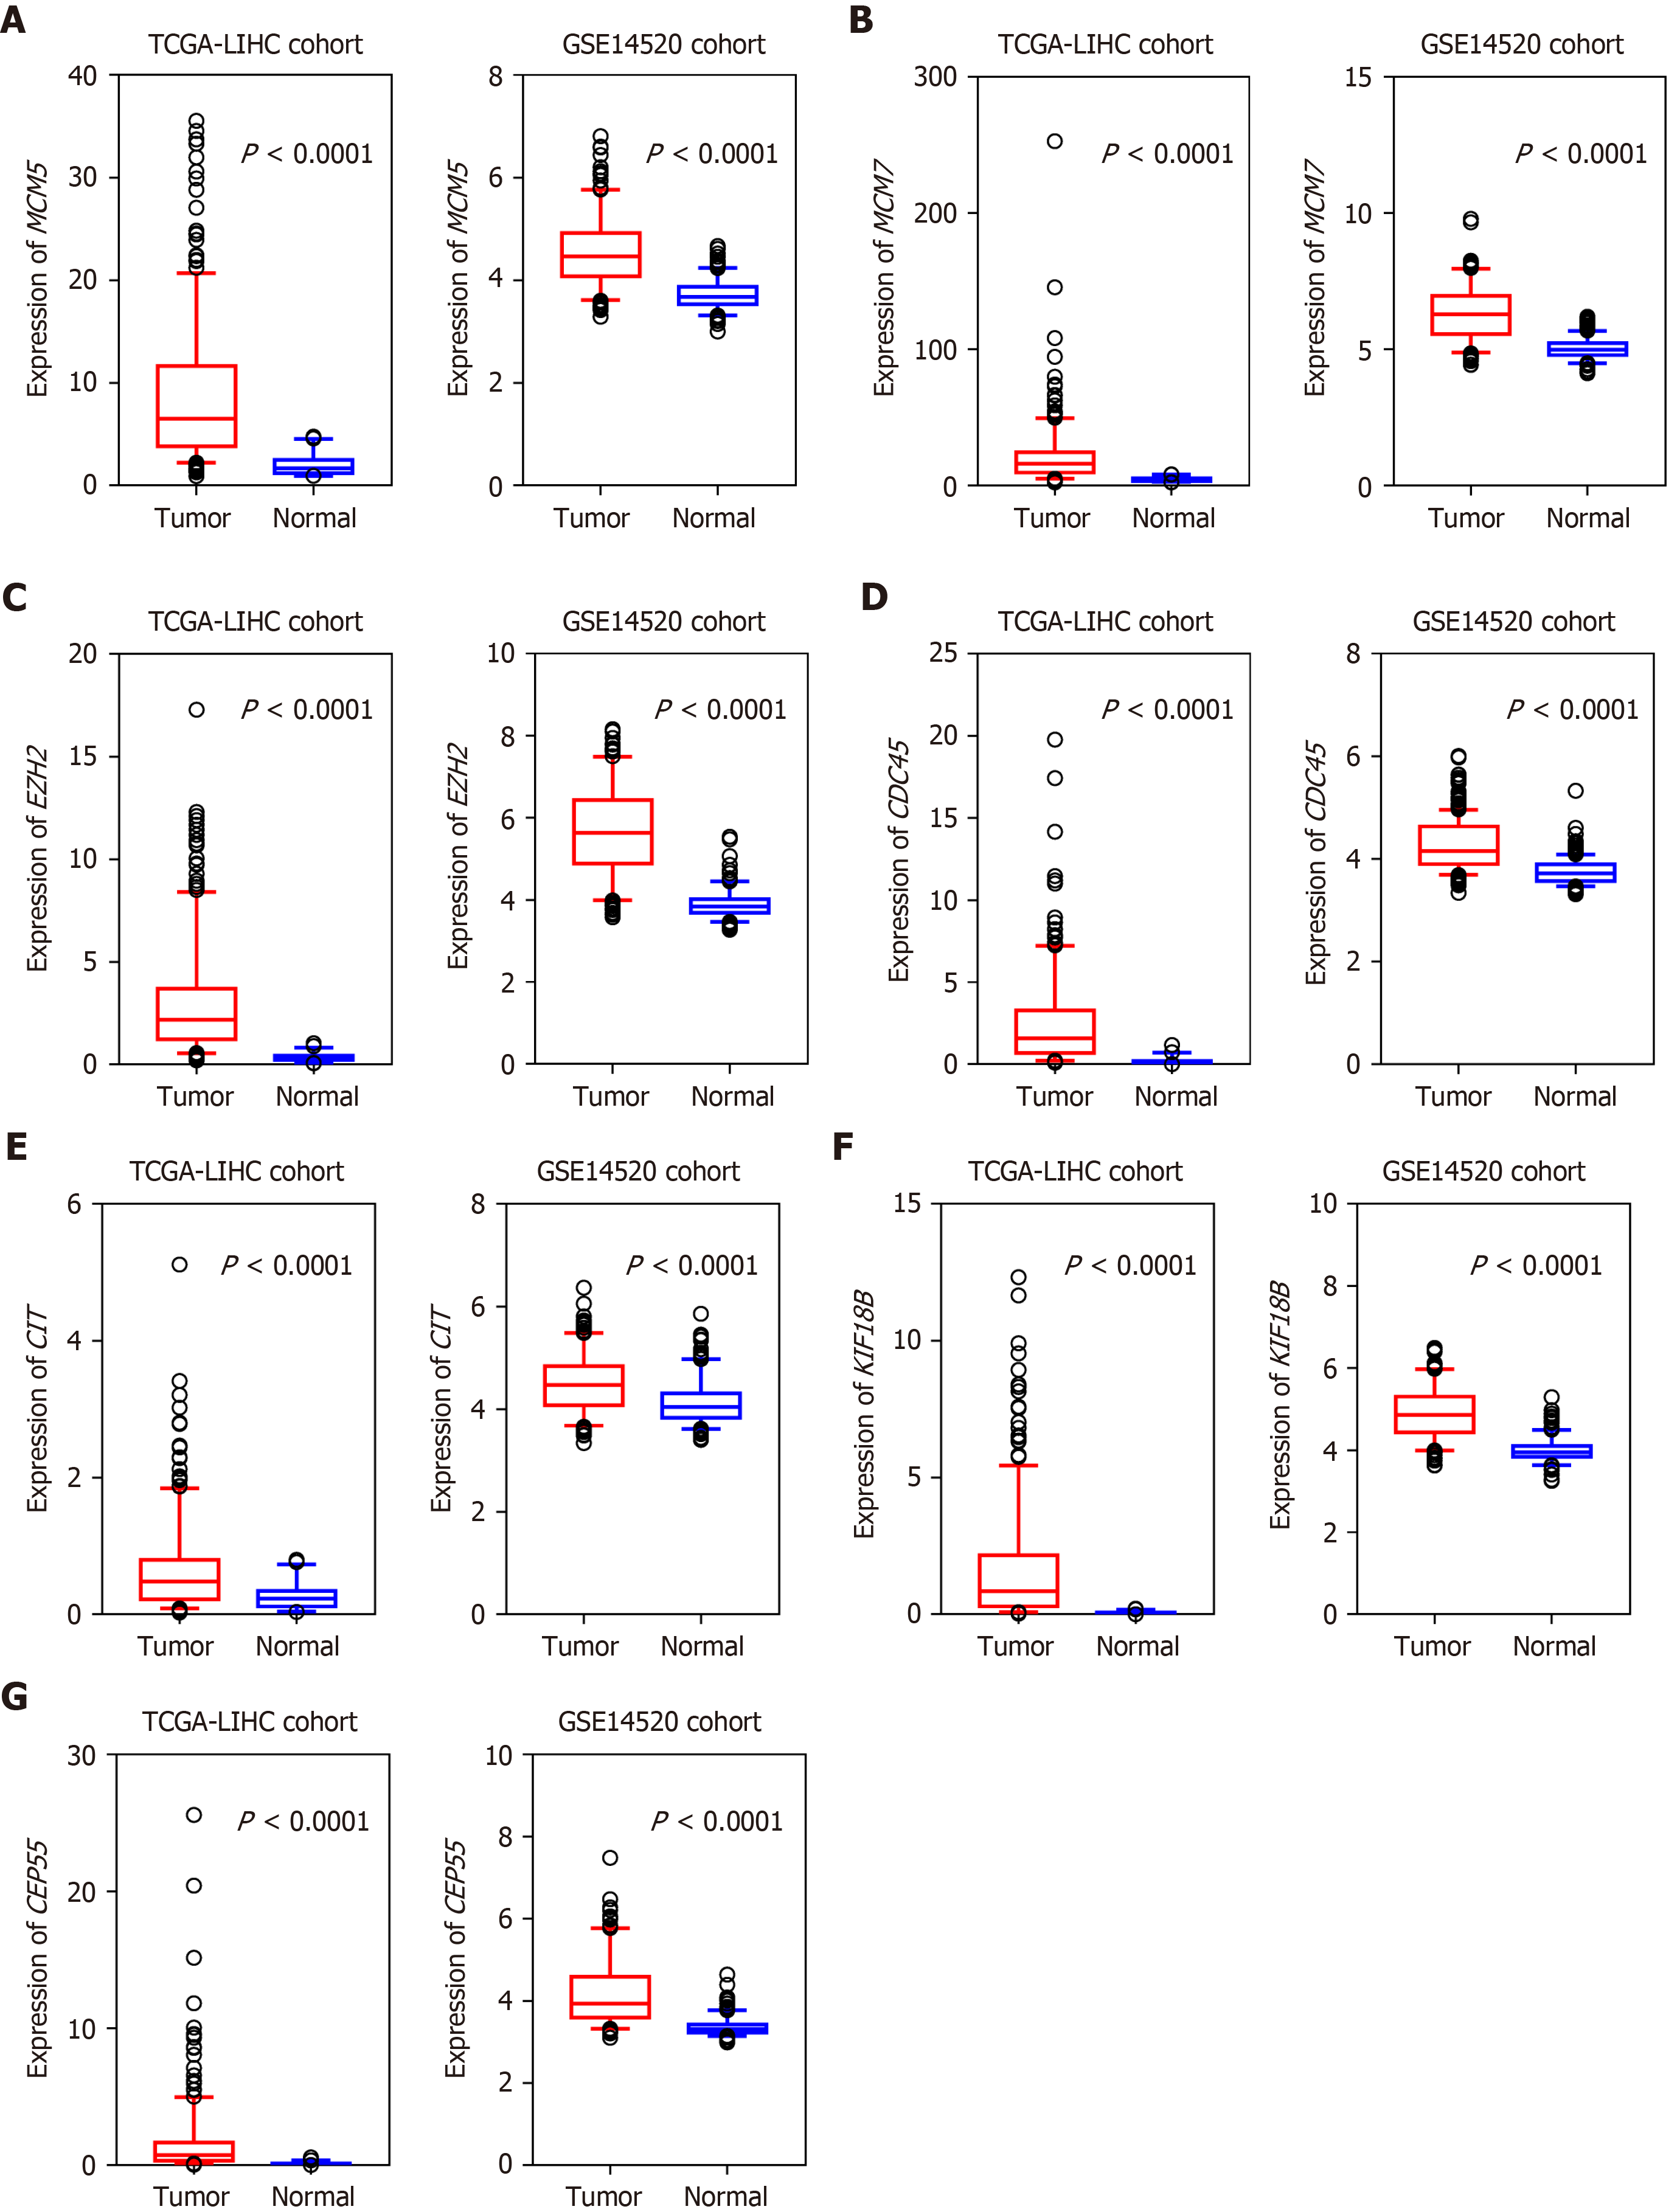
Figure 3 Expression of the seven candidate genes in hepatocellular carcinoma and normal liver tissues.
A: MCM5; B: MCM7; C: EZH2; D: CDC45; E: CIT; F: KIF18B; G: CEP55. Seven senescence associated genes, which were downregulated in senescent cells, were shown to be upregulated in hepatocellular carcinoma tissues in both discovery and validation cohorts. P < 0.0001 for all.
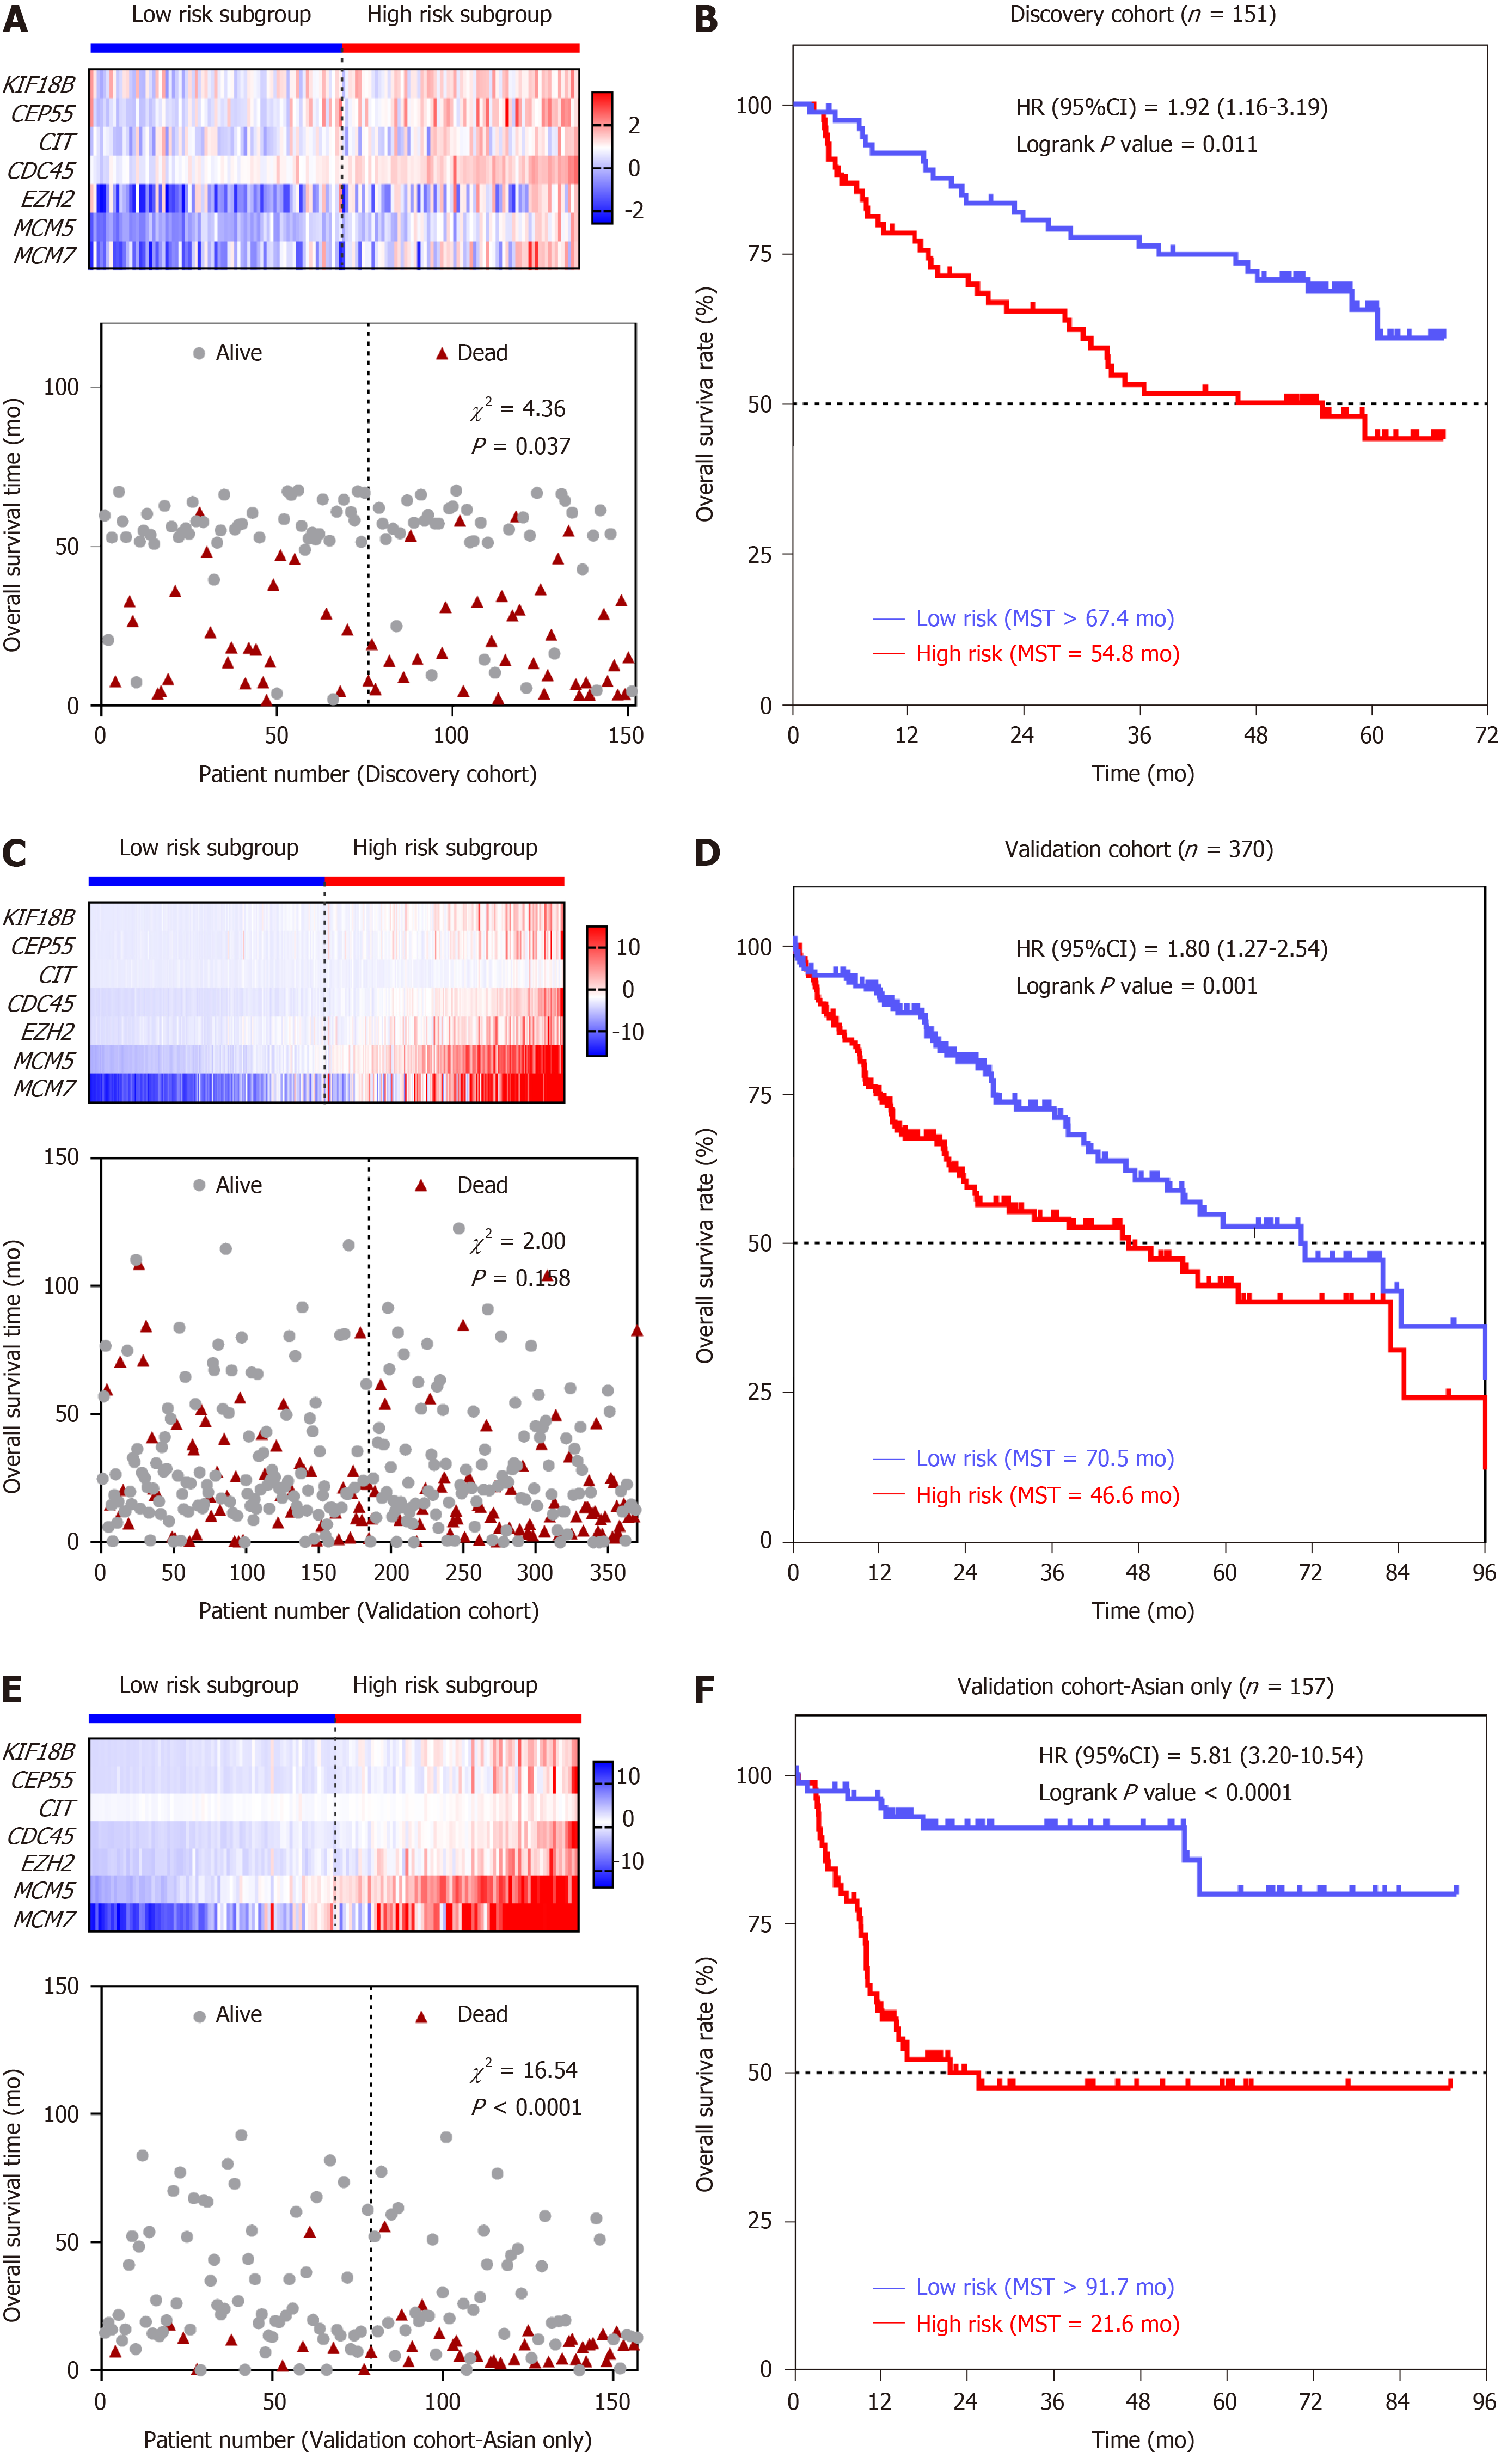
Figure 4 The seven-senescence associated gene signature is associated with overall survival in the discovery and validation cohorts.
A: The heat map of the expression of seven genes and patients’ death status in the discovery cohort; B: Kaplan-Meier survival curves plotted to estimate the overall survival probabilities for the low-risk vs high-risk group in the discovery cohort; C: The heat map of the expression of seven genes and patients’ death status in the validation cohort; D: Kaplan-Meier survival curves plotted to estimate the overall survival probabilities for the low-risk vs high-risk group in the validation cohort; E: The heat map of the expression of seven genes and patients’ death status in the validation cohort-Asian only subgroup; F: Kaplan-Meier survival curves plotted to estimate the overall survival probabilities for the low-risk vs high-risk group in the validation cohort-Asian only subgroup. HR: Hazard ratio; CI: Confidence interval.
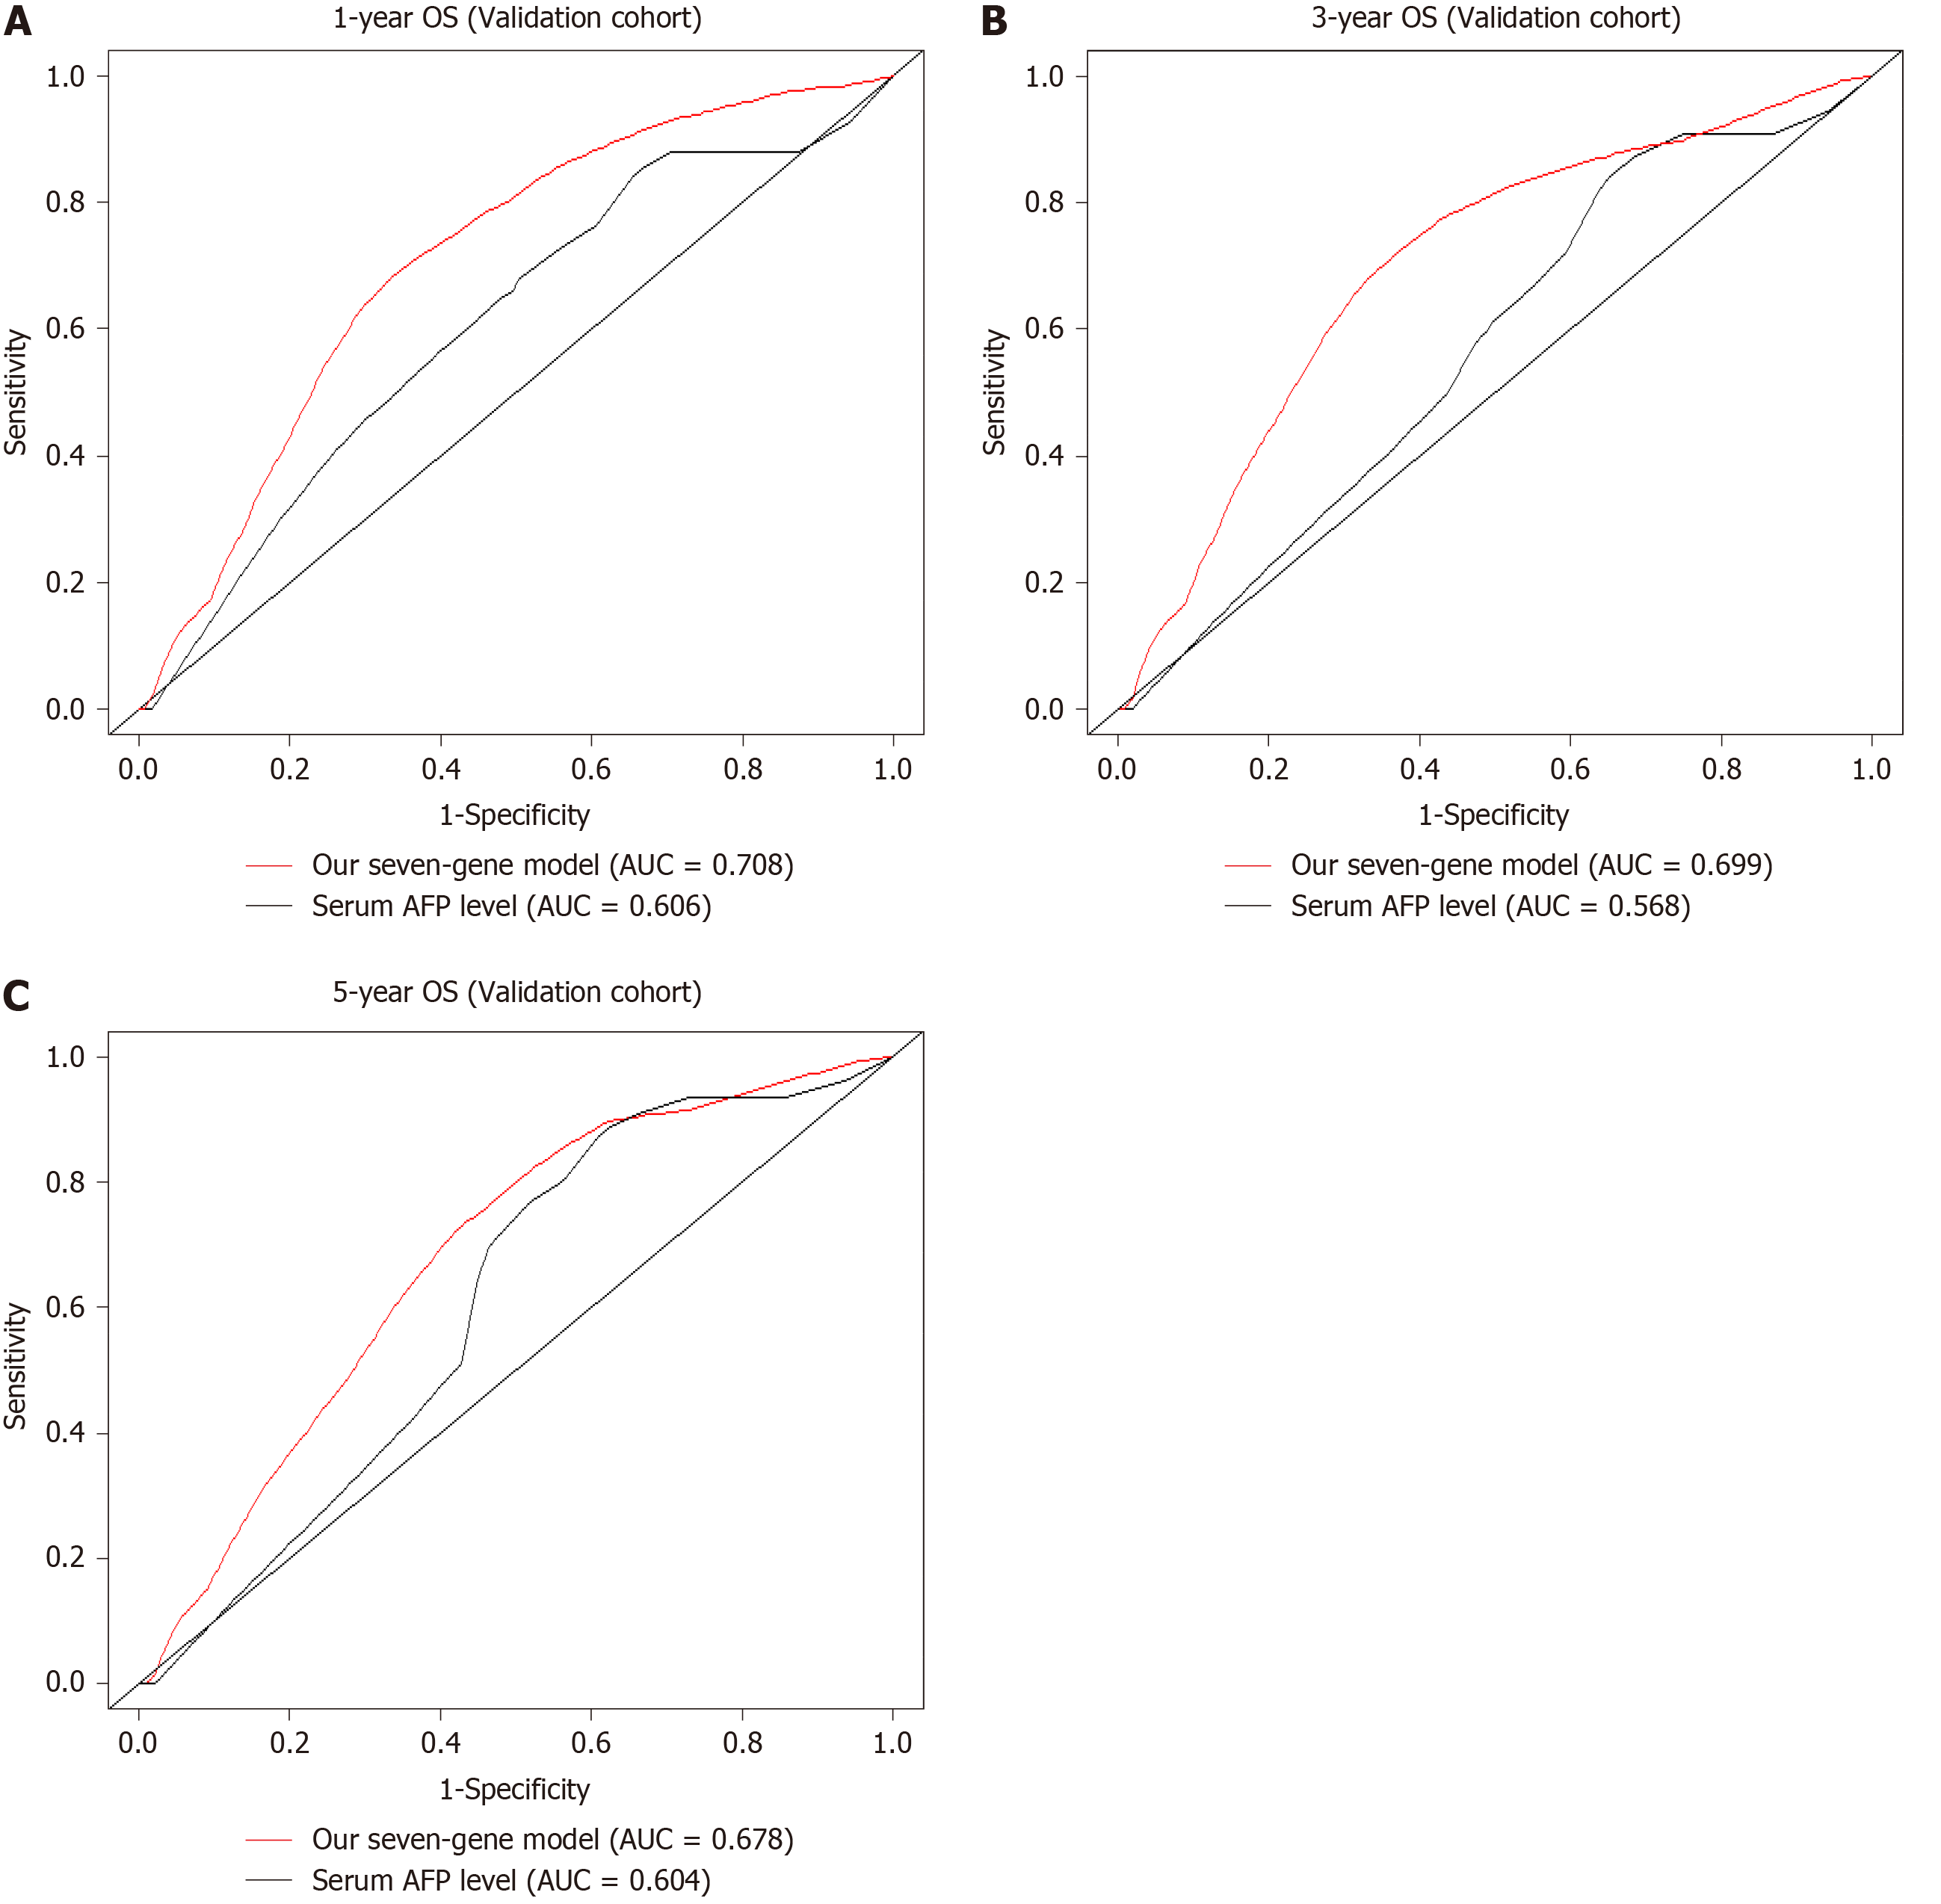
Figure 5 Comparison of the seven-senescence associated gene signature and α-fetoprotein in predicting overall survival of hepatocellular carcinoma patients.
To assess the prognostic accuracy of the seven-senescence associated gene signature and serumα-fetoprotein level, time-dependent receiver operating characteristic curve analysis was conducted for 1-, 3-, and 5-year overall survival (OS). A: 1-year OS; B: 3-year OS; C: 5-year OS. AUC: Area under the curve; AFP: Alpha-fetoprotein; OS: Overall survival.
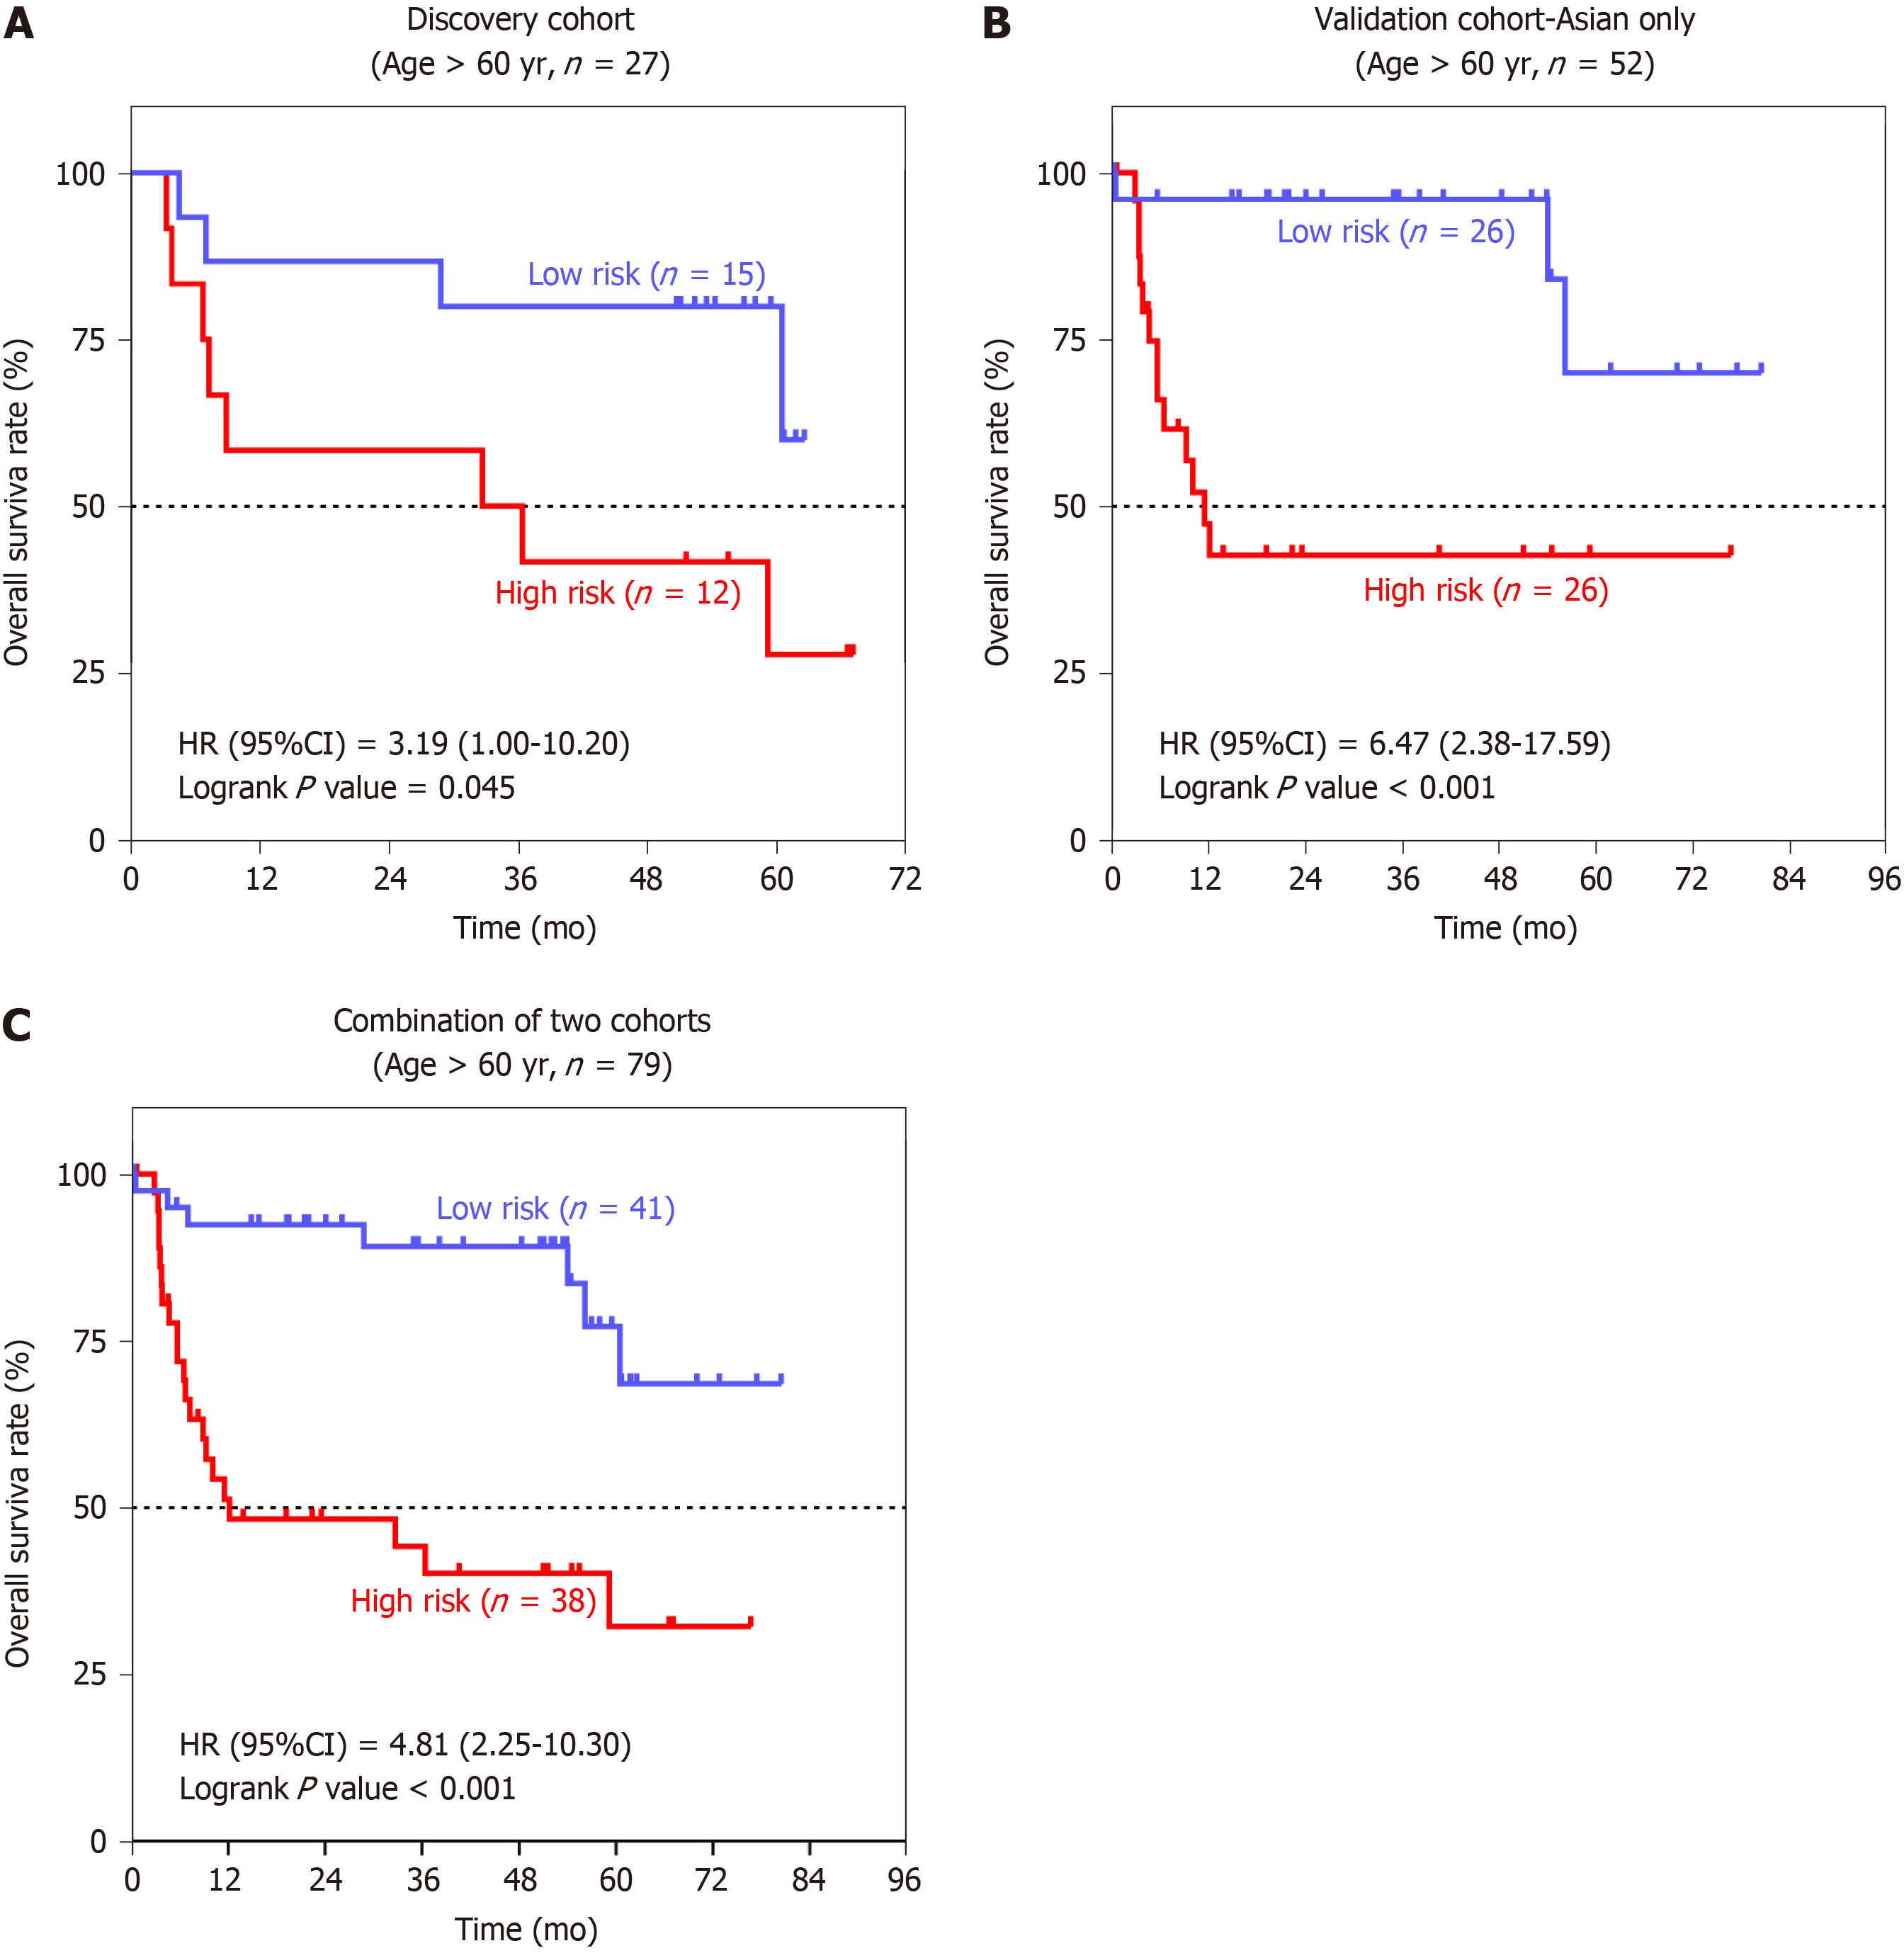
Figure 6 Association between the seven-senescence associated gene signature and overall survival in the elderly age subgroup.
Kaplan-Meier survival curves were plotted to estimate the overall survival probabilities for the low-risk vs high-risk group. A: Discovery group; B: Validation group; C: Combination of discovery group and validation group. HR: Hazard ratio; CI: Confidence interval.
- Citation: Xiang XH, Yang L, Zhang X, Ma XH, Miao RC, Gu JX, Fu YN, Yao Q, Zhang JY, Liu C, Lin T, Qu K. Seven-senescence-associated gene signature predicts overall survival for Asian patients with hepatocellular carcinoma. World J Gastroenterol 2019; 25(14): 1715-1728
- URL: https://www.wjgnet.com/1007-9327/full/v25/i14/1715.htm
- DOI: https://dx.doi.org/10.3748/wjg.v25.i14.1715


