Copyright
©The Author(s) 2019.
World J Gastroenterol. Apr 14, 2019; 25(14): 1715-1728
Published online Apr 14, 2019. doi: 10.3748/wjg.v25.i14.1715
Published online Apr 14, 2019. doi: 10.3748/wjg.v25.i14.1715
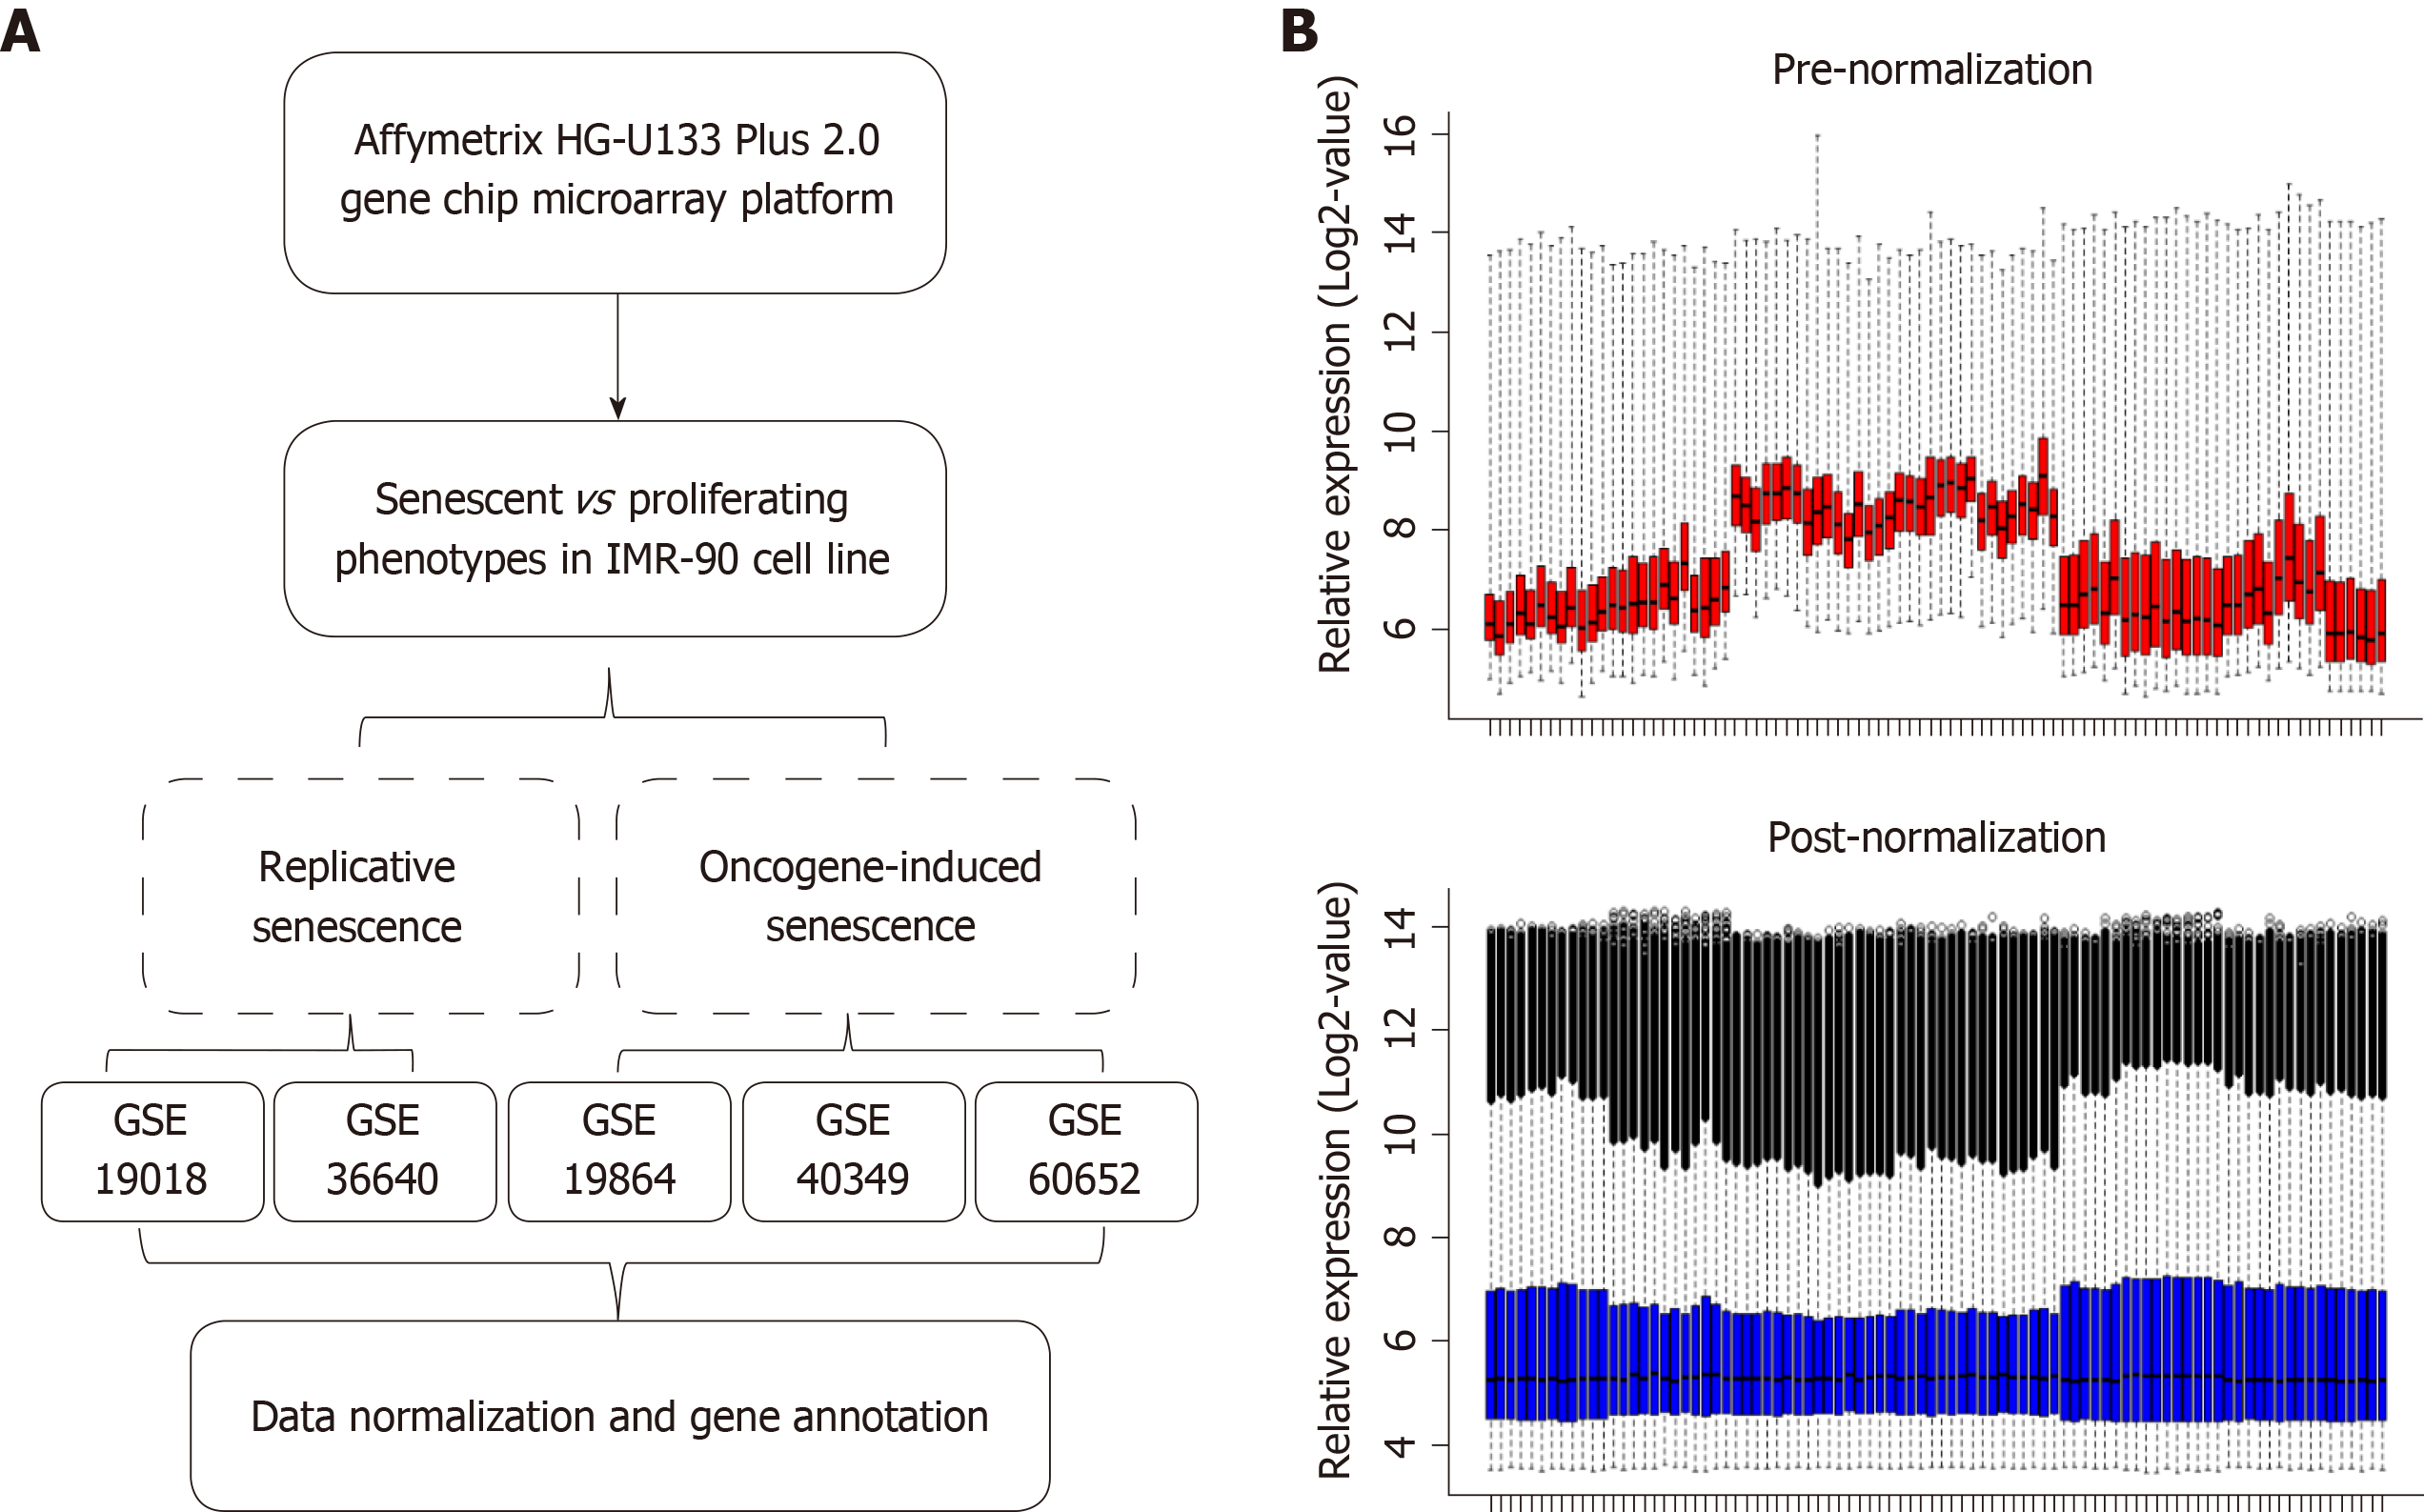
Figure 1 Data sources and processing.
A: Flowchart describing the process used to generate differentially expressed senescence-associated genes; B: The relative expression in all samples pre- and post-normalization.
- Citation: Xiang XH, Yang L, Zhang X, Ma XH, Miao RC, Gu JX, Fu YN, Yao Q, Zhang JY, Liu C, Lin T, Qu K. Seven-senescence-associated gene signature predicts overall survival for Asian patients with hepatocellular carcinoma. World J Gastroenterol 2019; 25(14): 1715-1728
- URL: https://www.wjgnet.com/1007-9327/full/v25/i14/1715.htm
- DOI: https://dx.doi.org/10.3748/wjg.v25.i14.1715


