Copyright
©The Author(s) 2019.
World J Gastroenterol. Mar 28, 2019; 25(12): 1492-1501
Published online Mar 28, 2019. doi: 10.3748/wjg.v25.i12.1492
Published online Mar 28, 2019. doi: 10.3748/wjg.v25.i12.1492
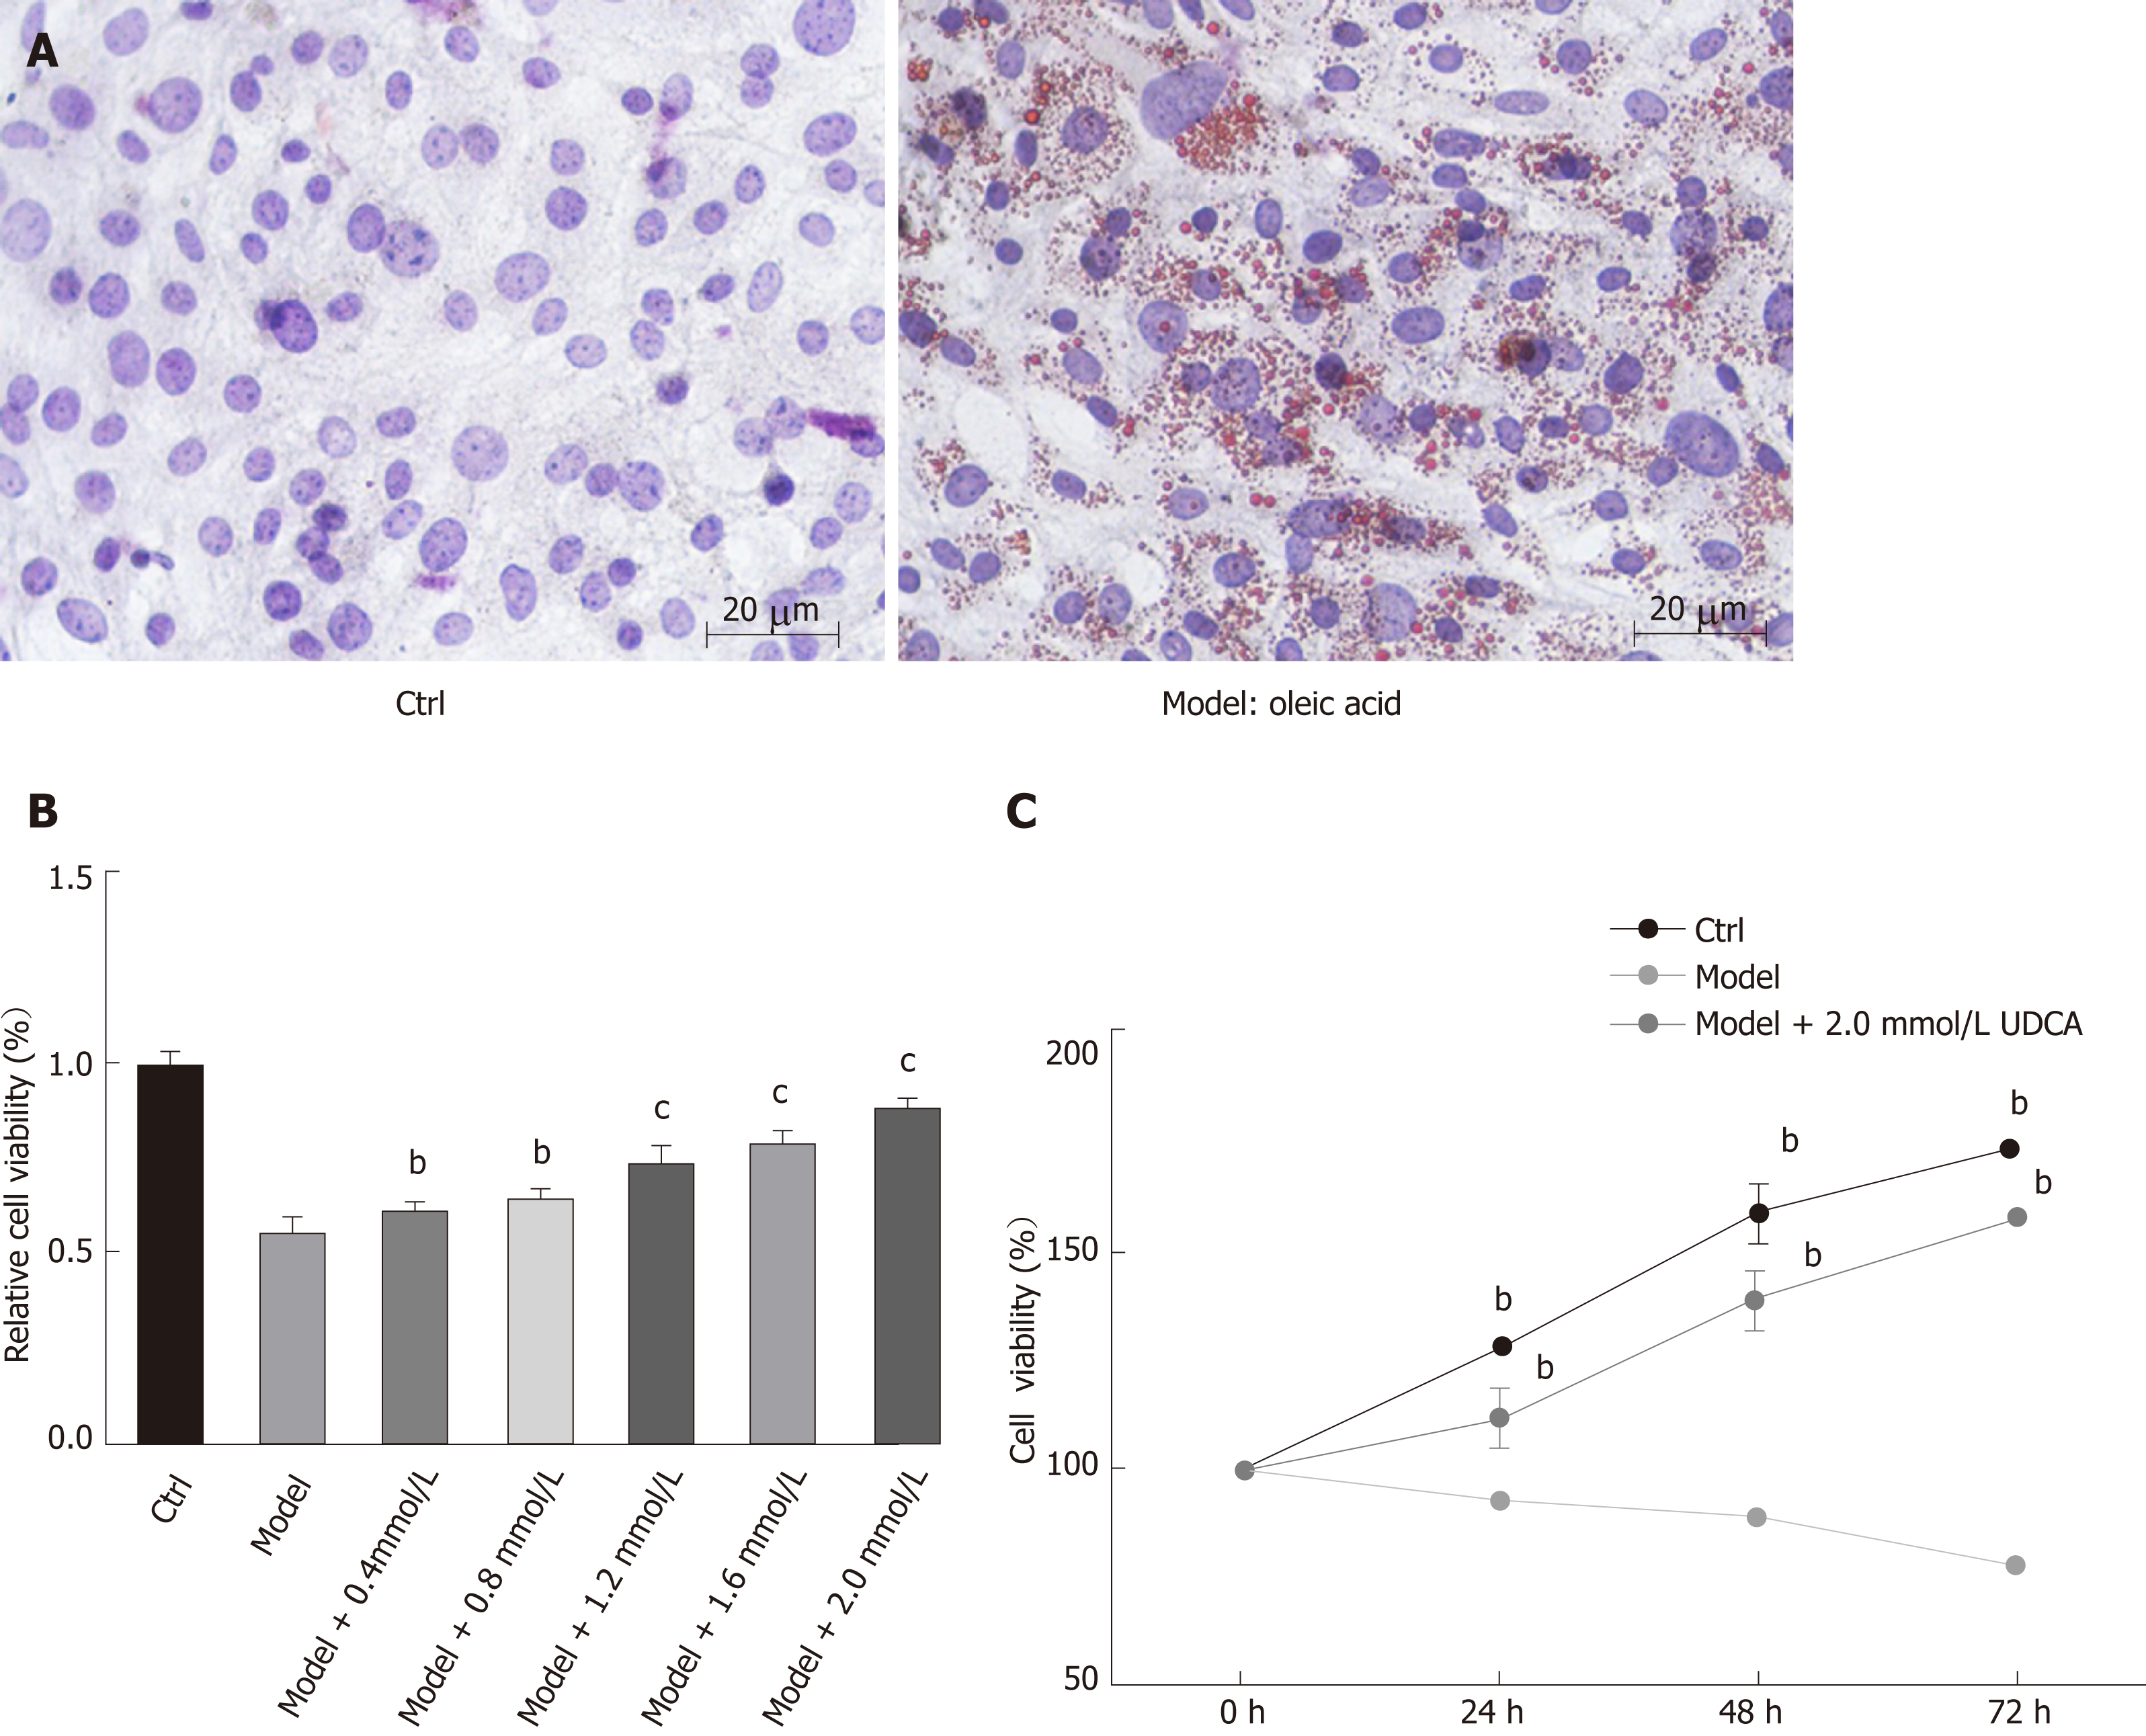
Figure 1 Effect of ursodeoxycholic acid on cell growth ability under the treatment of oleic acid.
A: Oil red O staining of LO2 cells after oleic acid (OA) treatment for 72 h. B: Cell viability of OA-induced LO2 cells measured using the MTT assay under the condition of concentration gradient of ursodeoxycholic acid (UDCA) for 48 h. C: Cell viability of LO2 cells measured using the MTT assay under the condition of oleic acid and 2 mmol/L UDCA for 24 h, 48 h, and 72 h. Scar bar: 20 μm. Data are shown as the mean ± SE. bP < 0.01, cP < 0.001 vs model group. Ctrl: Control; UDCA: Ursodeoxycholic acid; OA: Oleic acid.
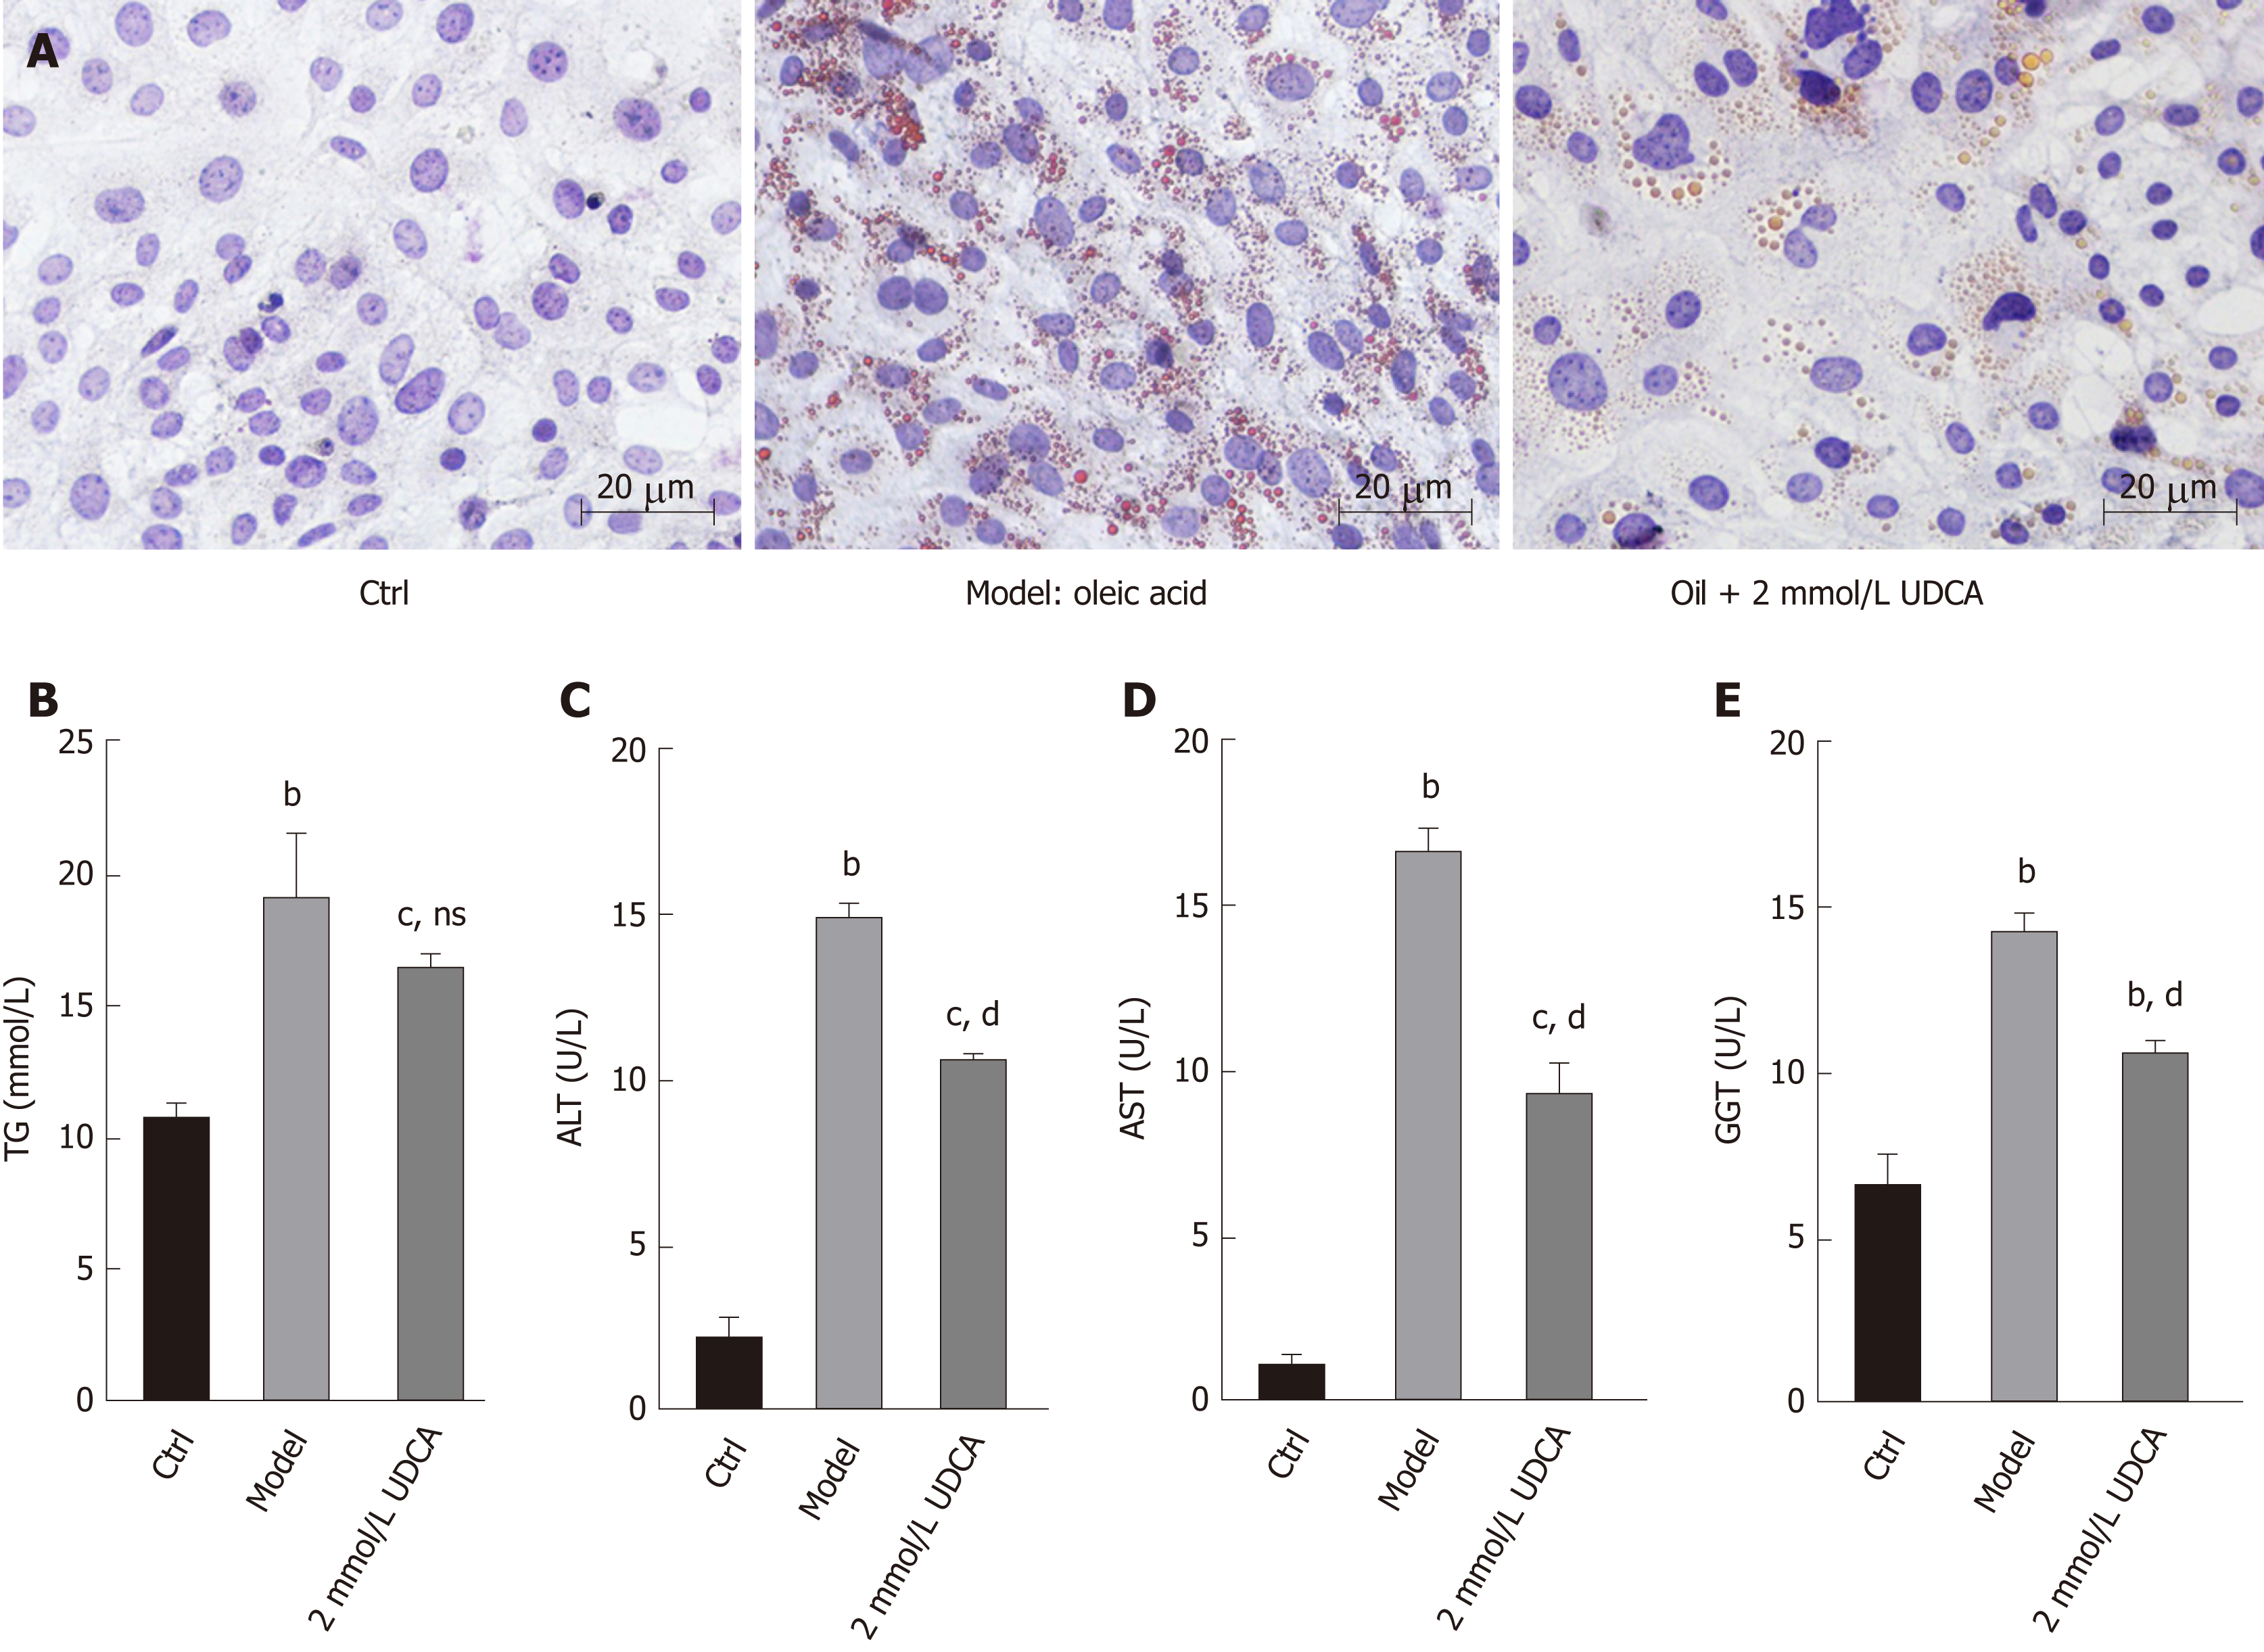
Figure 2 Impact of ursodeoxycholic acid on oleic acid-induced production of lipid profile.
A: Oil red O staining of oleic acid-induced LO2 cells after ursodeoxycholic acid treatment for 72 h. B-E: Measurement of intracellular levels of triglycerides (B), alanine aminotransferase (C), aspartate aminotransferase (D), and gamma-glutamyl transpeptidase (E) by ELISA assay. Scar bar: 20 μm. Data are shown as the mean ± SE. bP < 0.01, cP < 0.001 vs ctrl group; ns vs model group. dP < 0.001 vs model group. Ctrl: Control; UDCA: Ursodeoxycholic acid; OA: Oleic acid; TG: Triglycerides; ALT: Alanine aminotransferase; AST: Aspartate aminotransferase; GGT: Gamma-glutamyl transpeptidase; ns: No significant statistical difference.
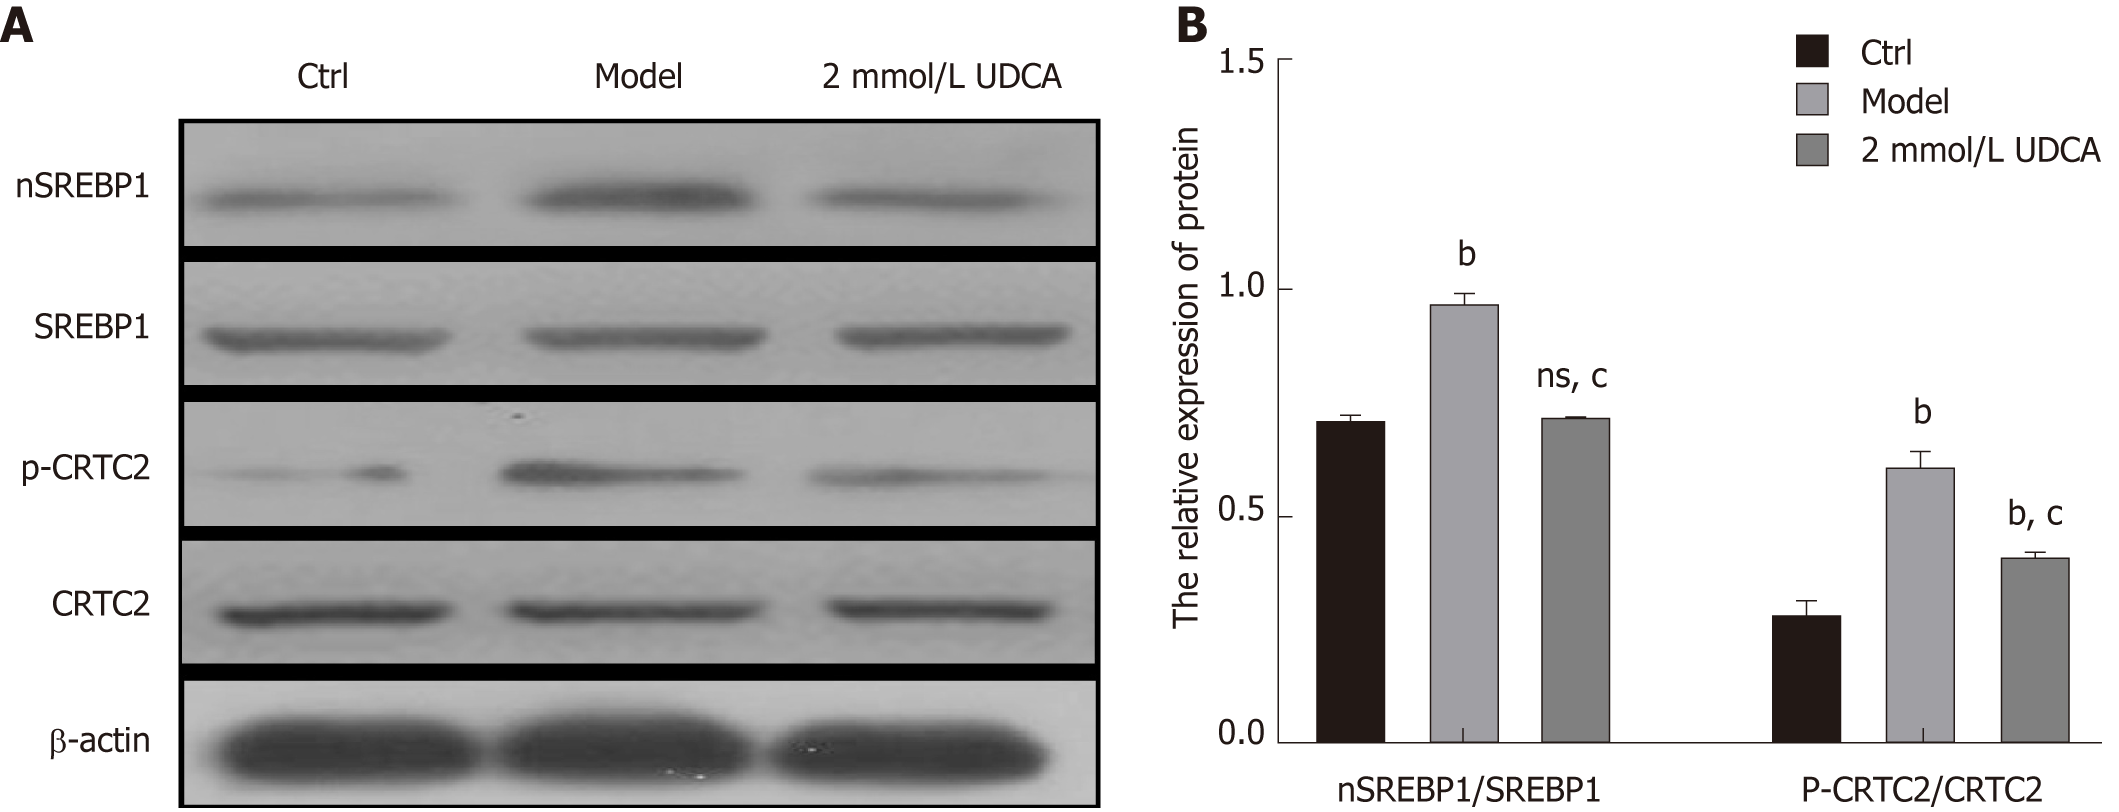
Figure 3 Alteration of CRTC2/SREBP-1 signaling pathway under the condition of ursodeoxycholic acid in oleic acid-induced LO2 cells.
A: CRTC2 activity and nSREBP-1 expression detected by Western blot assay. B: Relative quantitative analysis of phosphorylated CRTC2 and mature SREBP-1 in LO2 cells. Data are shown as the mean ± SE. bP < 0.01, ns vs ctrl group; cP < 0.01 vs model group. Ctrl: Control; UDCA: Ursodeoxycholic acid; ns: no significant statistical difference.
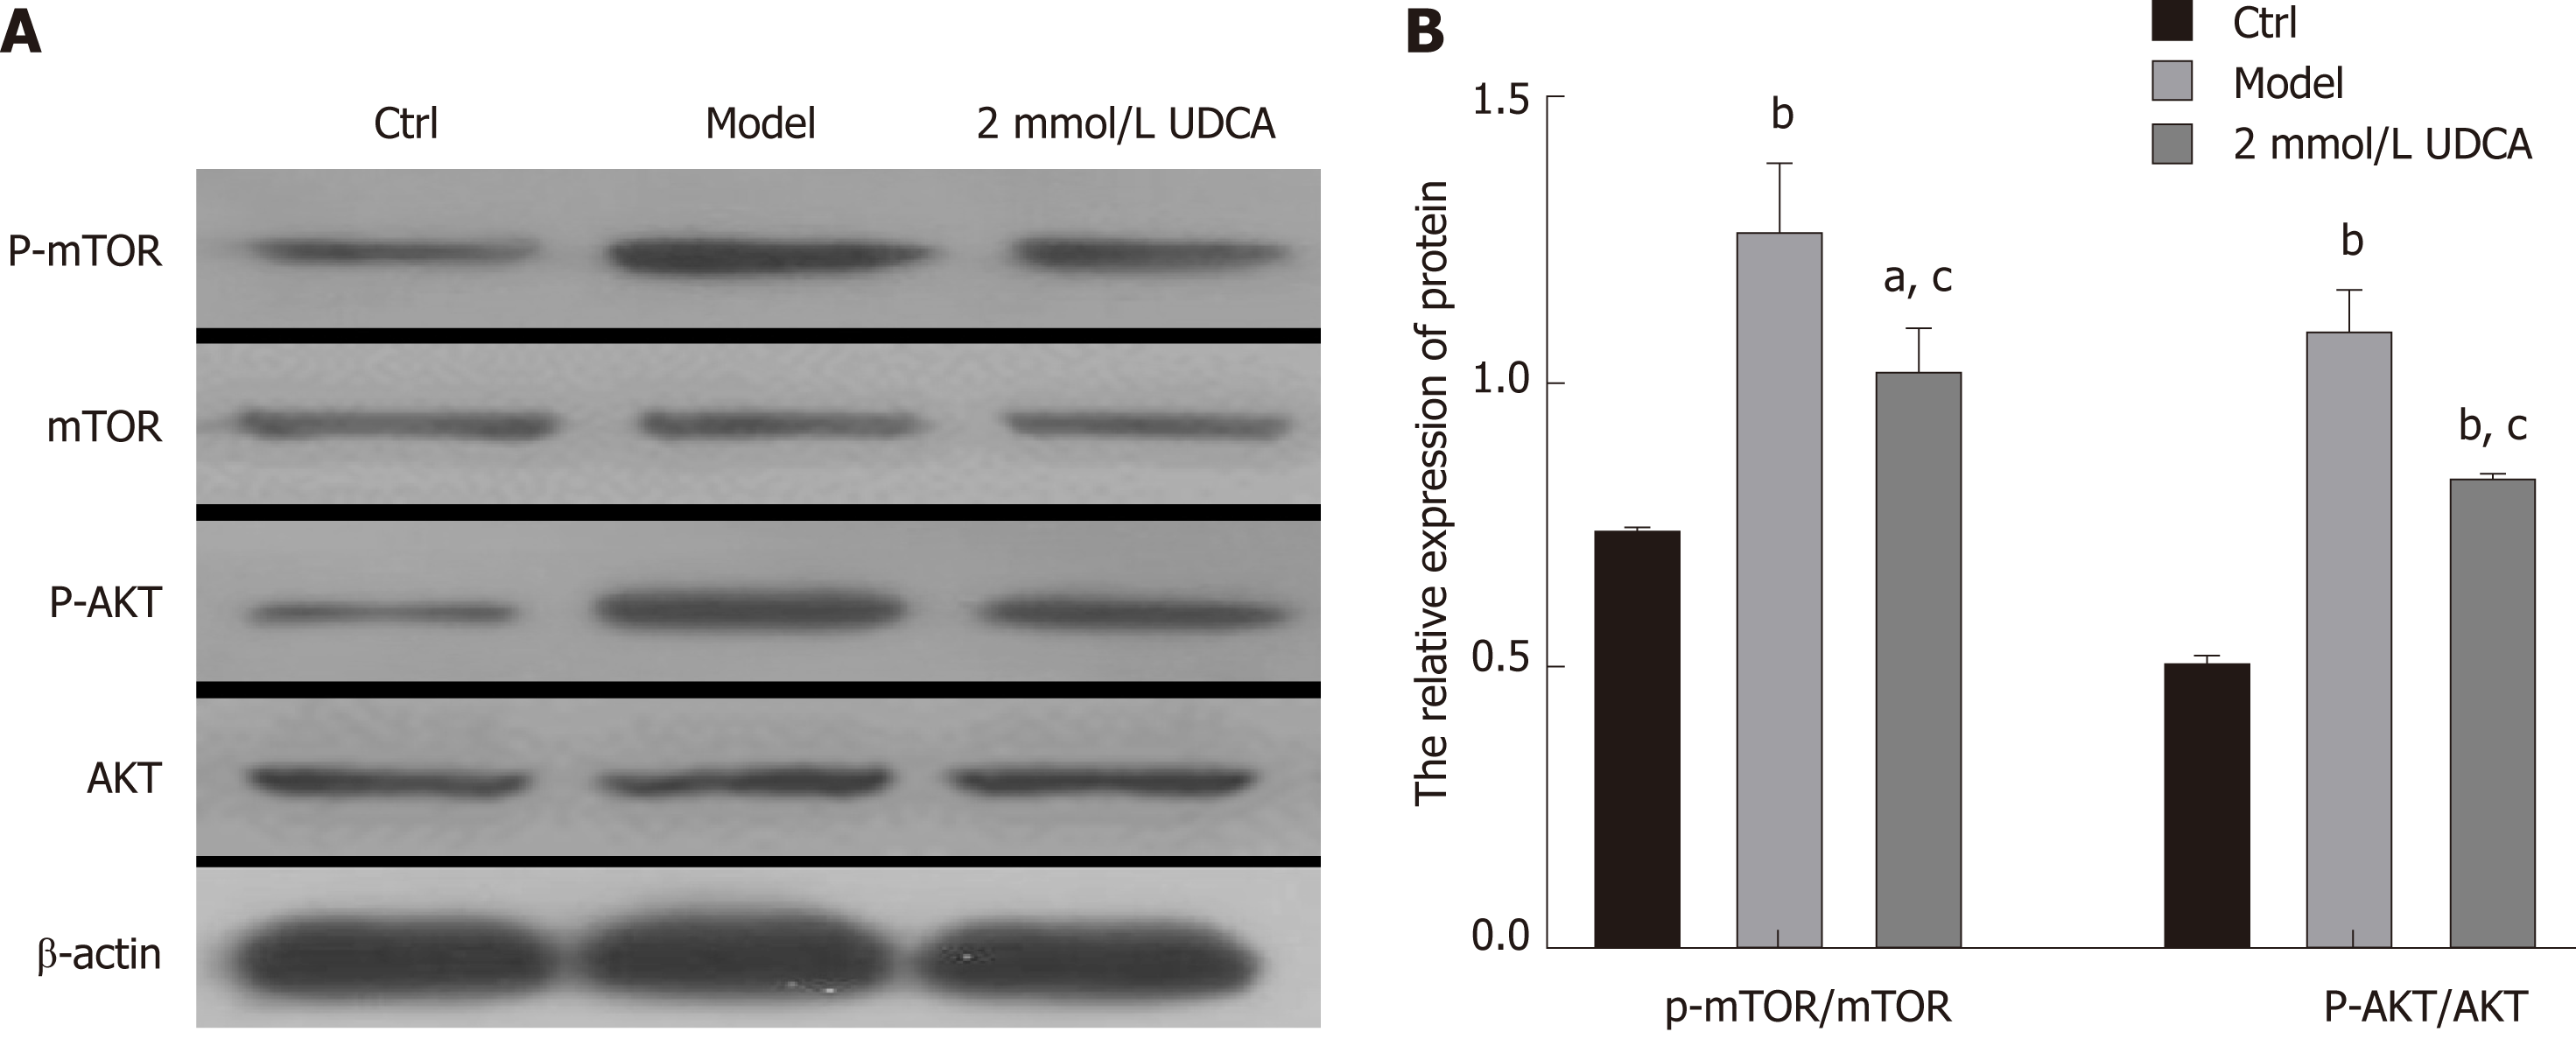
Figure 4 Effect of ursodeoxycholic acid on oleic acid-induced activation of the AKT/mTOR signaling pathway.
A: Activation of AKT and mTOR detected by Western blot assay. B: Relative quantitative analysis of phosphorylated AKT and mTOR in LO2 cells. Data are shown as the mean ± SE. aP < 0.05, bP < 0.01 vs ctrl group; cP < 0.01 vs model group. Ctrl: Control; UDCA: Ursodeoxycholic acid.
- Citation: Hu J, Hong W, Yao KN, Zhu XH, Chen ZY, Ye L. Ursodeoxycholic acid ameliorates hepatic lipid metabolism in LO2 cells by regulating the AKT/mTOR/SREBP-1 signaling pathway. World J Gastroenterol 2019; 25(12): 1492-1501
- URL: https://www.wjgnet.com/1007-9327/full/v25/i12/1492.htm
- DOI: https://dx.doi.org/10.3748/wjg.v25.i12.1492


