Copyright
©The Author(s) 2019.
World J Gastroenterol. Mar 14, 2019; 25(10): 1197-1209
Published online Mar 14, 2019. doi: 10.3748/wjg.v25.i10.1197
Published online Mar 14, 2019. doi: 10.3748/wjg.v25.i10.1197
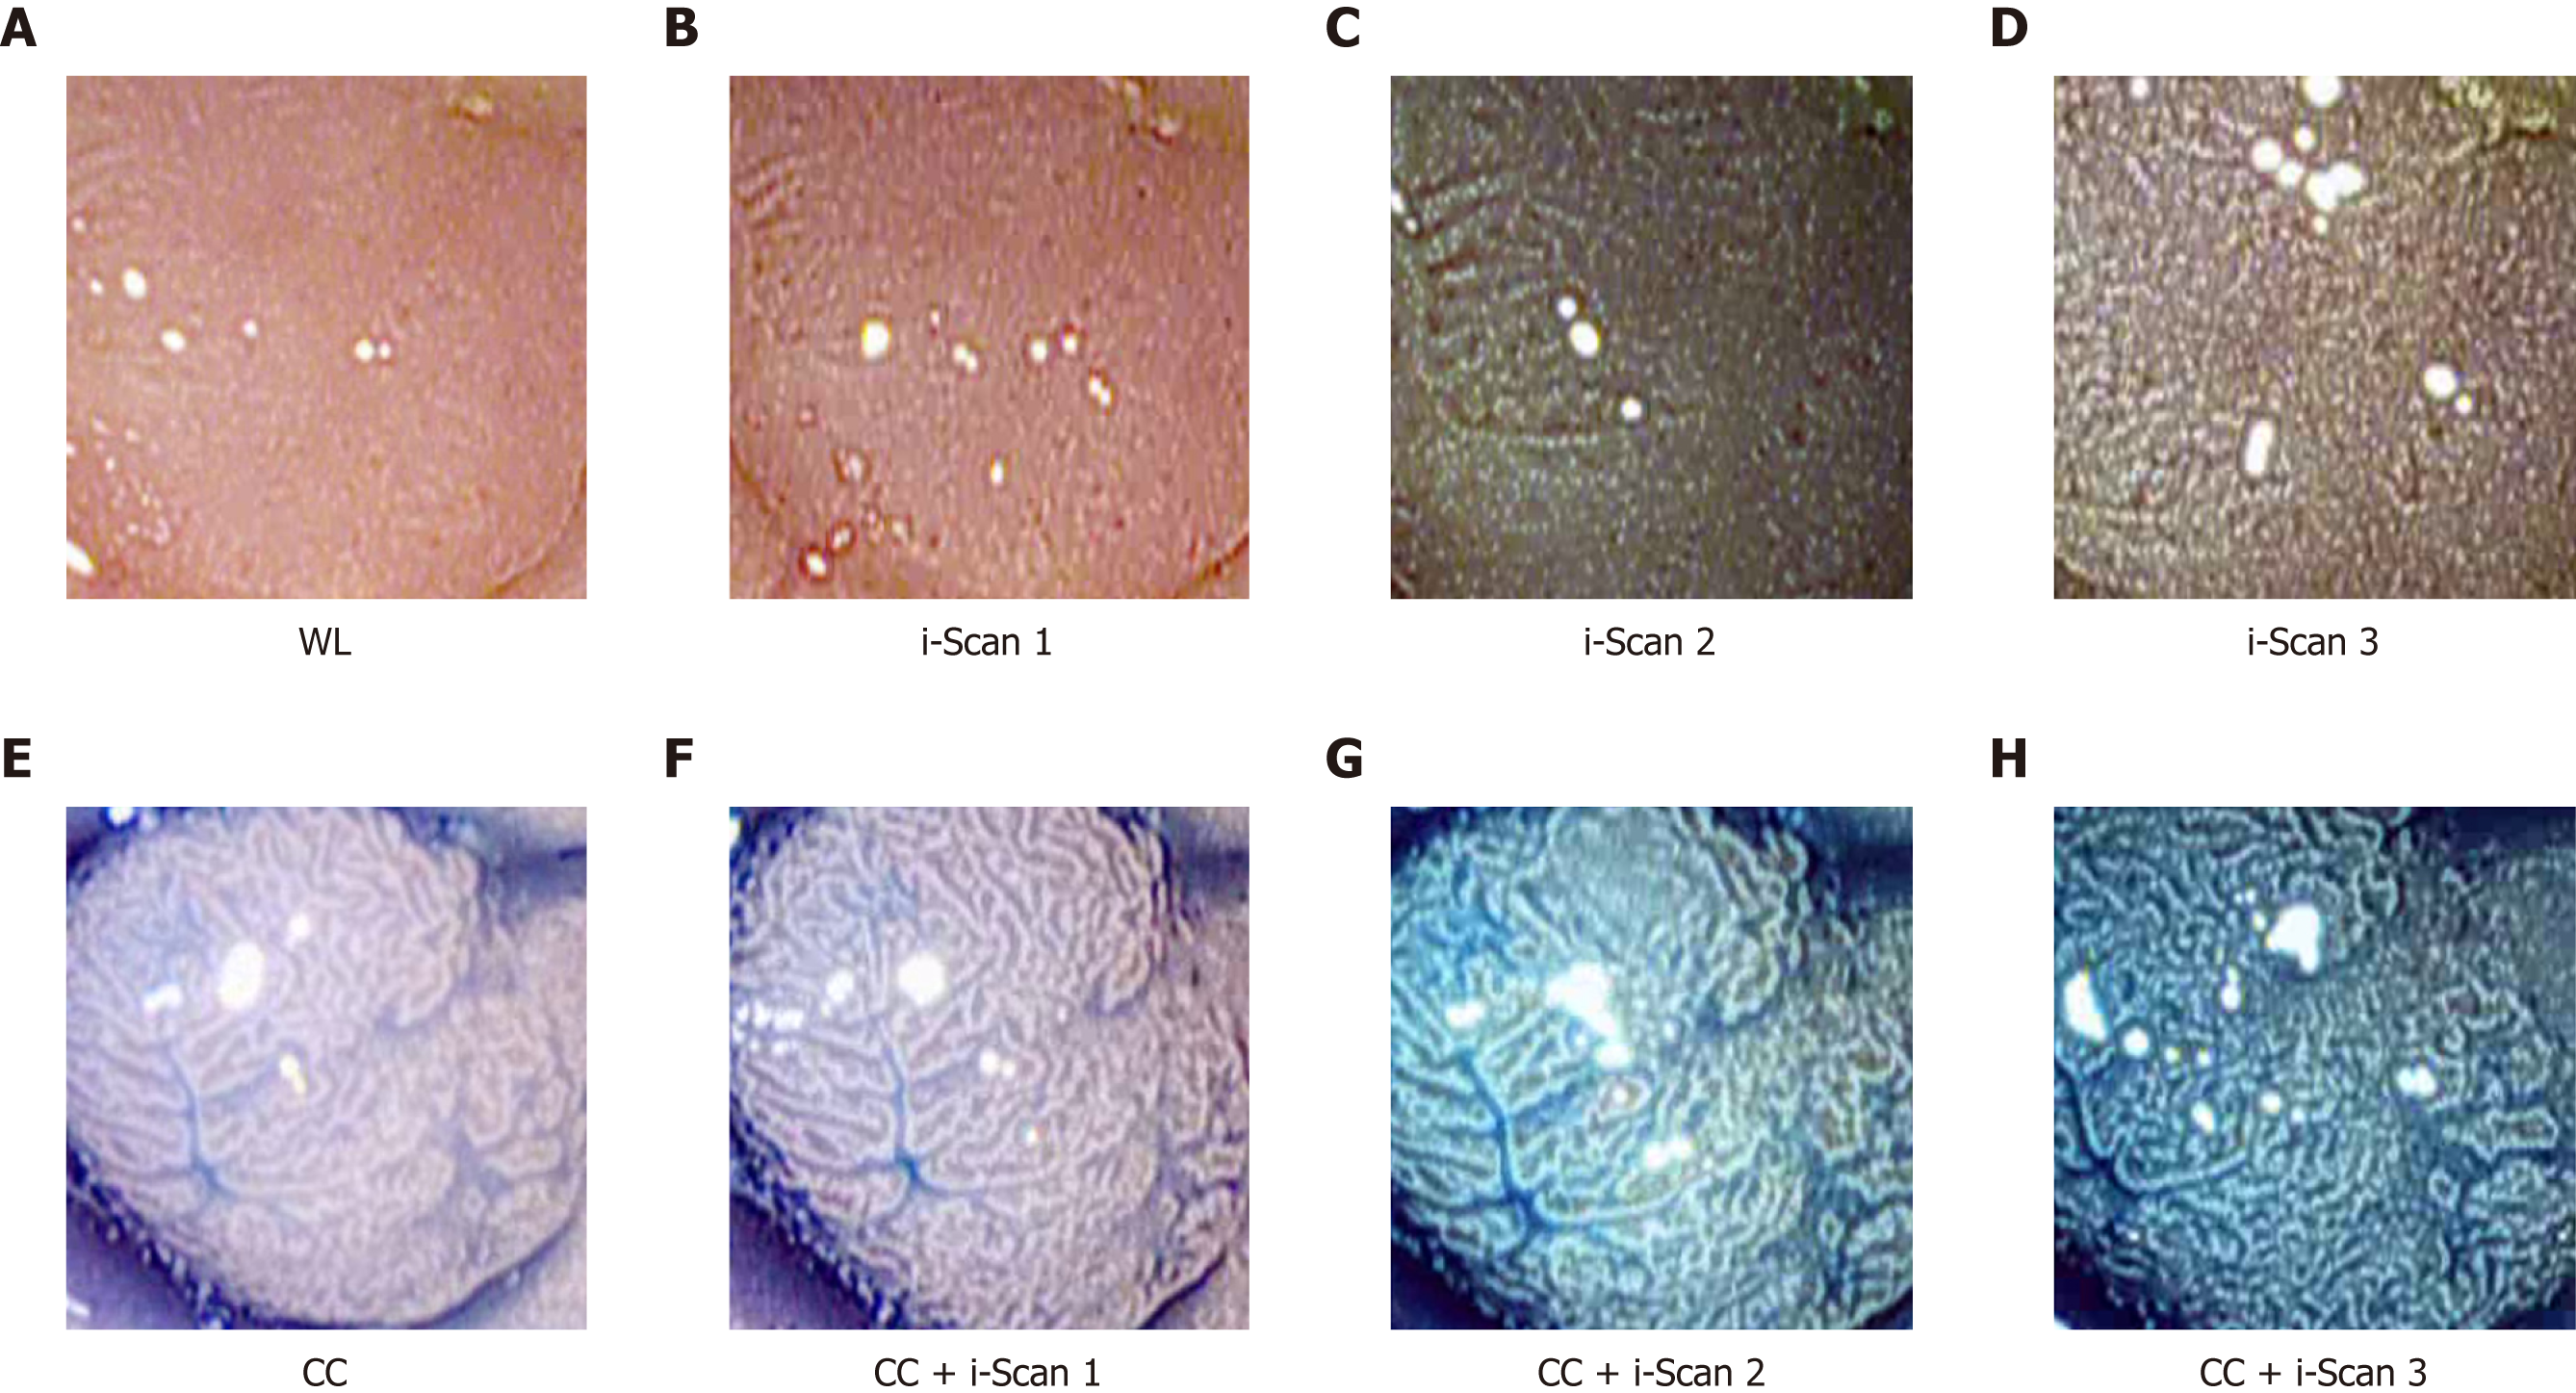
Figure 1 Images of a polyp using digital (i-Scan) and/or conventional chromoendoscopy.
WL: White light endoscopy; CC: Conventional chromoendoscopy.
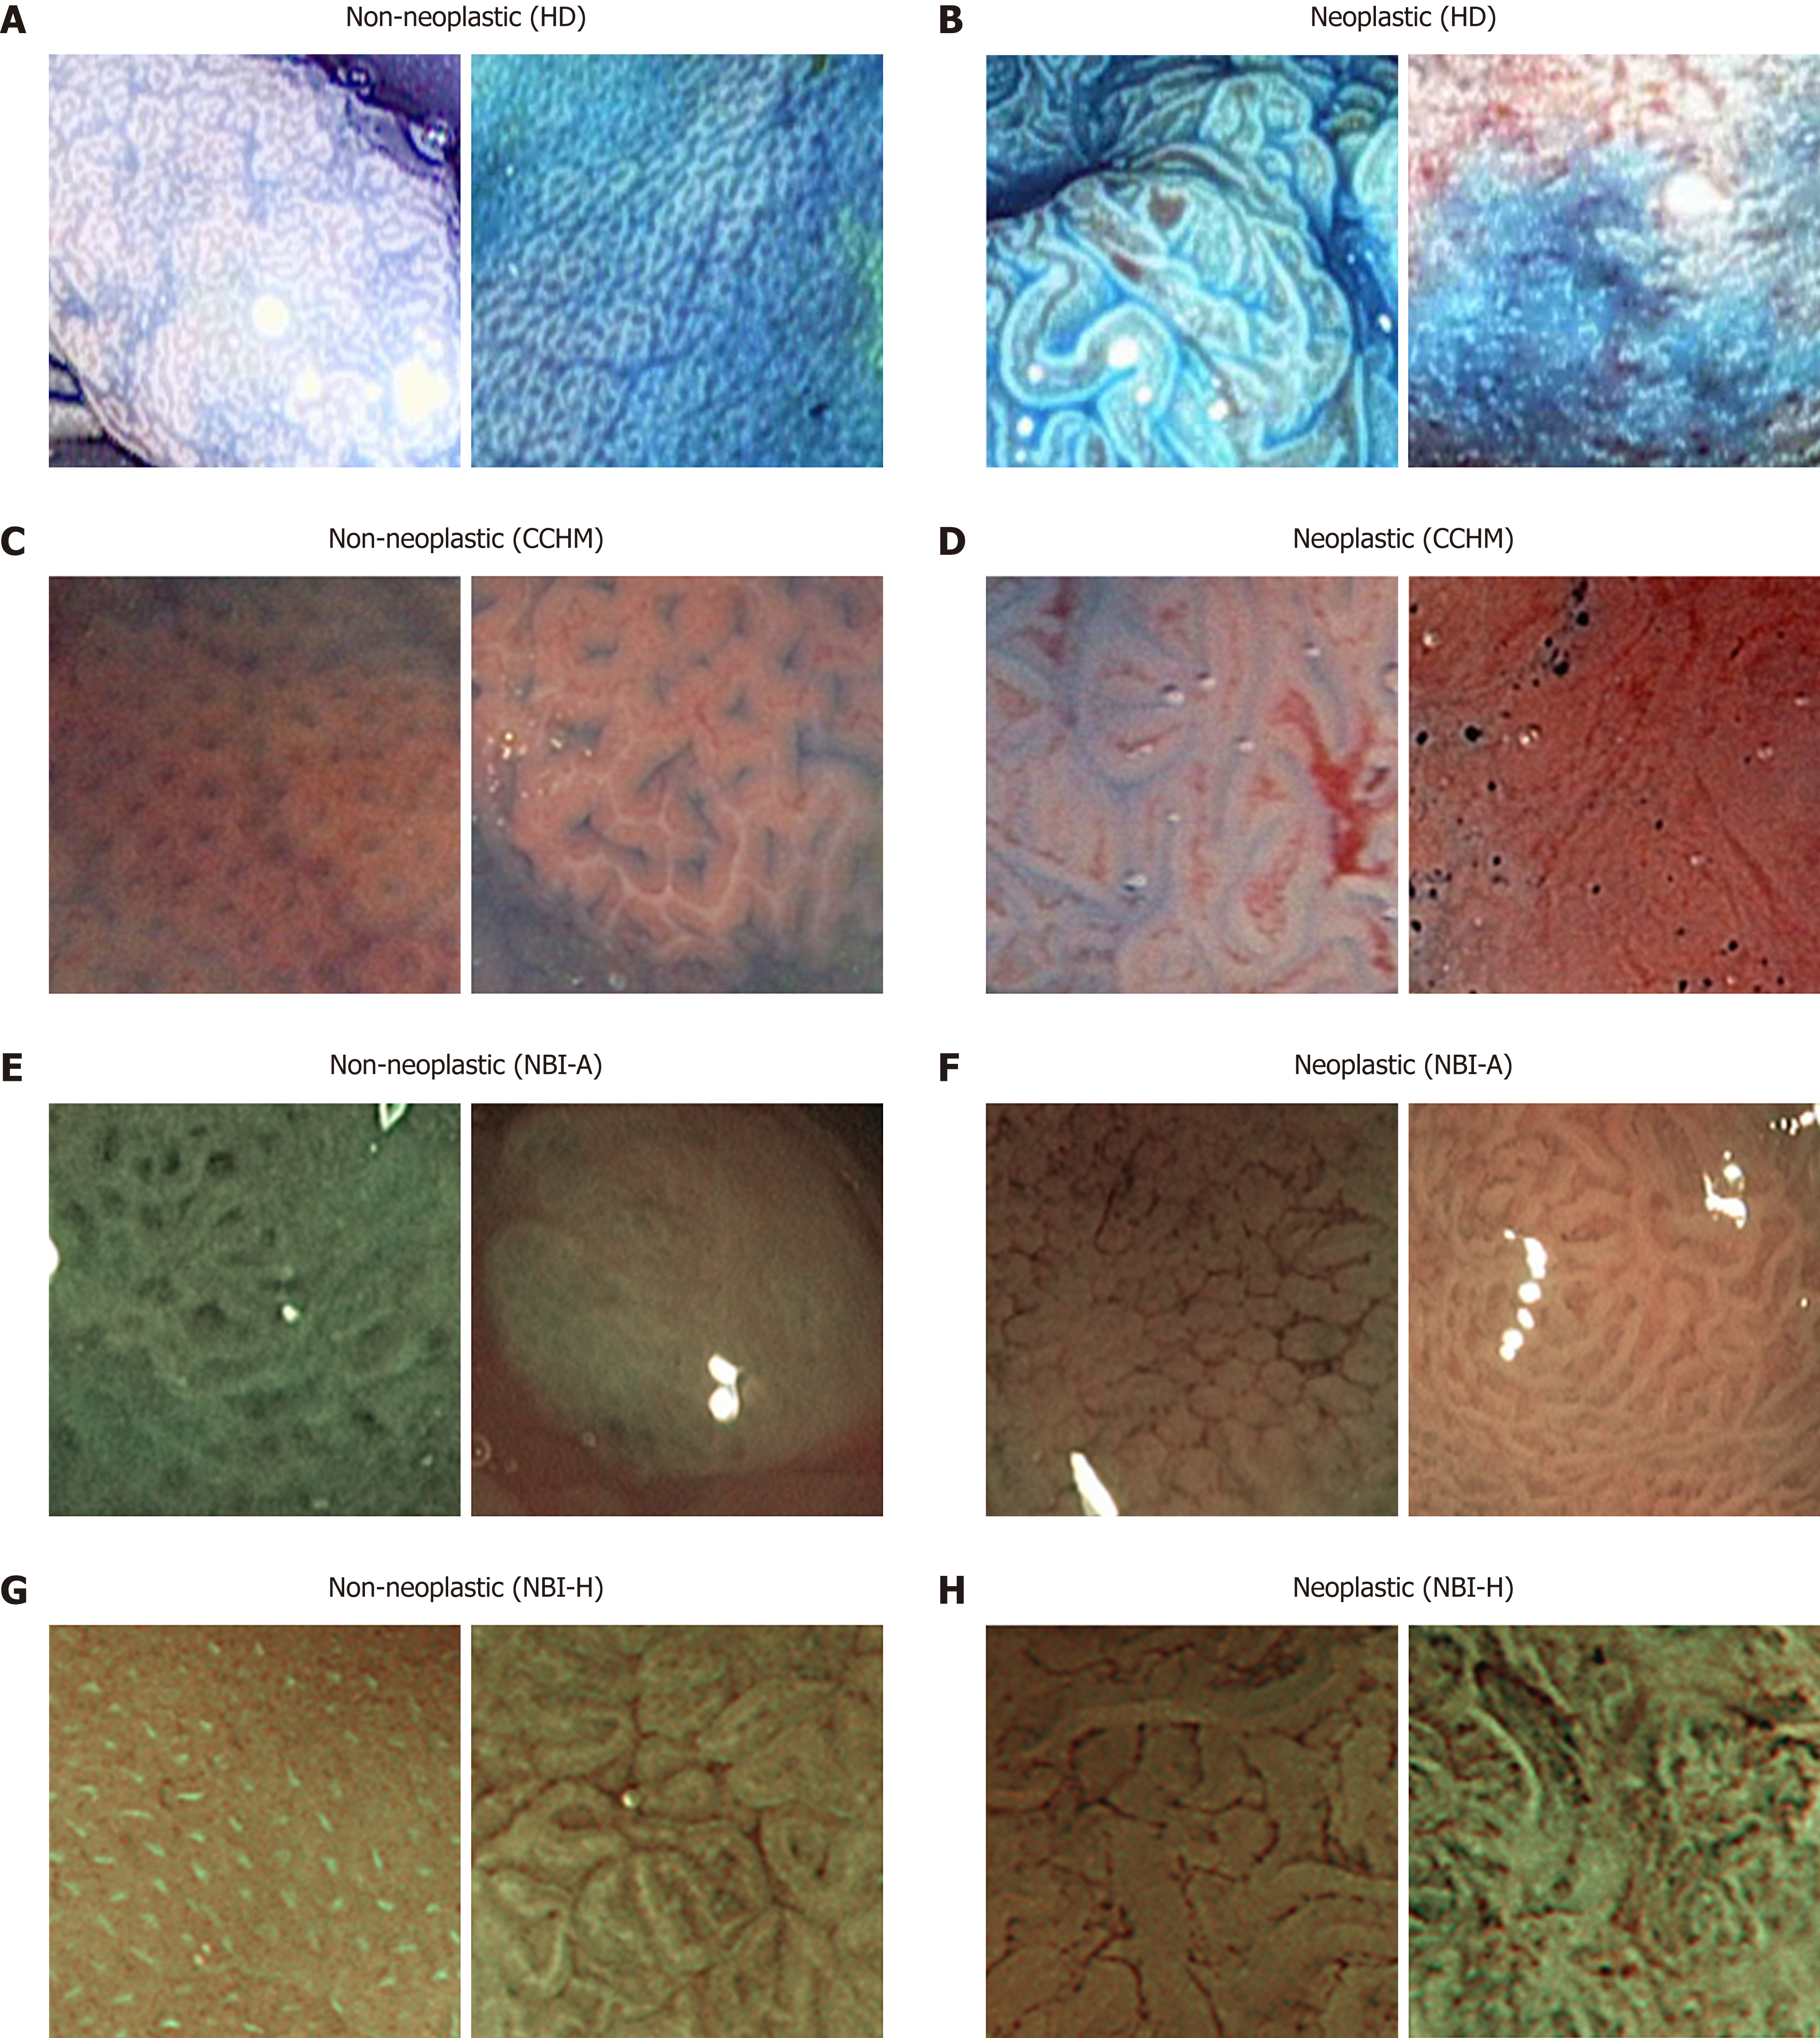
Figure 2 Example images of the two classes from the employed image databases.
HD: High-definition endoscopy; CCHM: High-magnification chromoendoscopy; NBI-A: High-magnification narrow-band imaging, Aachen; NBI-H: High-magnification narrow-band imaging, Hiroshima.
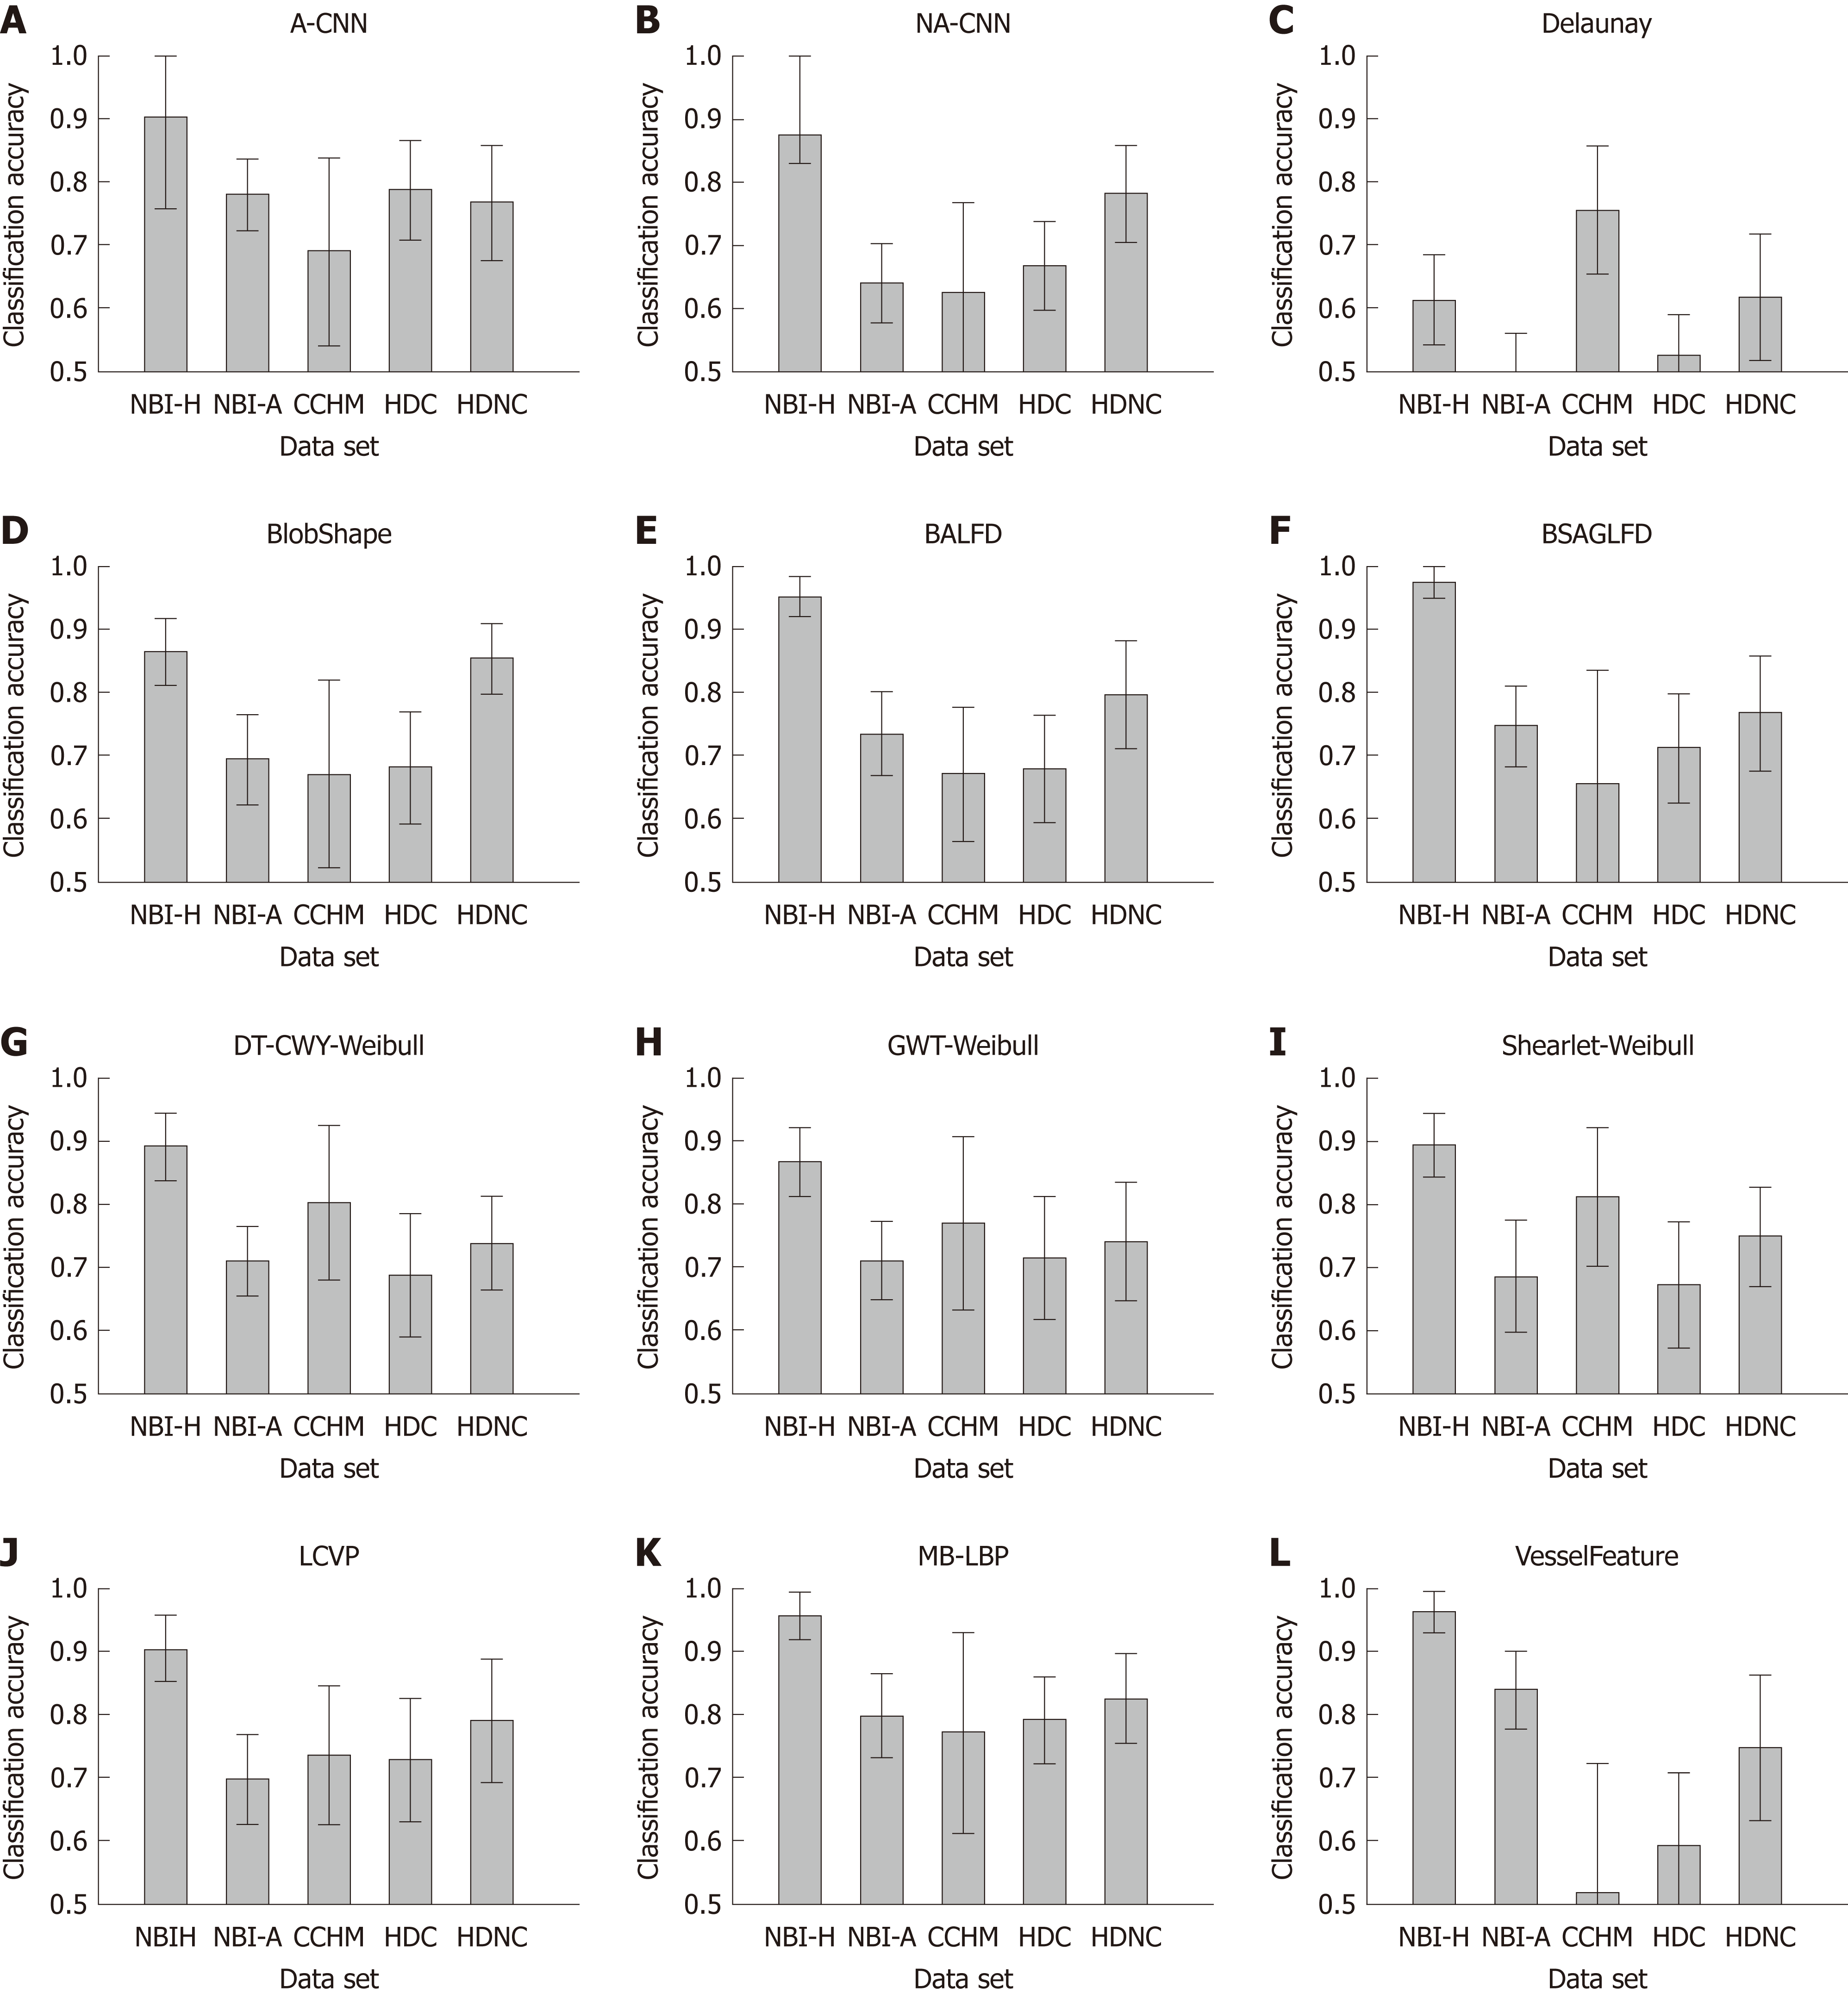
Figure 3 Mean classification accuracies and standard deviations of the methods per data set.
HDC: High-definition chromoendoscopy; HDNC: High-definition, no chromoendoscopy; CCHM: High-magnification chromoendoscopy; NBI-A: High-magnification narrow-band imaging, Aachen; NBI-H: High-magnification narrow-band imaging, Hiroshima; A-CNN: Adapted CNN; NA-CNN: Non-adapted CNN; DT-CWT: Dual-tree complex wavelet transform; GWT: Gabor wavelet transform.
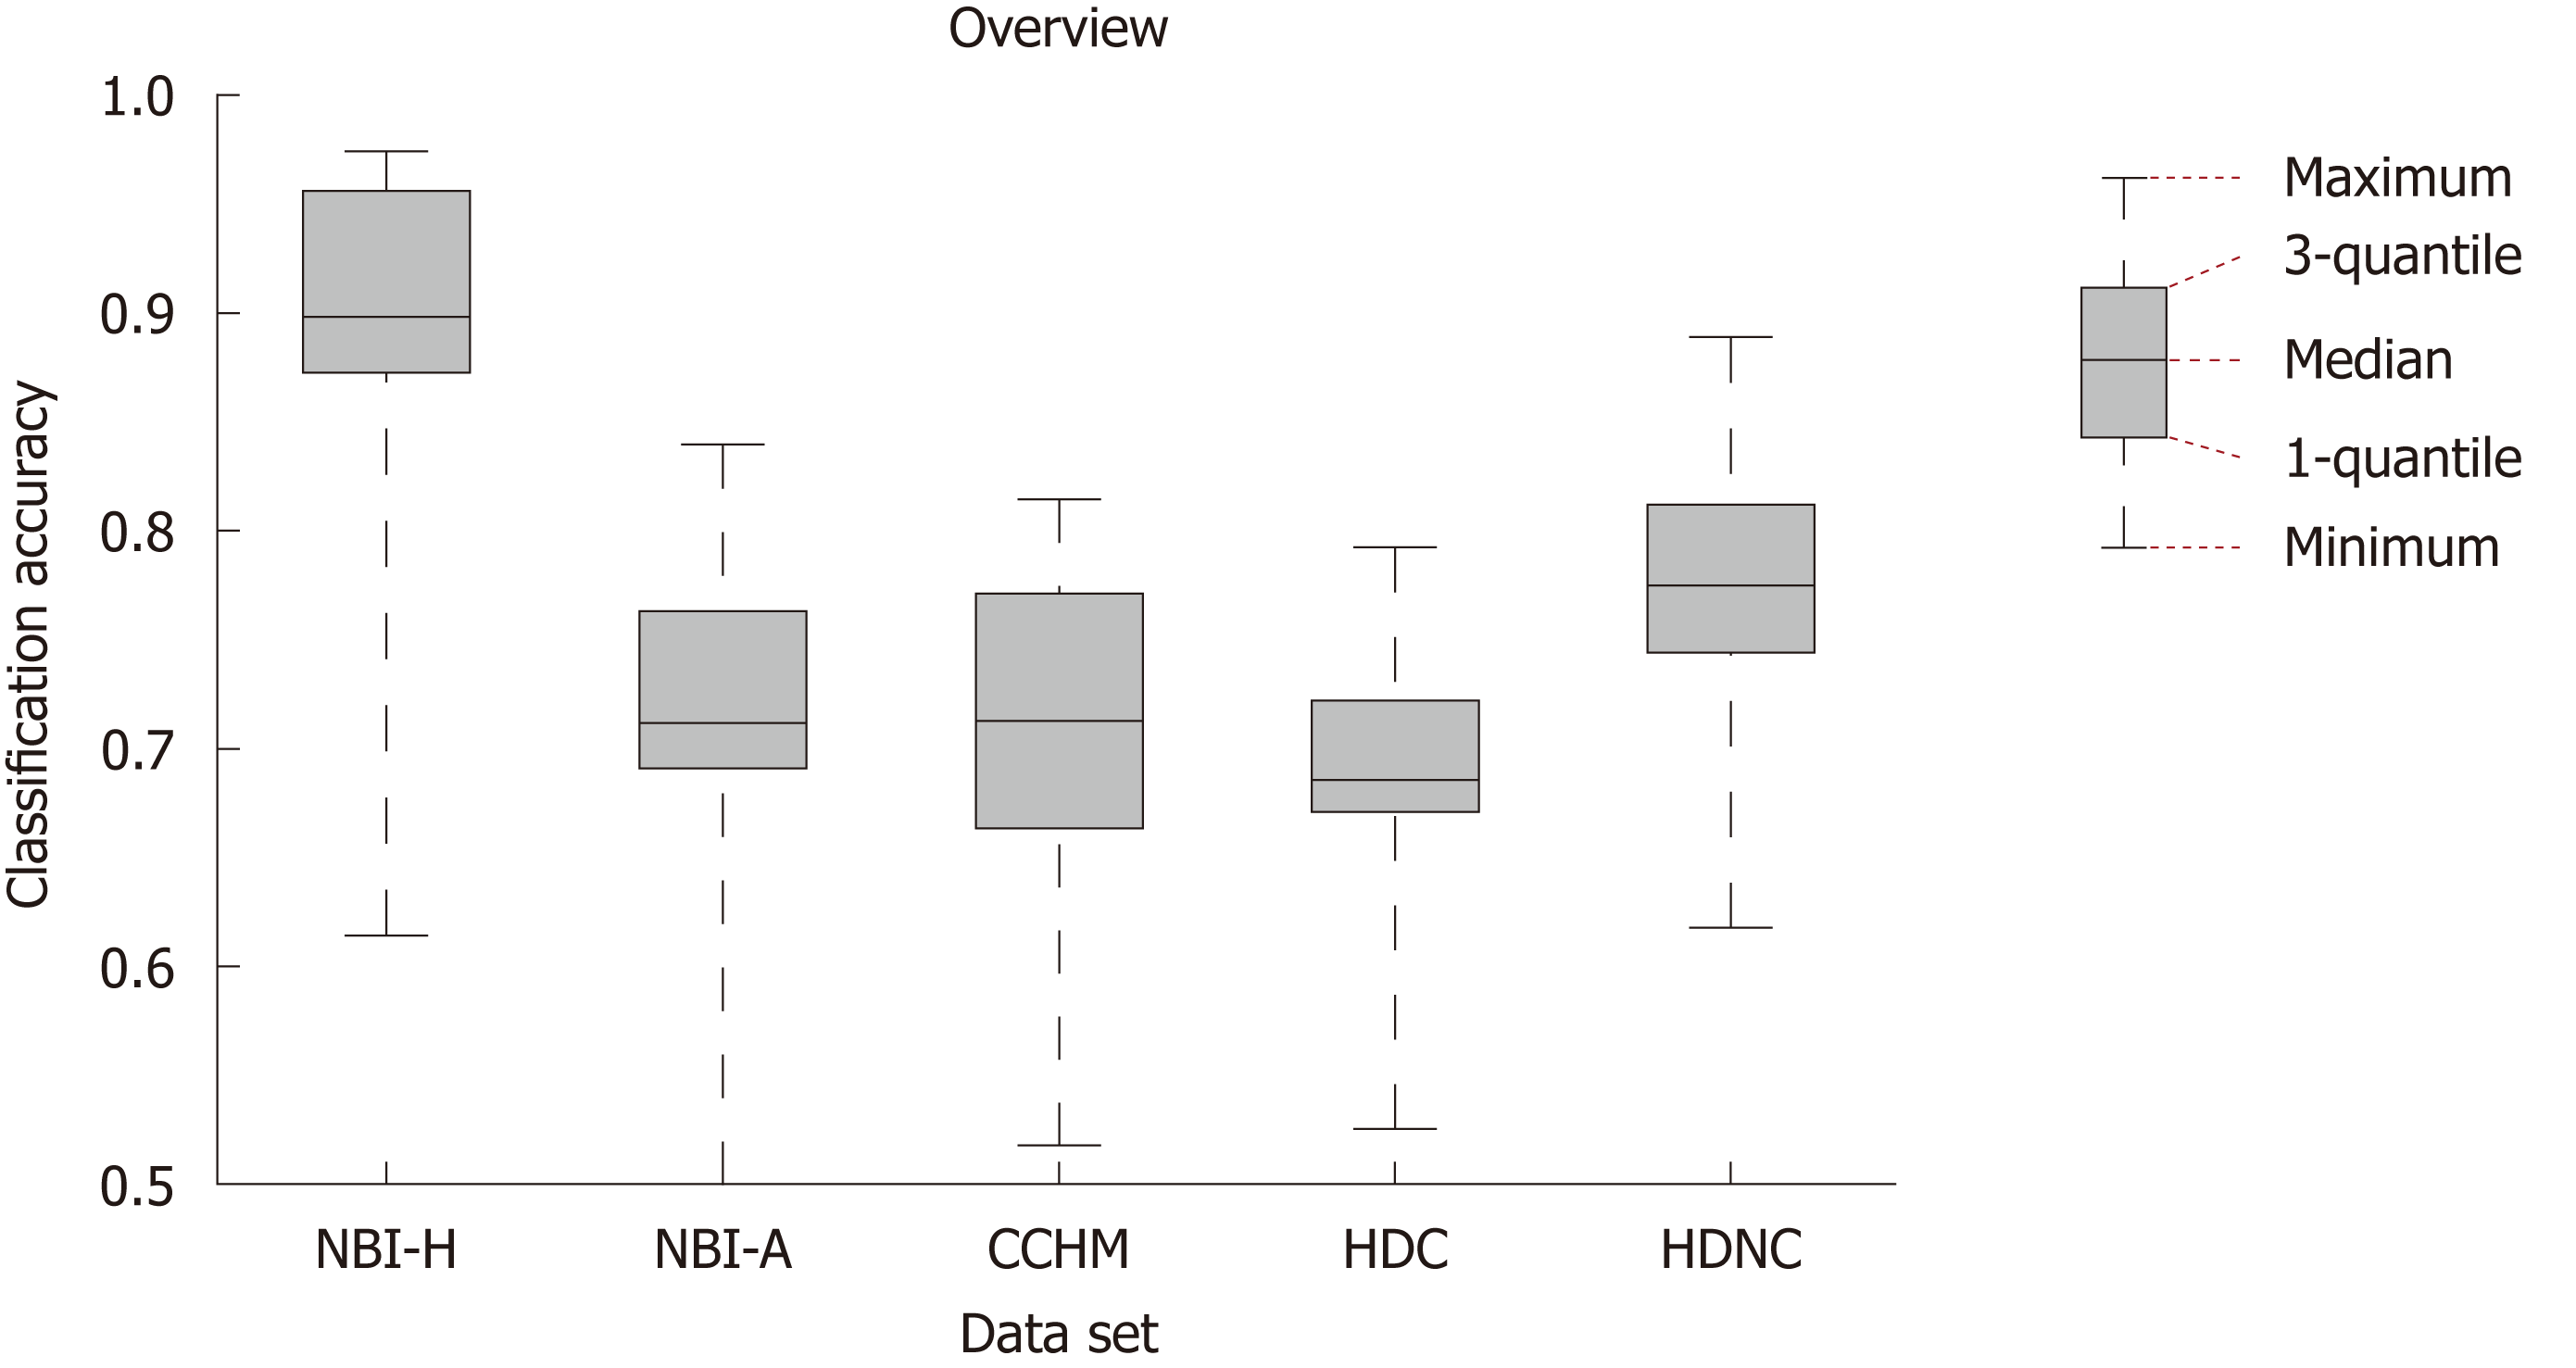
Figure 4 Box plot showing the median, the quantiles and the minimum and maximum accuracies obtained by the different feature extraction techniques per imaging modality.
NBI-H: High-magnification narrow-band imaging, Hiroshima; NBI-A: High-magnification narrow-band imaging, Aachen; CCHM: High-magnification chromoendoscopy; HDC: High-definition chromoendoscopy; HDNC: High-definition, no chromoendoscopy.
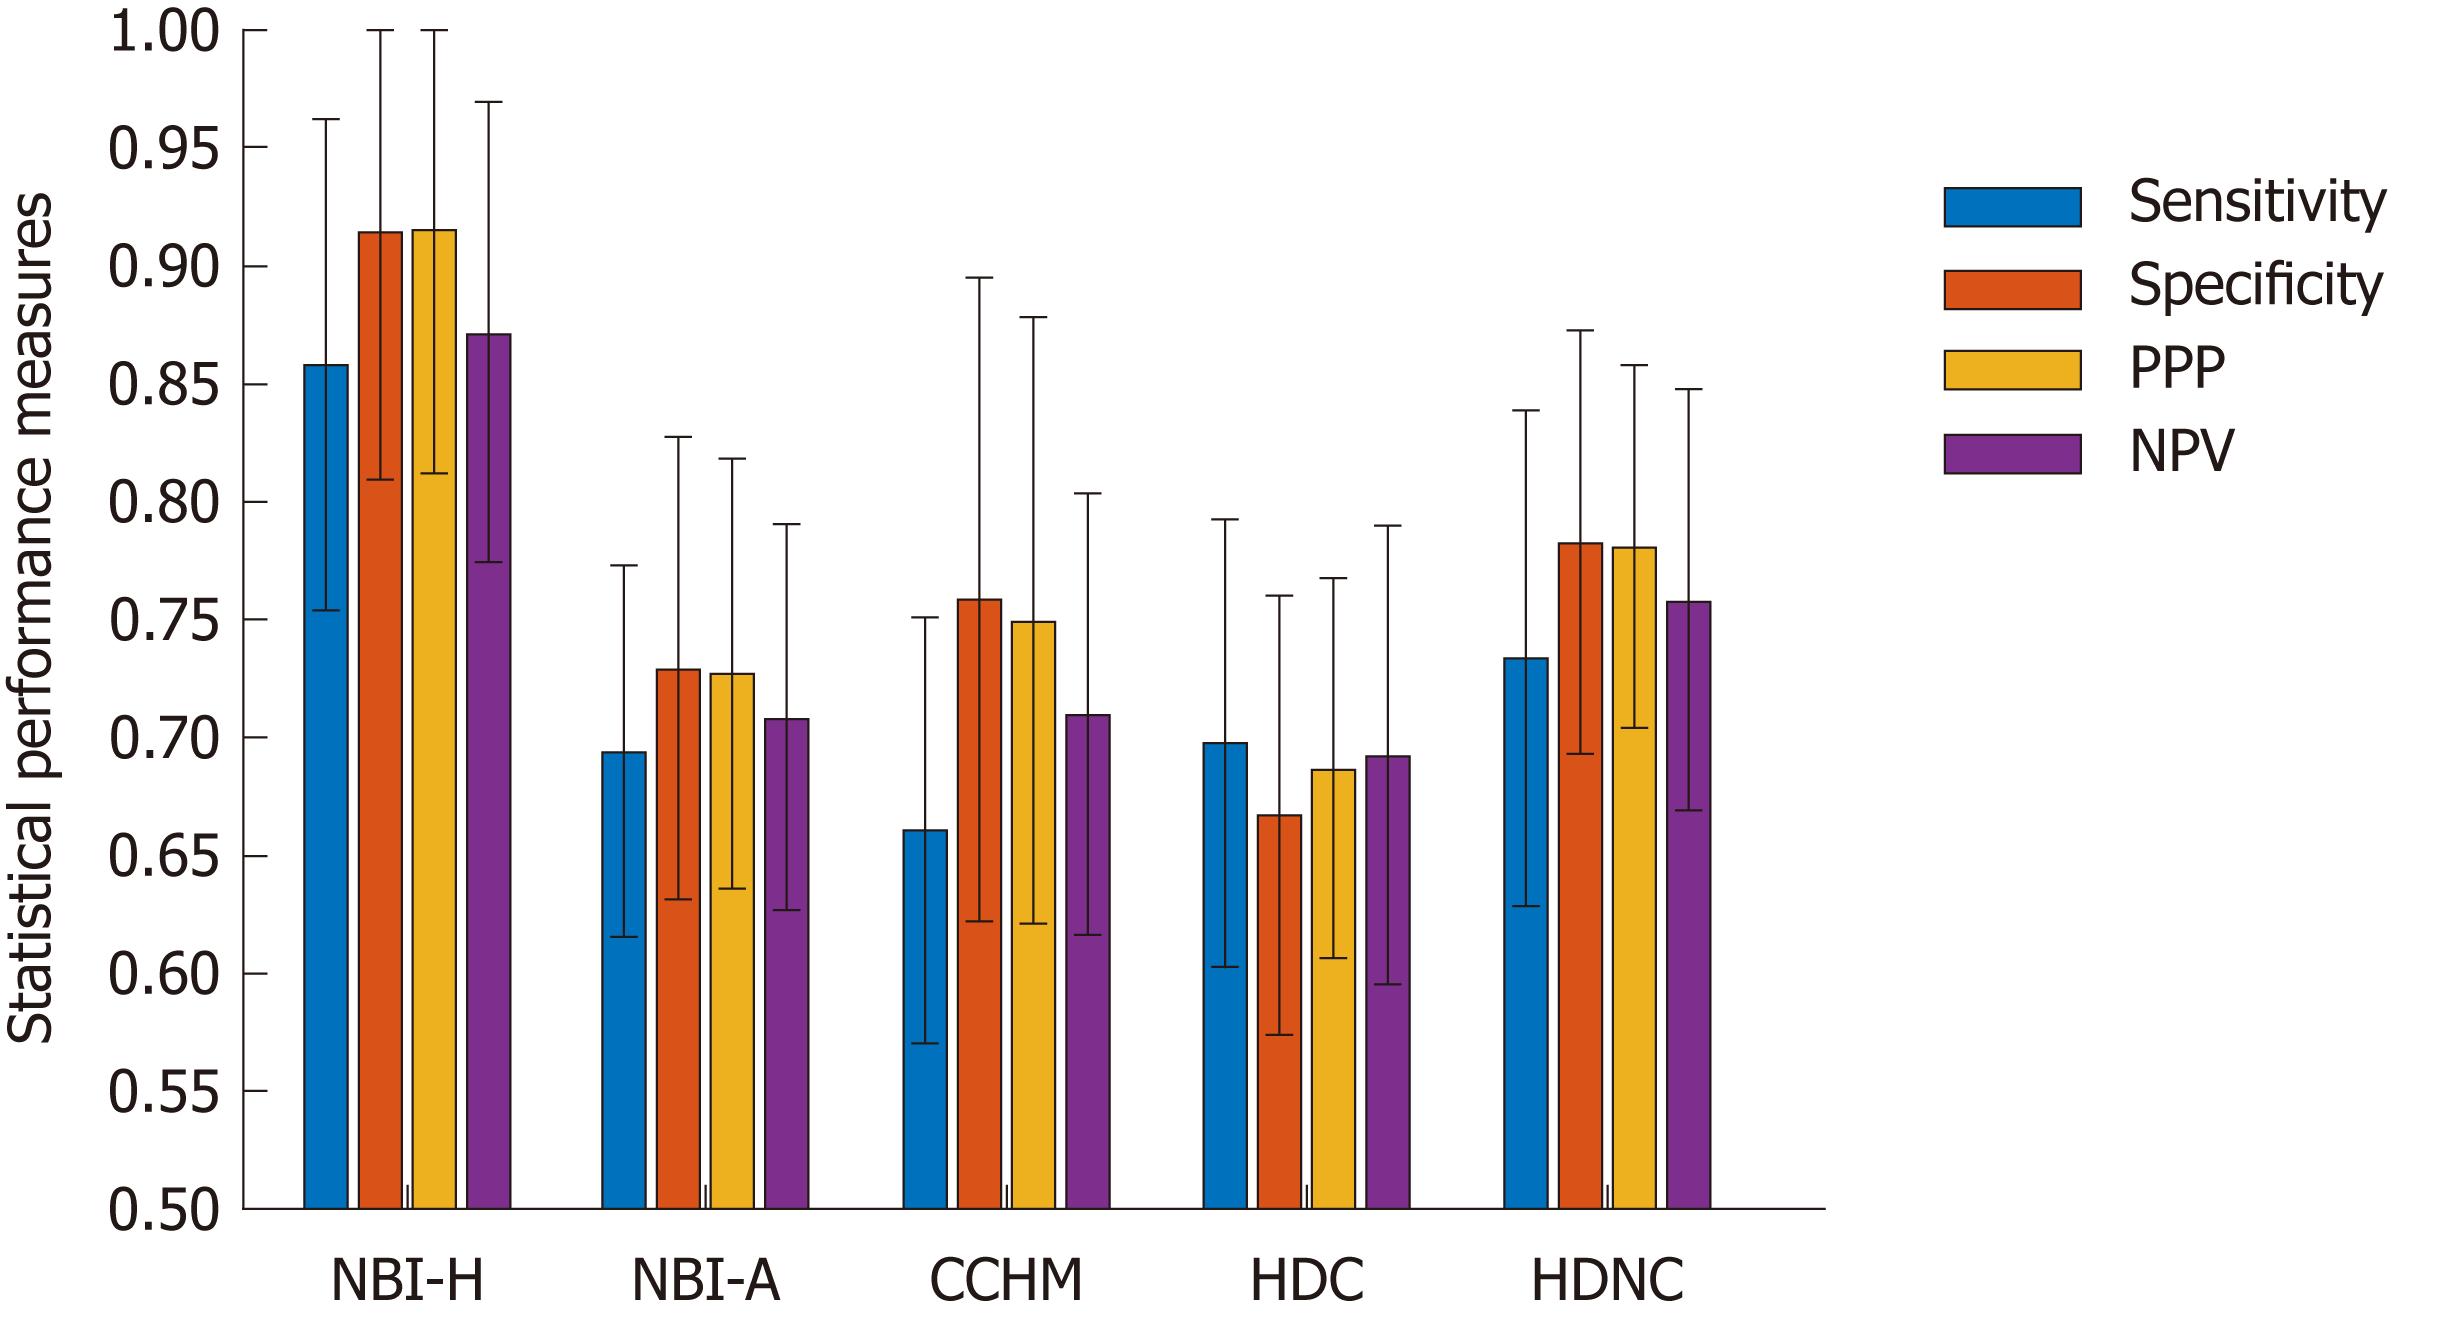
Figure 5 Bar plot showing the means and standard deviations of four statistical performance measures (sensitivity, specificity, positive predictive value and negative predictive value) over the different feature extraction techniques per data set.
NPV: Negative predictive value; PPV: Positive predictive value; NBI-H: High-magnification narrow-band imaging, Hiroshima; NBI-A: High-magnification narrow-band imaging, Aachen; CCHM: High-magnification chromoendoscopy; HDC: High-definition chromoendoscopy; HDNC: High-definition, no chromoendoscopy.
Figure 6 Example images of the high magnification narrow-band imaging Aachen database showing poor illumination (A) poor visibility of mucosal structures (B) and reflections (C).
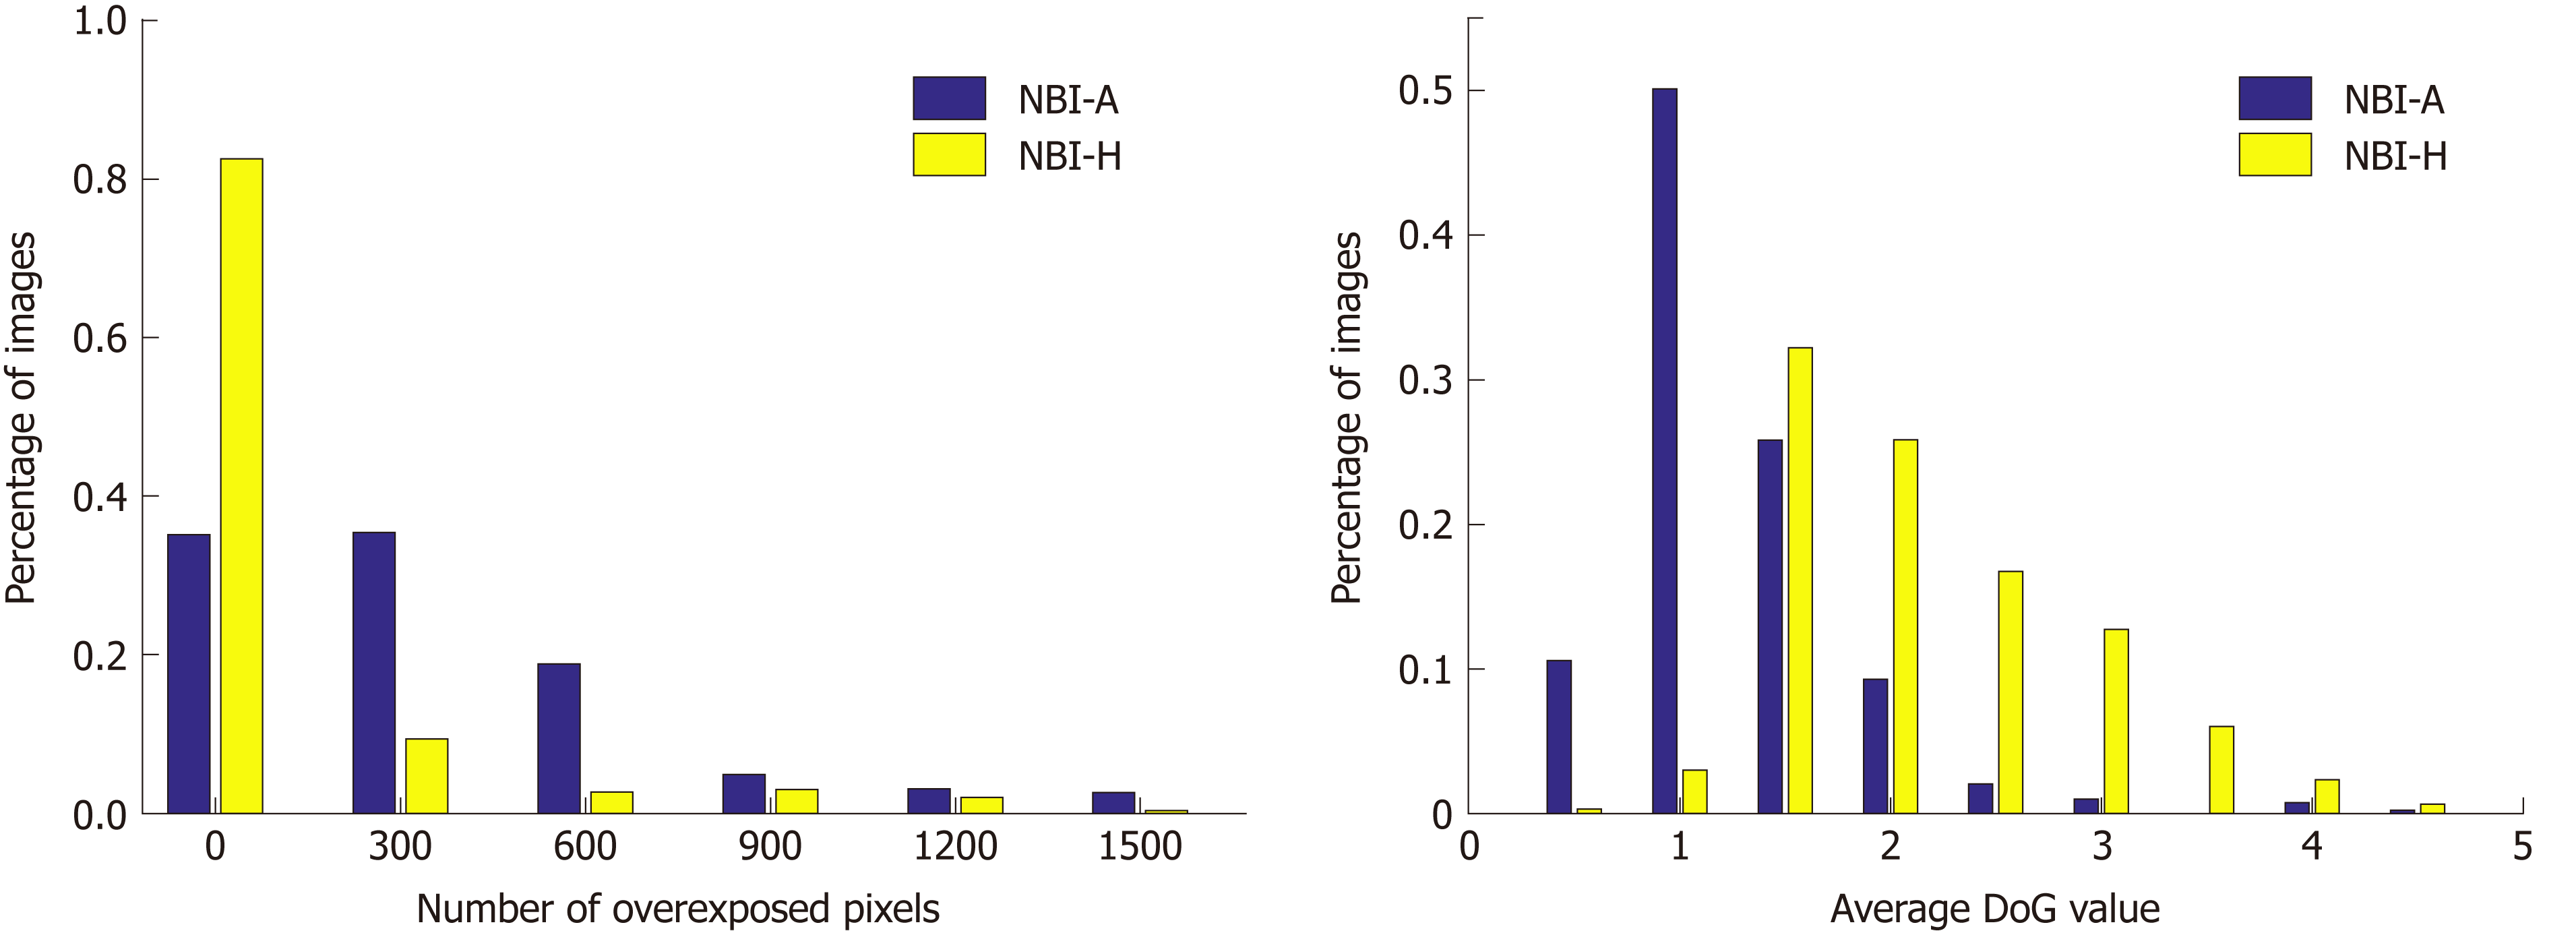
Figure 7 Histograms showing the number of overexposed pixels (A) respectively the average difference of Gaussians values (B) per image of the two narrow-band imaging databases.
NBI-A: High-magnification narrow-band imaging, Aachen; NBI-H: High-magnification narrow-band imaging, Hiroshima; DoG: Difference of Gaussians.
- Citation: Wimmer G, Gadermayr M, Wolkersdörfer G, Kwitt R, Tamaki T, Tischendorf J, Häfner M, Yoshida S, Tanaka S, Merhof D, Uhl A. Quest for the best endoscopic imaging modality for computer-assisted colonic polyp staging. World J Gastroenterol 2019; 25(10): 1197-1209
- URL: https://www.wjgnet.com/1007-9327/full/v25/i10/1197.htm
- DOI: https://dx.doi.org/10.3748/wjg.v25.i10.1197


