Copyright
©The Author(s) 2019.
World J Gastroenterol. Mar 14, 2019; 25(10): 1197-1209
Published online Mar 14, 2019. doi: 10.3748/wjg.v25.i10.1197
Published online Mar 14, 2019. doi: 10.3748/wjg.v25.i10.1197
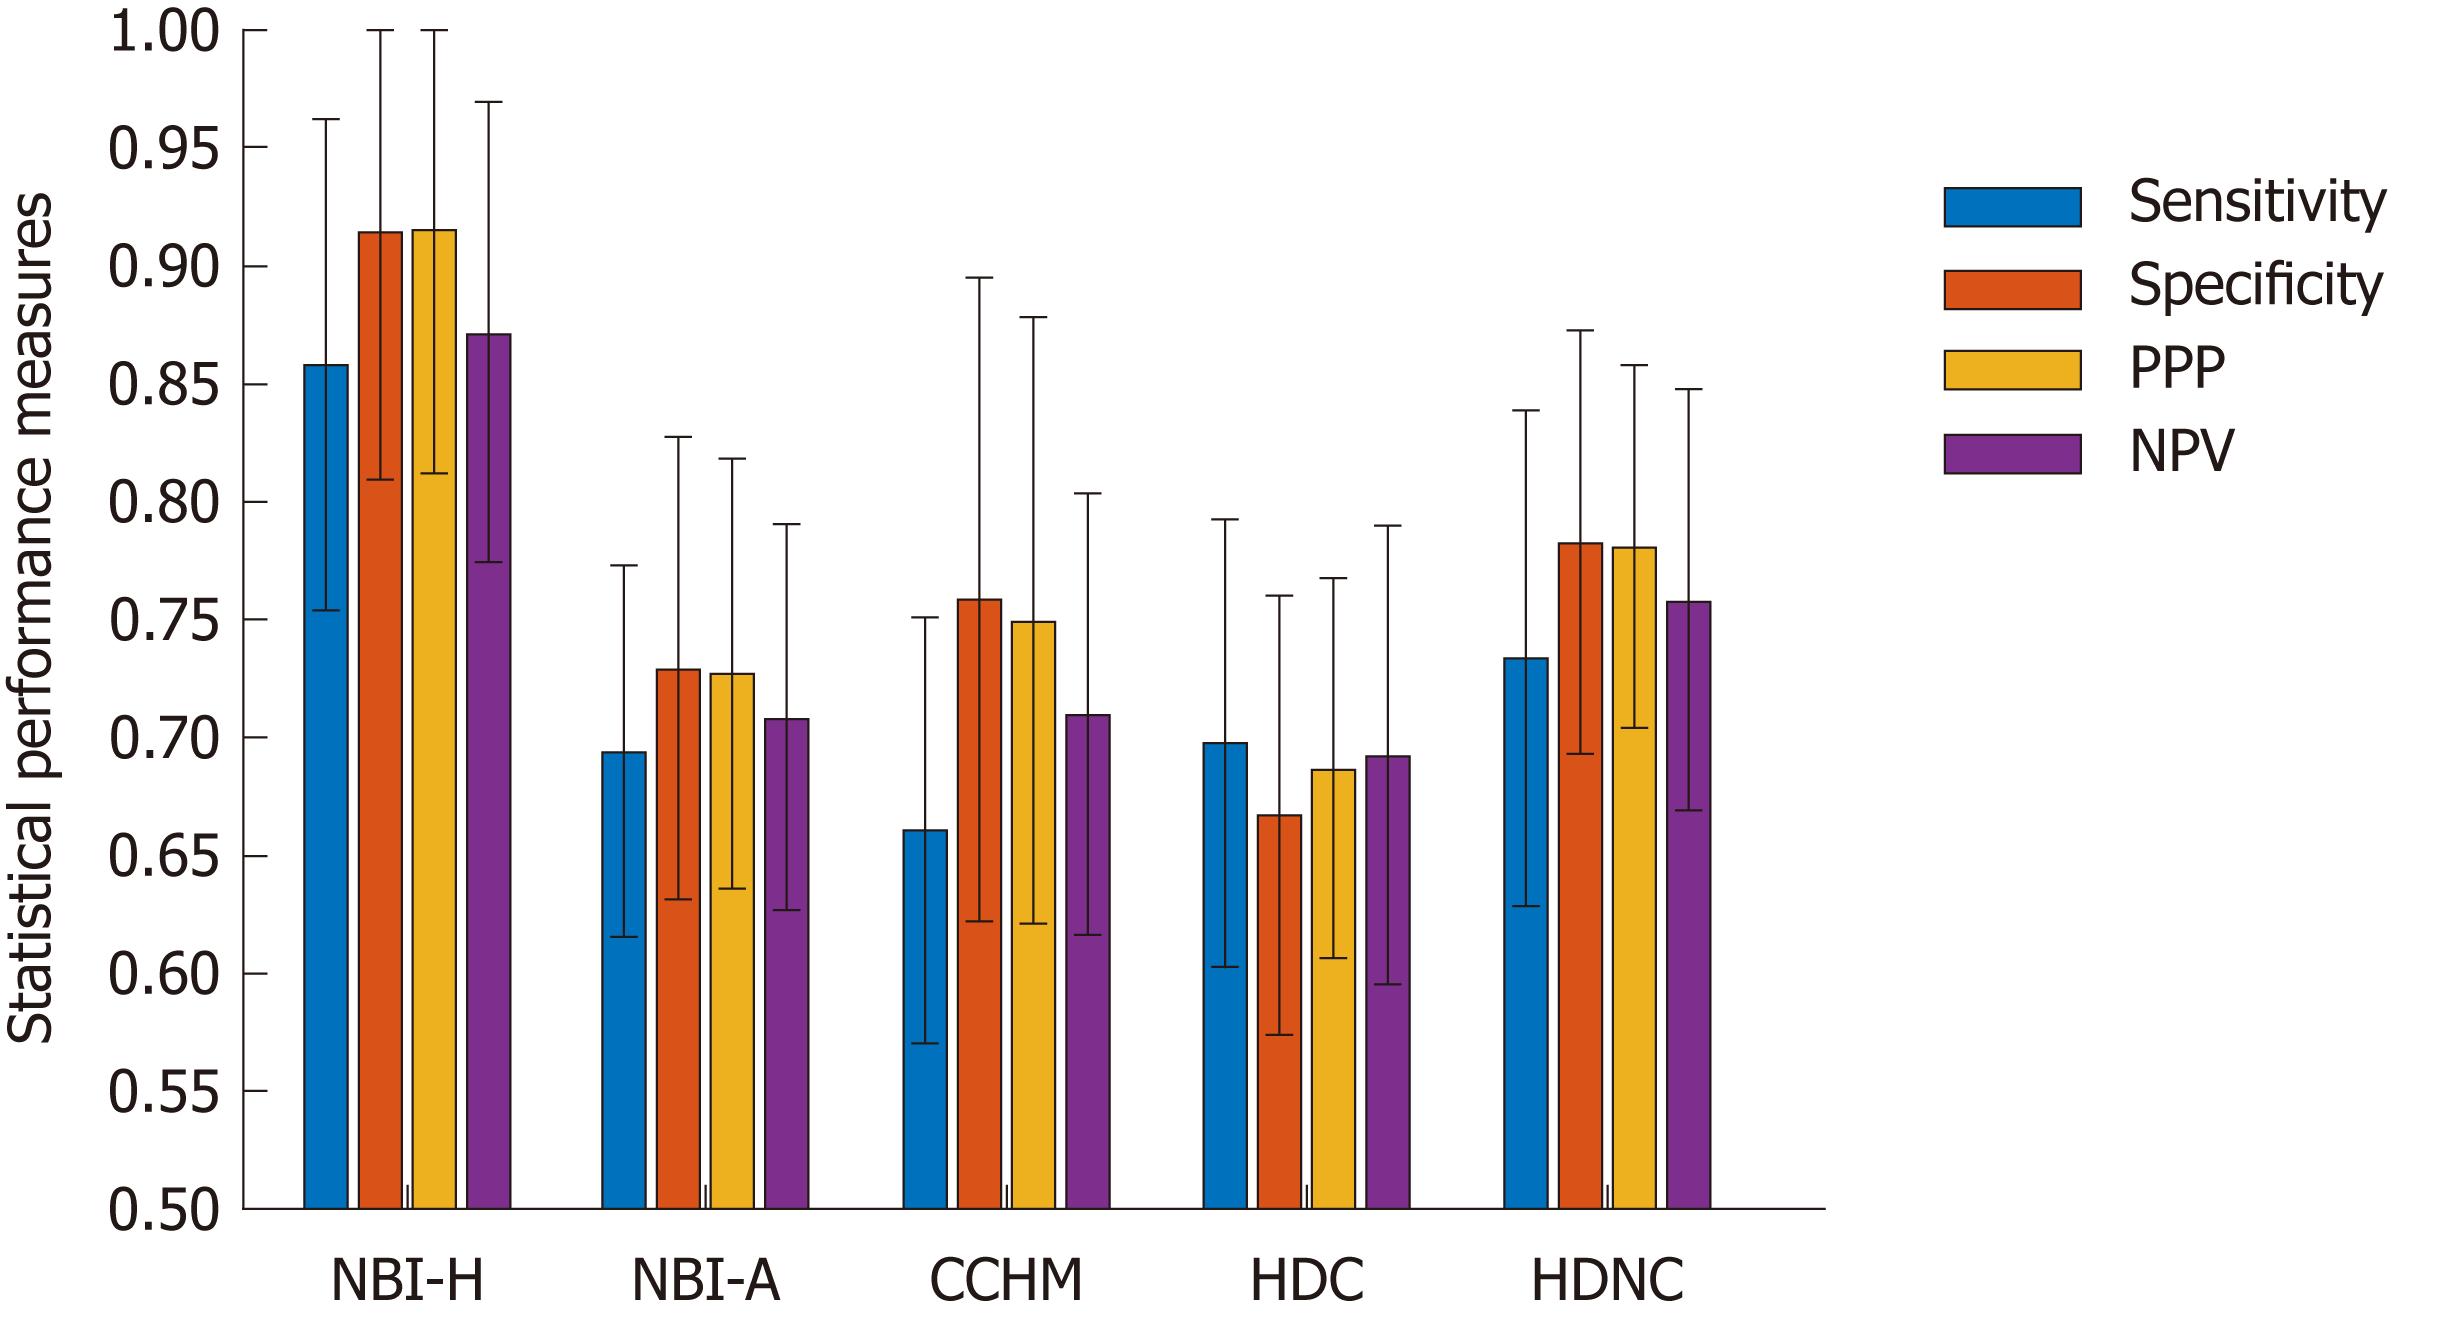
Figure 5 Bar plot showing the means and standard deviations of four statistical performance measures (sensitivity, specificity, positive predictive value and negative predictive value) over the different feature extraction techniques per data set.
NPV: Negative predictive value; PPV: Positive predictive value; NBI-H: High-magnification narrow-band imaging, Hiroshima; NBI-A: High-magnification narrow-band imaging, Aachen; CCHM: High-magnification chromoendoscopy; HDC: High-definition chromoendoscopy; HDNC: High-definition, no chromoendoscopy.
- Citation: Wimmer G, Gadermayr M, Wolkersdörfer G, Kwitt R, Tamaki T, Tischendorf J, Häfner M, Yoshida S, Tanaka S, Merhof D, Uhl A. Quest for the best endoscopic imaging modality for computer-assisted colonic polyp staging. World J Gastroenterol 2019; 25(10): 1197-1209
- URL: https://www.wjgnet.com/1007-9327/full/v25/i10/1197.htm
- DOI: https://dx.doi.org/10.3748/wjg.v25.i10.1197


