Copyright
©The Author(s) 2018.
World J Gastroenterol. Feb 28, 2018; 24(8): 882-893
Published online Feb 28, 2018. doi: 10.3748/wjg.v24.i8.882
Published online Feb 28, 2018. doi: 10.3748/wjg.v24.i8.882
Figure 1 Influence of oxadiazolo[4,3-a]-quinoxalin-1-one and 9-cyclopentyladenine mesylate on relaxin effects on the mechanical activity of the mouse ileum.
A: Typical tracings showing the spontaneous activity of the ileal segments (Ctr, left hand recordings of each panel). RLX (50 nmol/L), 30 min from its application to the bath medium, causes a decrease in amplitude of the spontaneous contractions and a decay of the basal tension (a, right trace) compared to its control (a, left trace). Both these effects are reduced when RLX is added to the bath medium in the presence of 1 µmol/L ODQ (b, right trace) or 100 µmol/L 9CPA (c, right trace) and abolished in the presence of ODQ plus 9CPA (d, right trace). Data of each panel (a-d) are obtained from different preparations; B: Bar charts showing the influence of ODQ and 9CPA on RLX effects on the mean amplitude of spontaneous contractions (left hand histogram) and basal tension (right hand histogram) with respect to the control. All values are means ± SE of 6 preparations from 3 mice. aP < 0.05 vs Ctr; cP < 0.05 vs RLX (one-way ANOVA and Newman-Keuls post-test); RLX: Relaxin; ODQ: Oxadiazolo[4,3-a]-quinoxalin-1-one; 9CPA: 9-cyclopentyladenine.
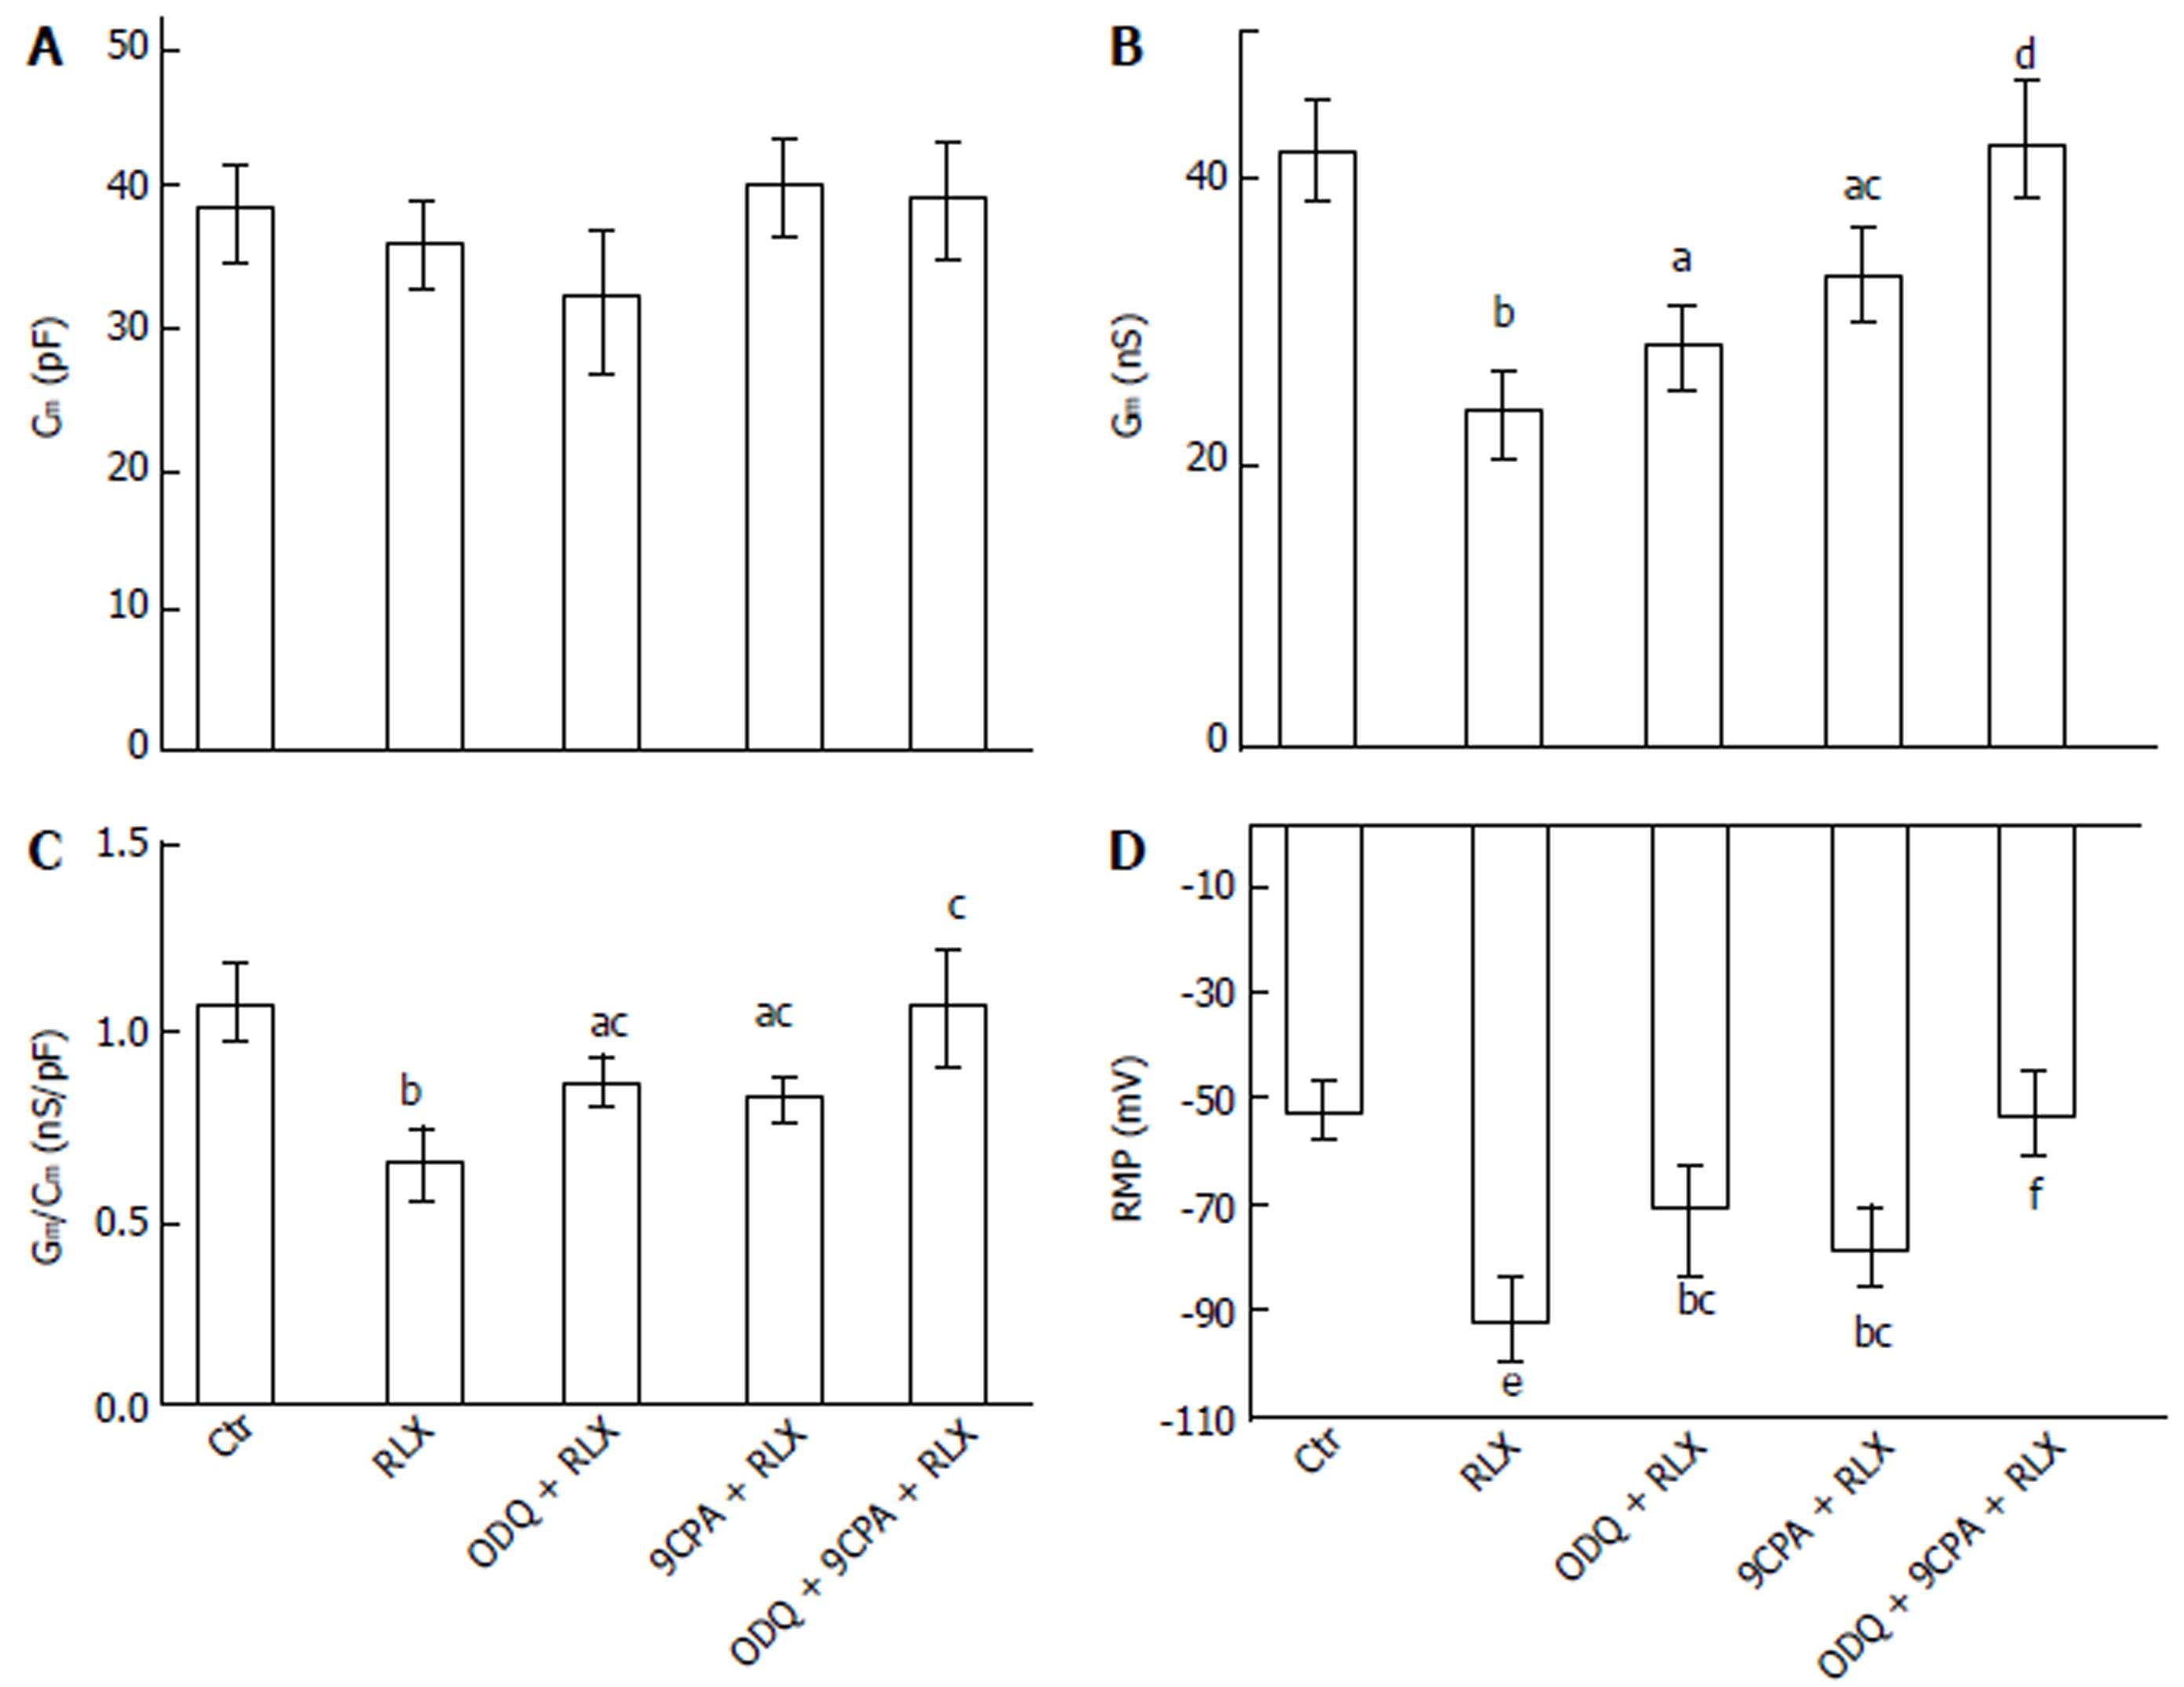
Figure 2 Effect of relaxin on smooth muscle cell membrane passive properties and resting membrane potential (RMP) of the mouse ileum.
Influence of relaxin on Cm (A), Gm (B), Gm/Cm (C) and RMP (D) alone (RLX) or in the presence of ODQ (ODQ + RLX), 9CPA (9CPA + RLX) or both of them (ODQ + 9CPA + RLX). aP < 0.05, bP < 0.01, eP < 0.001 vs control SMC (Ctr); cP < 0.05, dP < 0.01, fP < 0.001 vs RLX. In each experimental condition, data are mean ± SE from n = 22 cells (11 strips from 5 mice) (one-way ANOVA and Newman-Keuls post-test), RLX: Relaxin; ODQ: Oxadiazolo[4,3-a]-quinoxalin-1-one; 9CPA: 9-cyclopentyladenine.
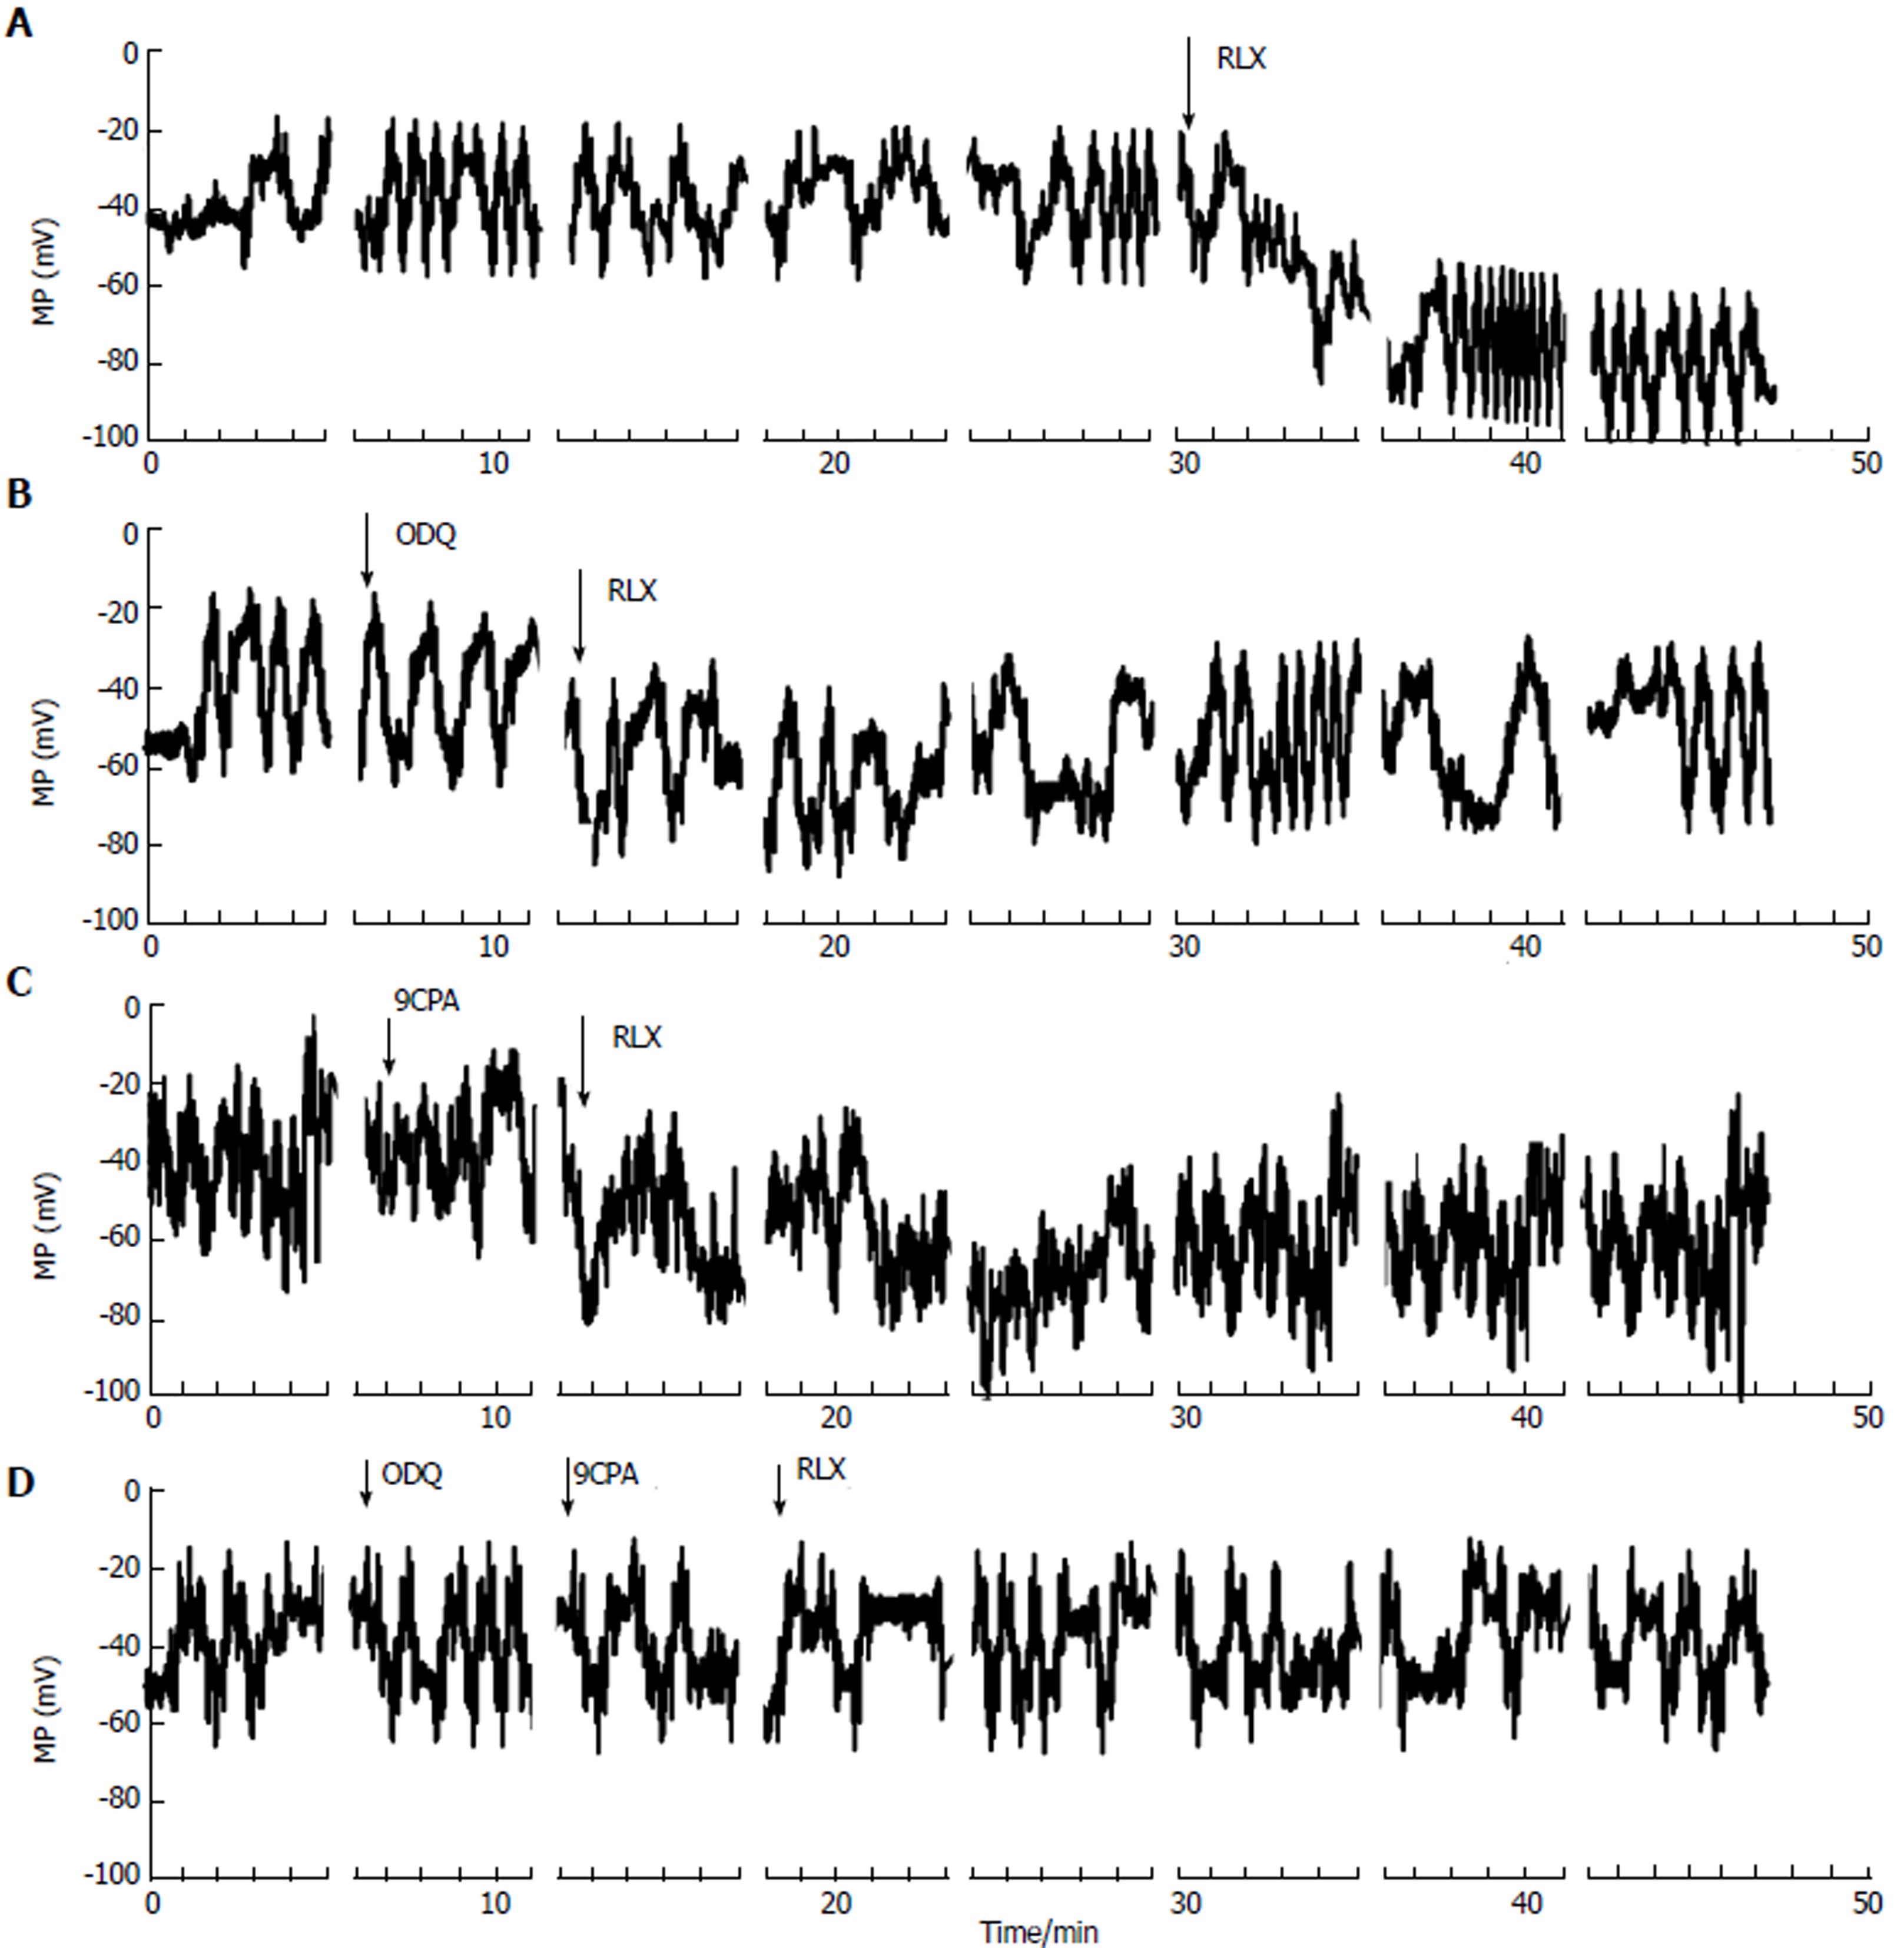
Figure 3 Effects of relaxin, in the absence or in the presence of oxadiazolo[4,3-a]-quinoxalin-1-one and 9-cyclopentyladenine, on membrane potential recorded from smooth muscle cell of the mouse ileum.
Typical tracings of membrane potential from four different single ileal SMCs. A-D: Irregular waves of MP recorded in control condition. RLX addition (arrow) induced a persistent hyperpolarization occurring right after about 2 min from its application (A); The hyperpolarization caused by RLX was reduced in the presence of ODQ (B), 9CPA (C) and was abolished when both blockers were concomitantly present in the bath solution (D). Breaks in X-axis (and consequently in the MP traces) indicate the end of each episode, RLX: Relaxin; ODQ: Oxadiazolo[4,3-a]-quinoxalin-1-one; 9CPA: 9-cyclopentyladenine.
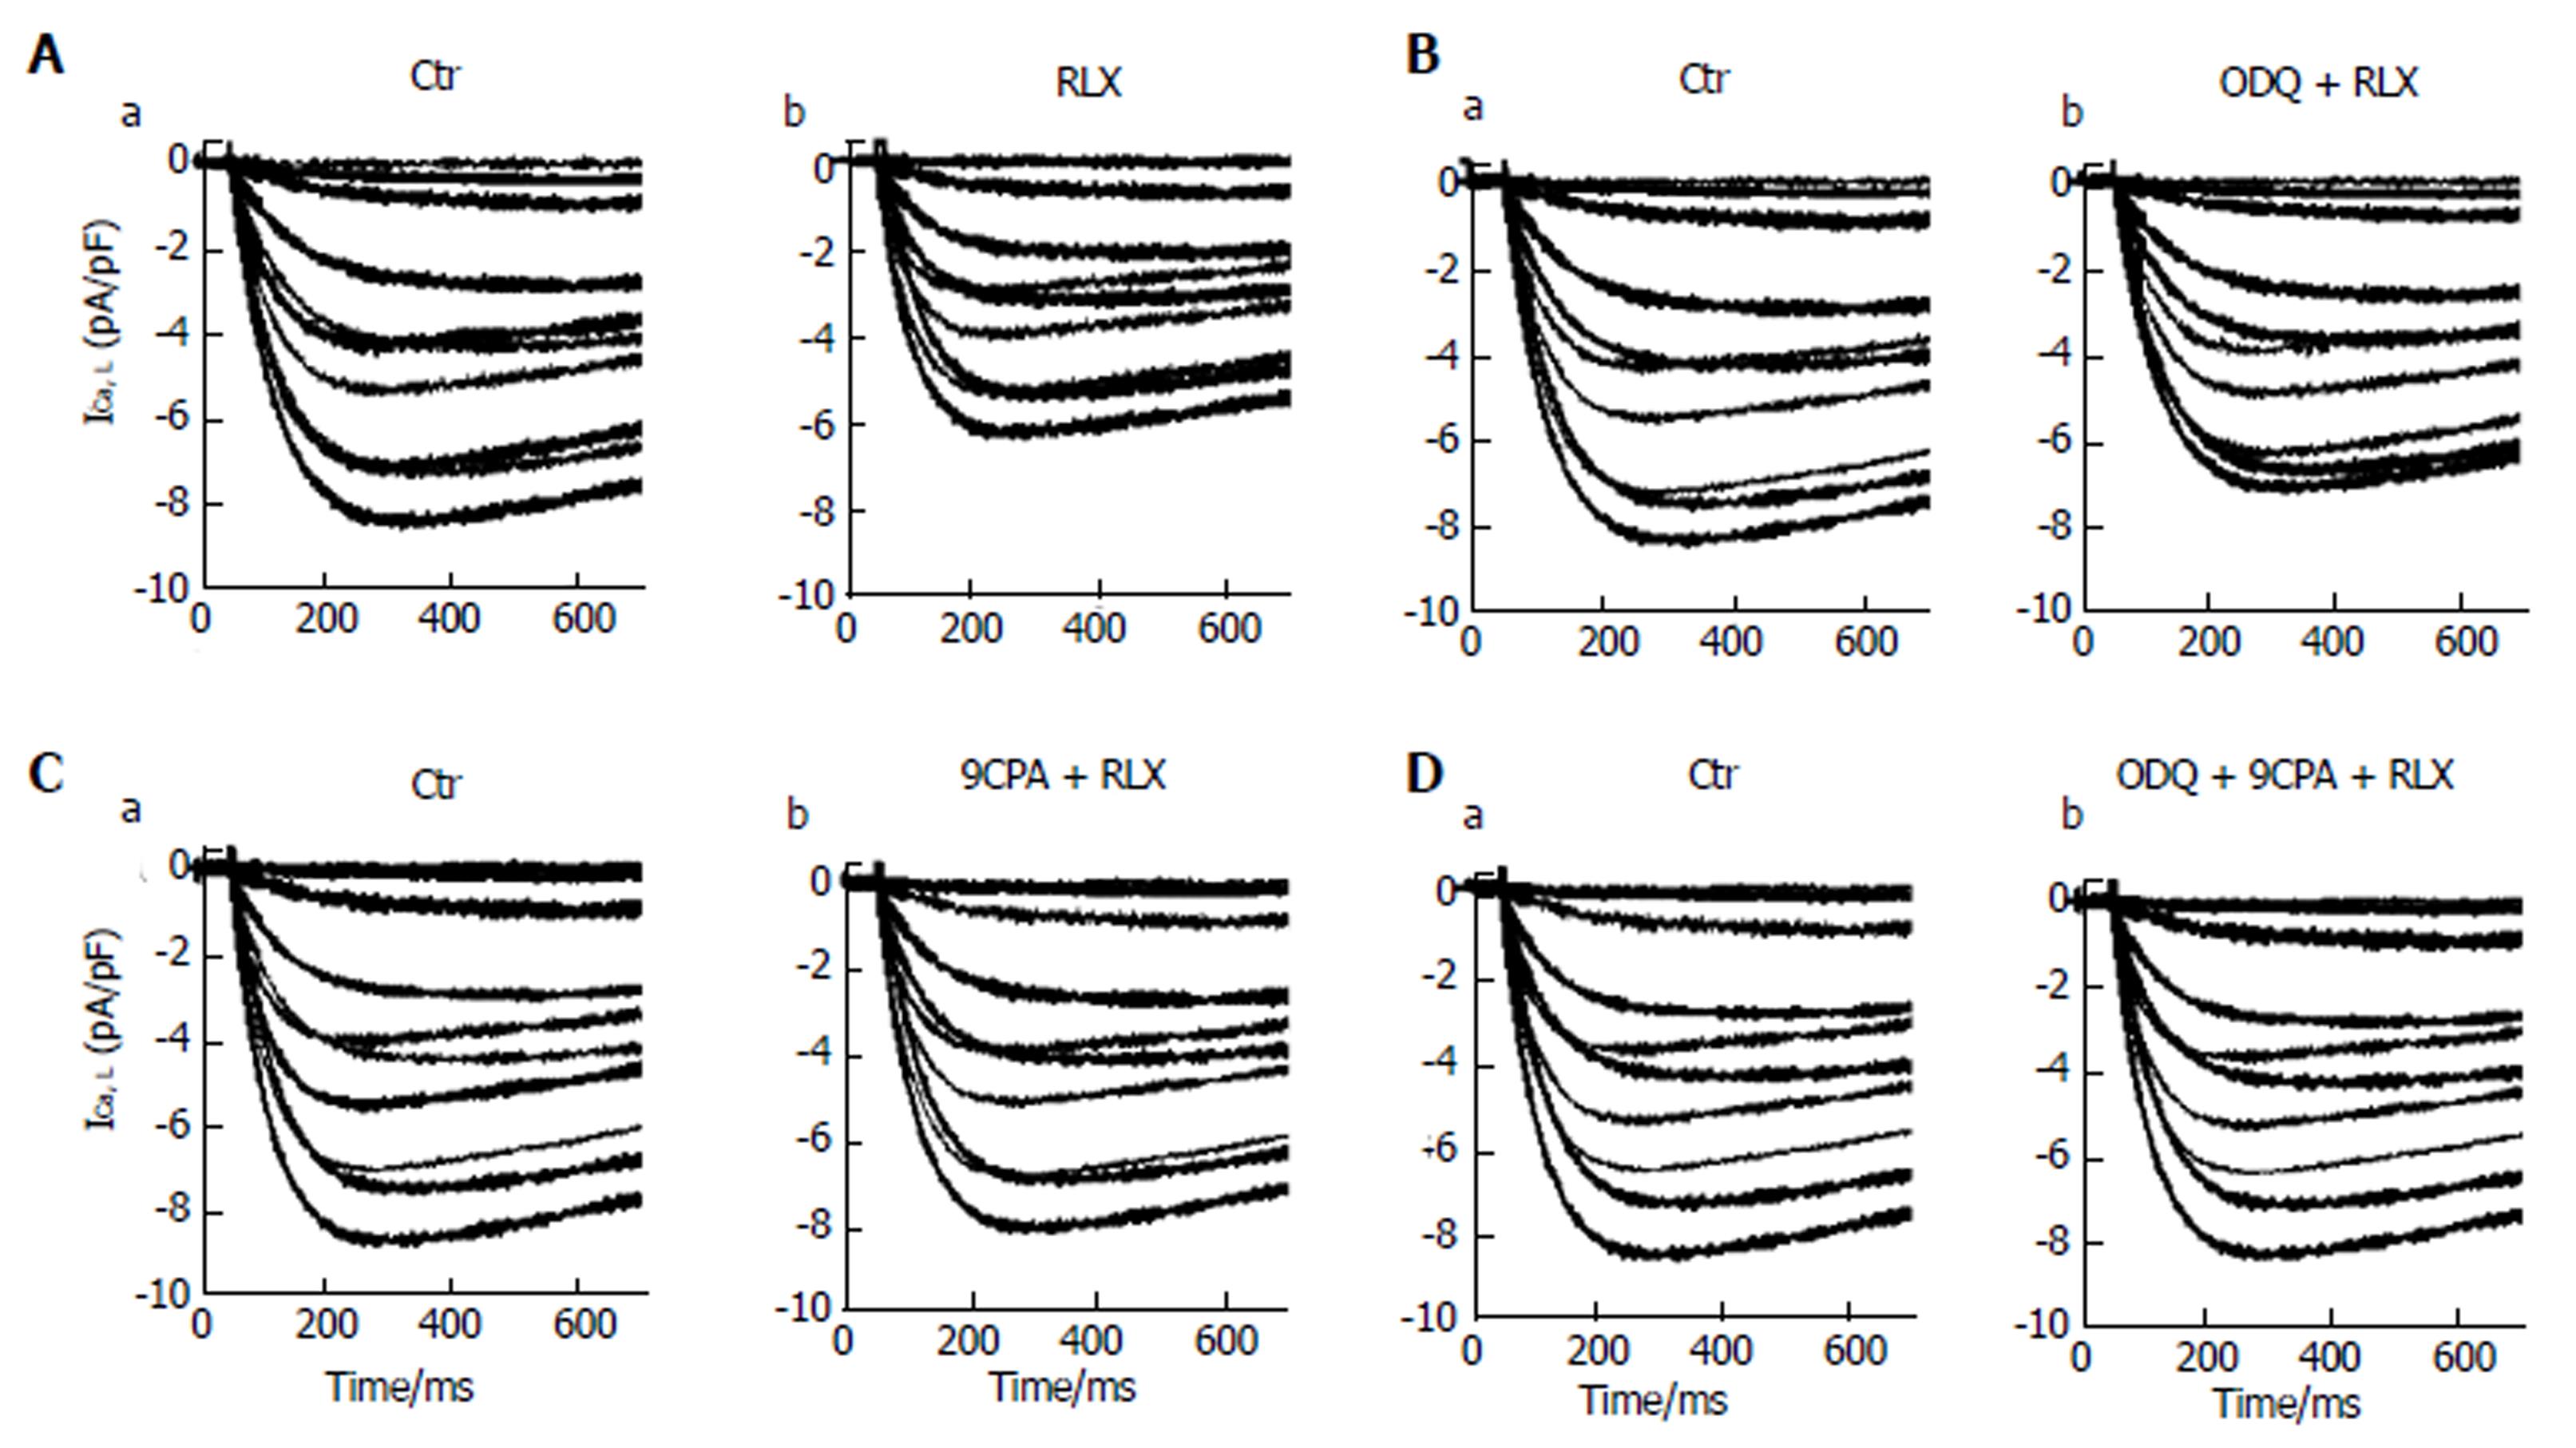
Figure 4 Relaxin affects L-type Ca2+ currents in smooth muscle cell of the mouse ileum.
A: Representative time course of L-type Ca2+ currents (ICa,L) recorded in the high TEA-Ca2+ solution from a control cell (a) and after RLX addition (b); B-D: ICa,L tracings in the control (a) and in the presence of RLX (b) added 15 min after ODQ (B) or 9CPA(C) or both ODQ + 9CPA (D). Current records shown in the different panels (A-D) are obtained from four different SMCs. The first 700 ms of the current response are displayed.
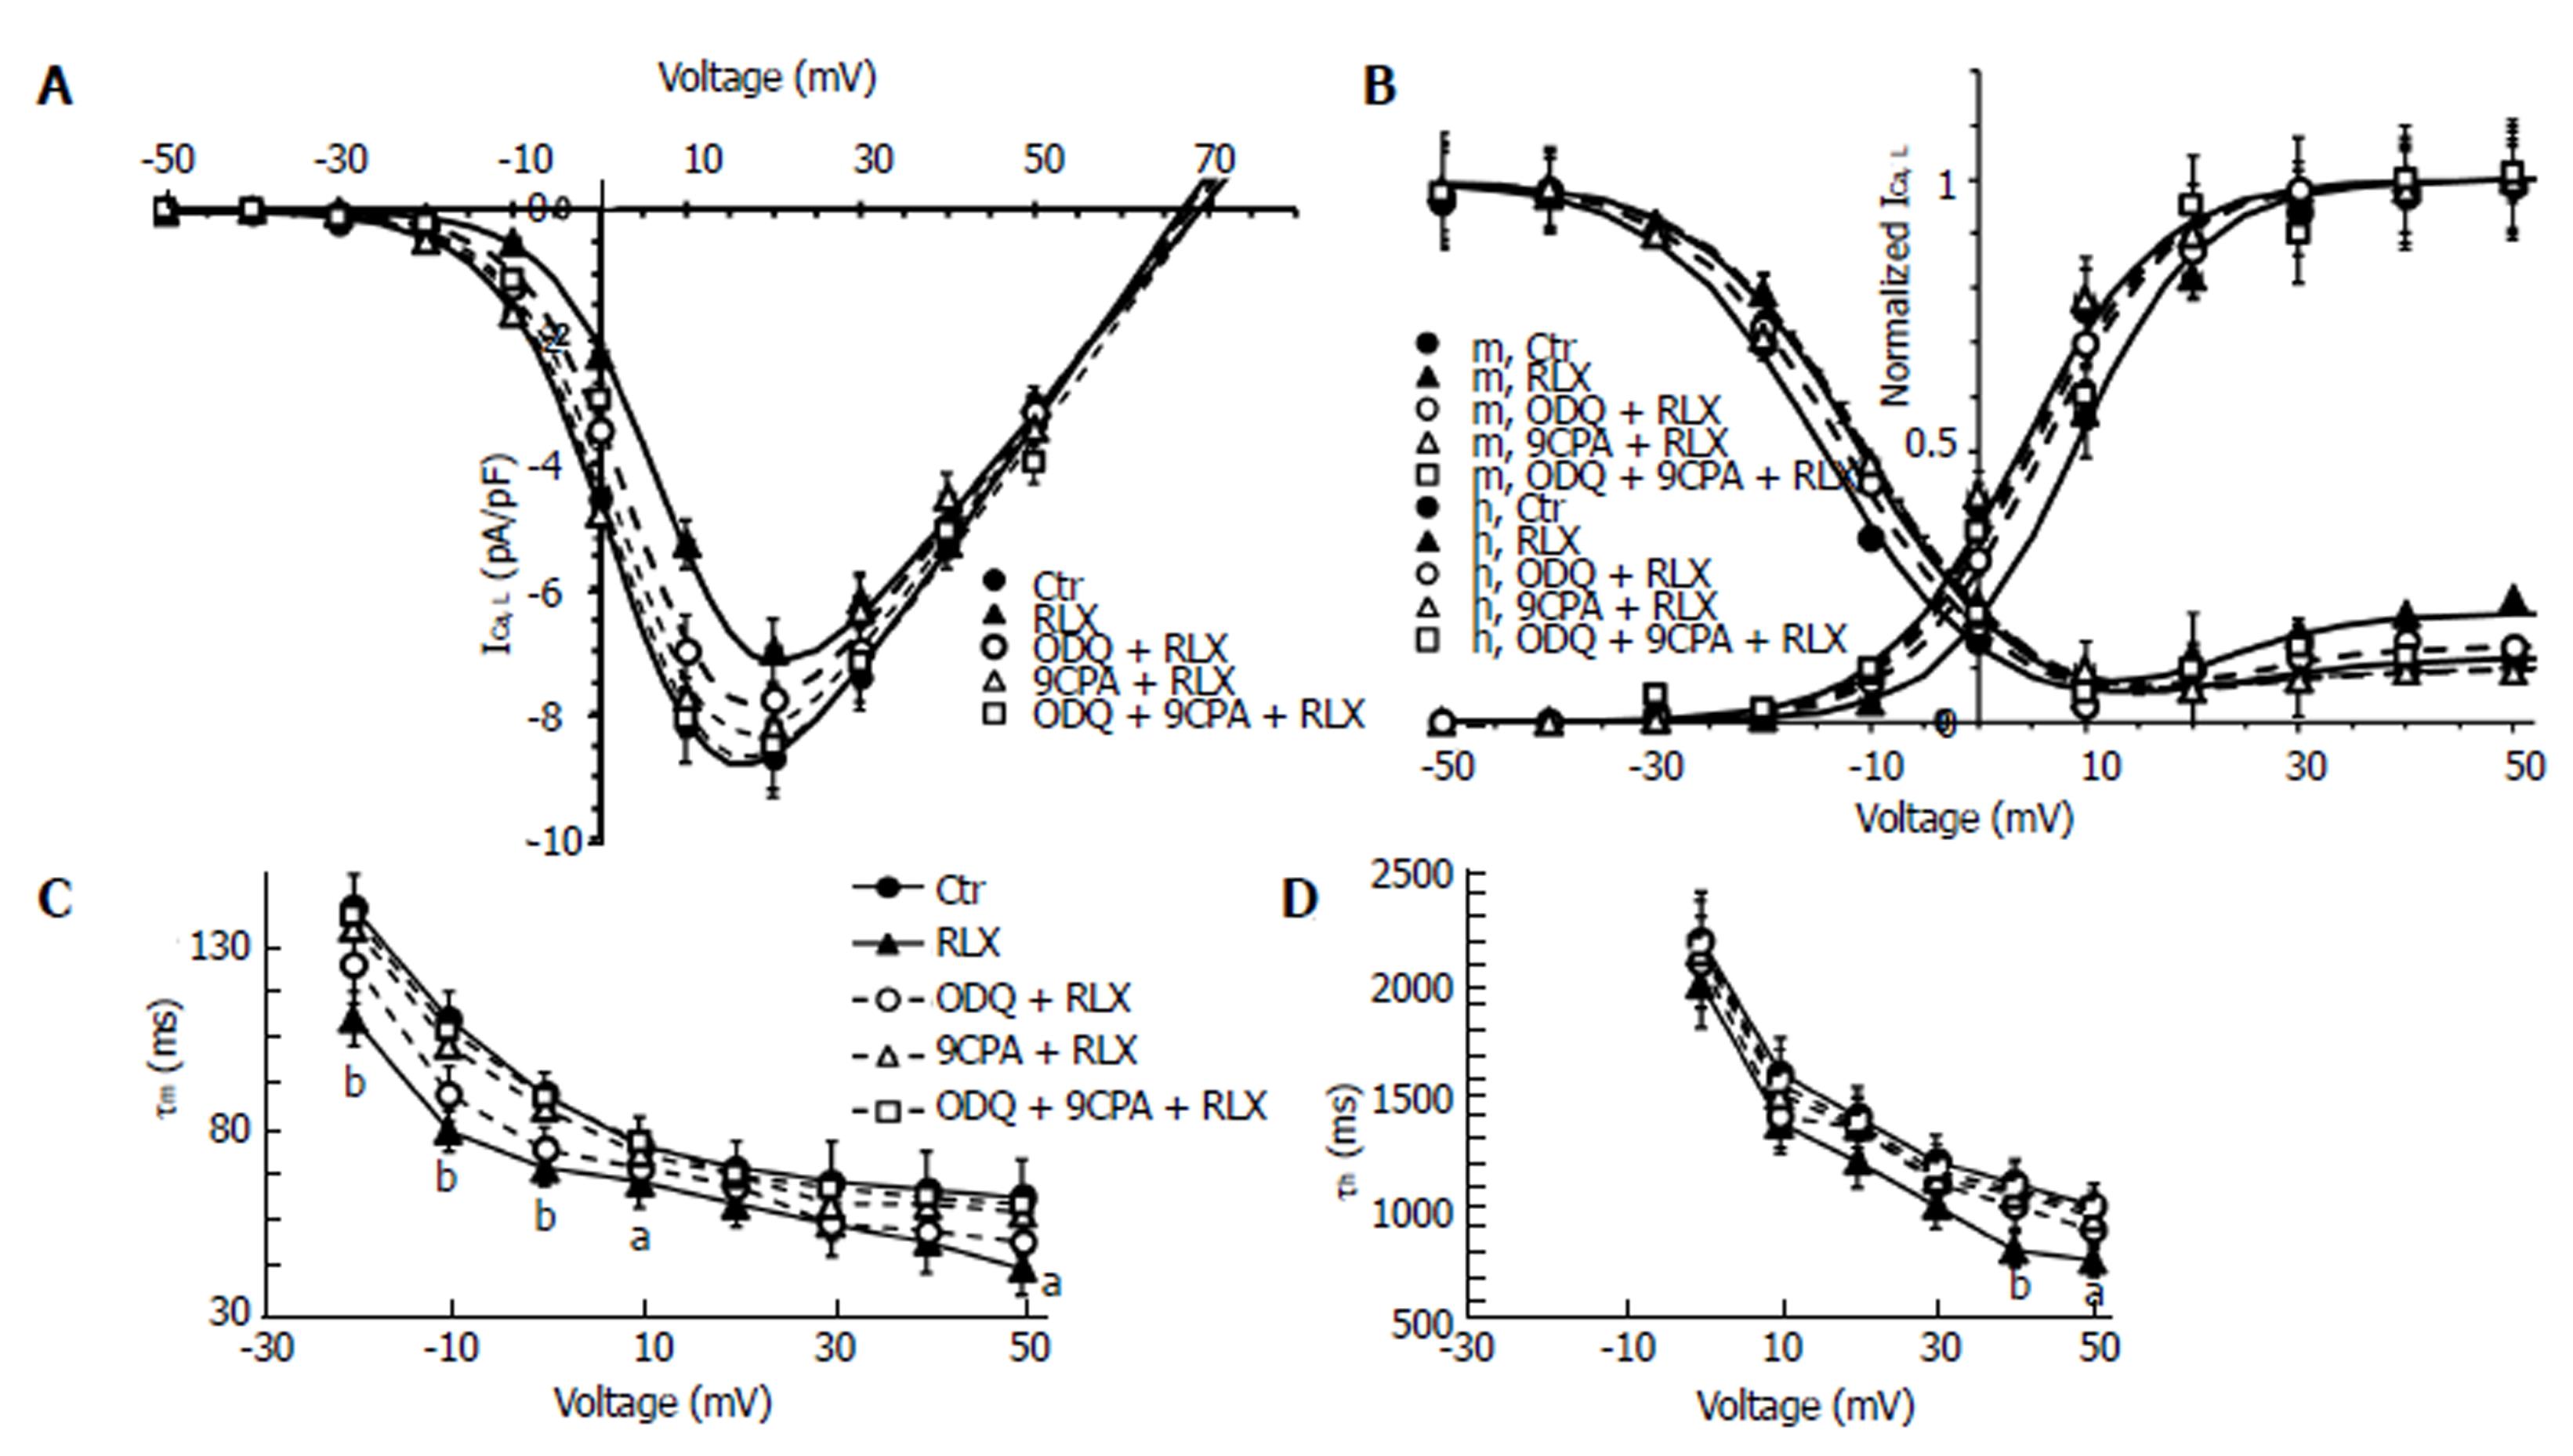
Figure 5 Relaxin affects ICa,L voltage dependence and kinetics in smooth muscle cell of the mouse ileum.
A: I-V plots of L-type Ca2+ currents (ICa,L) recorded in Ctr (filled circles), RLX (filled up triangles), ODQ + RLX (open circles), 9CPA + RLX (open up triangles) and ODQ+9CPA + RLX (open squares) from experiments as in Figure 4. Statistical significance not shown in the plot for clarity; B: Steady-state ICa,L activation (m) and inactivation curves (h) in all the conditions tested; the best fit to the inactivation data is obtained by the sum of two Boltzmann terms. A and B: The Boltzmann fits for Ctr and RLX are superimposed to the experimental data as continuous lines, those related to ODQ, 9CPA and ODQ + 9CPA as dashed lines. Data are mean ± SE. Boltzmann parameters, statistical analysis and number of analyzed cells are listed in Table 1. Current values are normalized to cell capacitance (pA/pF). C and D: Voltage dependence of the time constant of ICa,L activation (τm) and inactivation (τ h). aP < 0.05 and bP < 0.01 RLX vs control SMC (Ctr). P < 0.05 for 9CPA + RLX and for 9CPA + ODQ + RLX vs RLX alone for the -20, -10 and 0 mV (τm data); P < 0.05 for 9CPA + RLX, ODQ + RLX and 9CPA + ODQ + RLX vs RLX alone for +40 and +50 mV (τ h data). Statistical significance for the inhibitors not shown in the panels for clarity (one-way ANOVA and Newman-Keuls post-test), RLX: Relaxin; ODQ: Oxadiazolo[4,3-a]-quinoxalin-1-one; 9CPA: 9-cyclopentyladenine.
- Citation: Idrizaj E, Garella R, Francini F, Squecco R, Baccari MC. Relaxin influences ileal muscular activity through a dual signaling pathway in mice. World J Gastroenterol 2018; 24(8): 882-893
- URL: https://www.wjgnet.com/1007-9327/full/v24/i8/882.htm
- DOI: https://dx.doi.org/10.3748/wjg.v24.i8.882


