Copyright
©The Author(s) 2018.
World J Gastroenterol. Dec 28, 2018; 24(48): 5491-5504
Published online Dec 28, 2018. doi: 10.3748/wjg.v24.i48.5491
Published online Dec 28, 2018. doi: 10.3748/wjg.v24.i48.5491
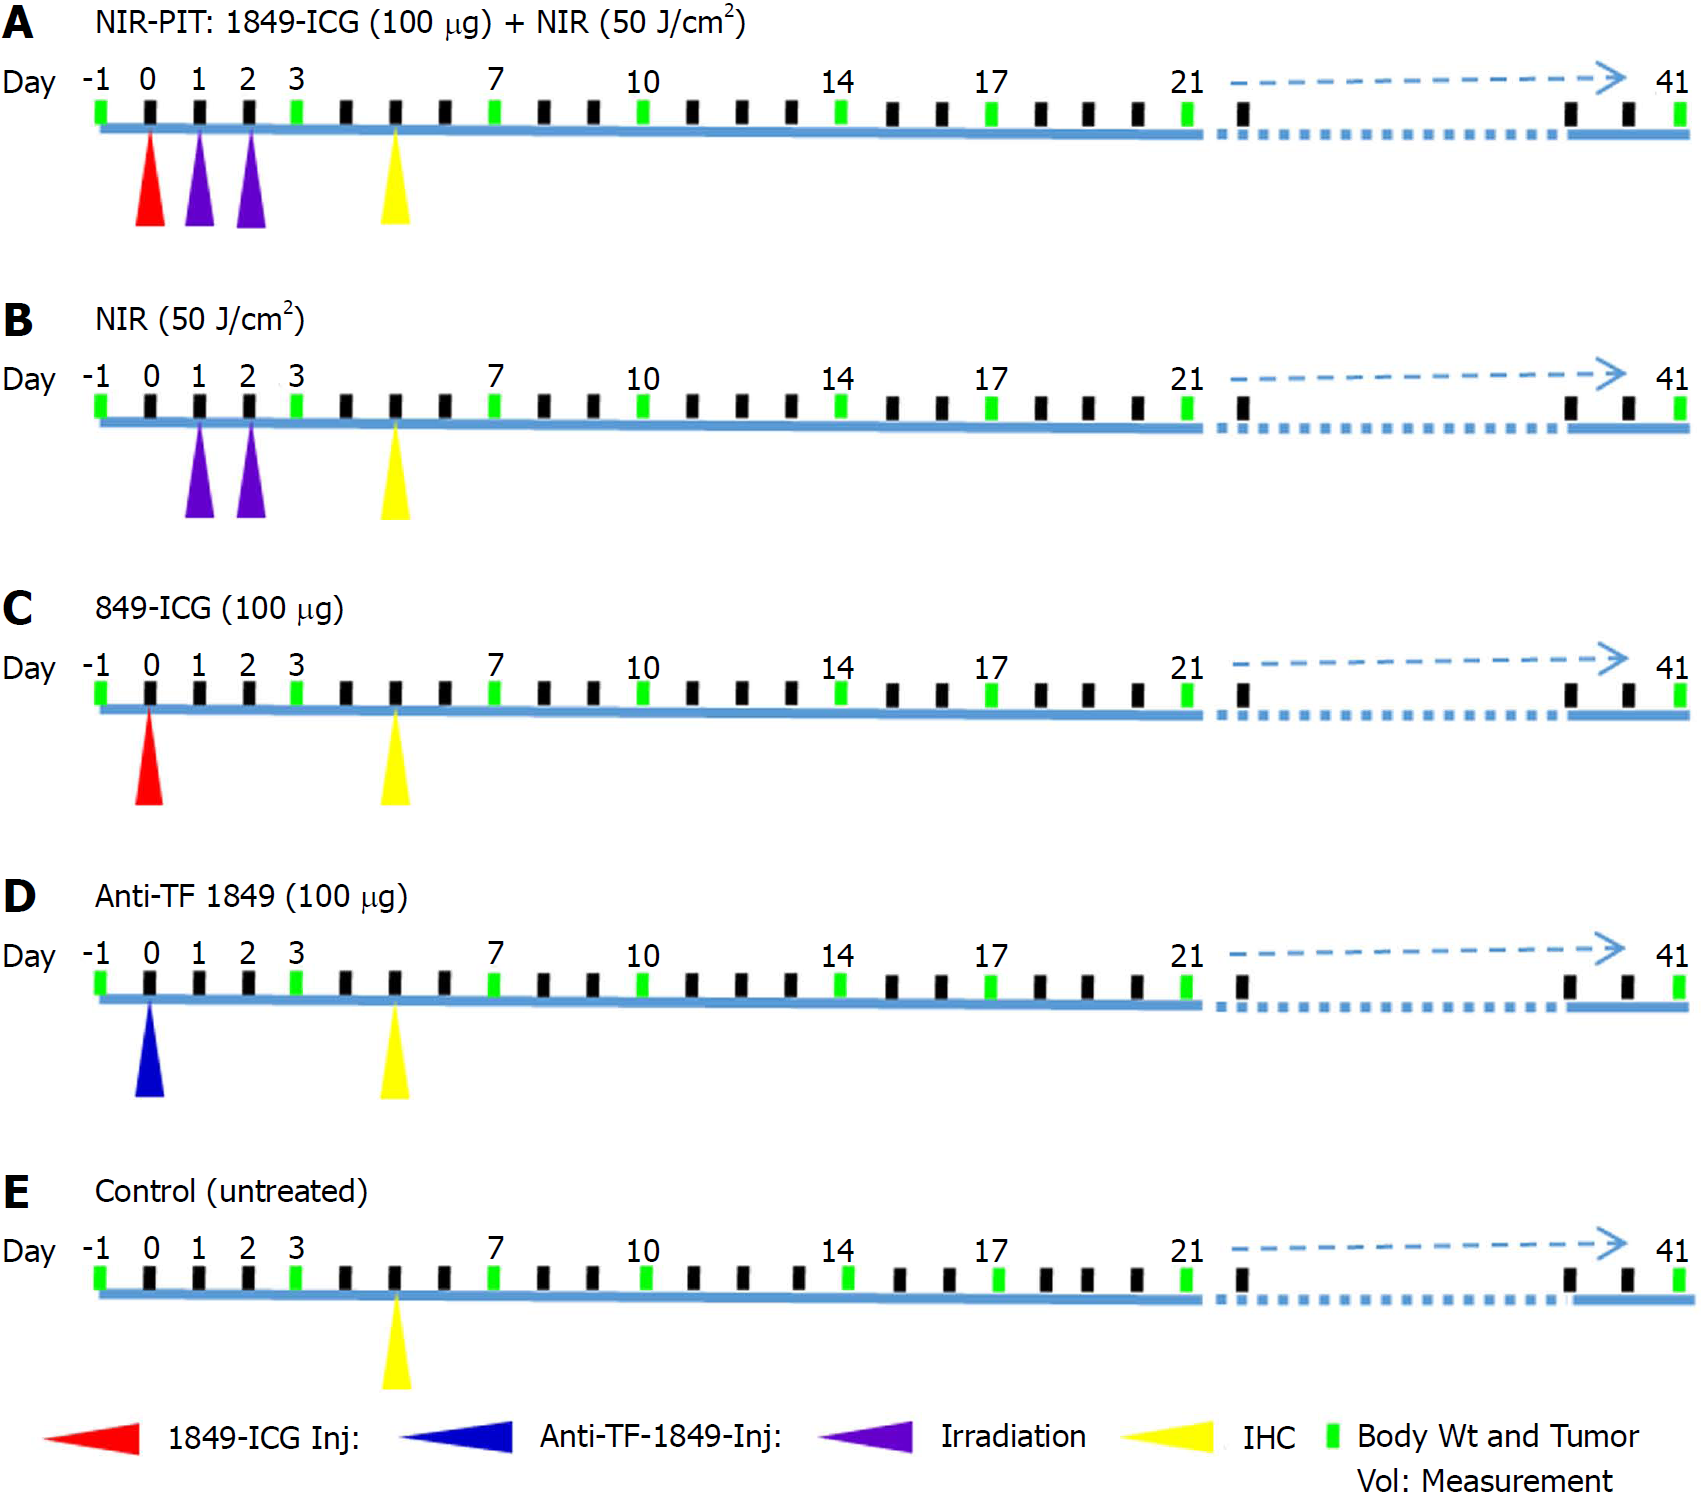
Figure 1 Experimental treatment scheme.
A: Near-infrared photoimmunotherapy (NIR-PIT); B: NIR light alone; C: Indocyanine green-labeled antibody 1849 conjugate alone; D: Anti-tissue factor antibody 1849 alone; E: Control (untreated). Anti-TF 1849: Anti-tissue factor antibody 1849; 1849-ICG: Indocyanine green-labeled anti-tissue factor antibody 1849; NIR: Near-infrared; NIR-PIT: Near-infrared photoimmunotherapy.
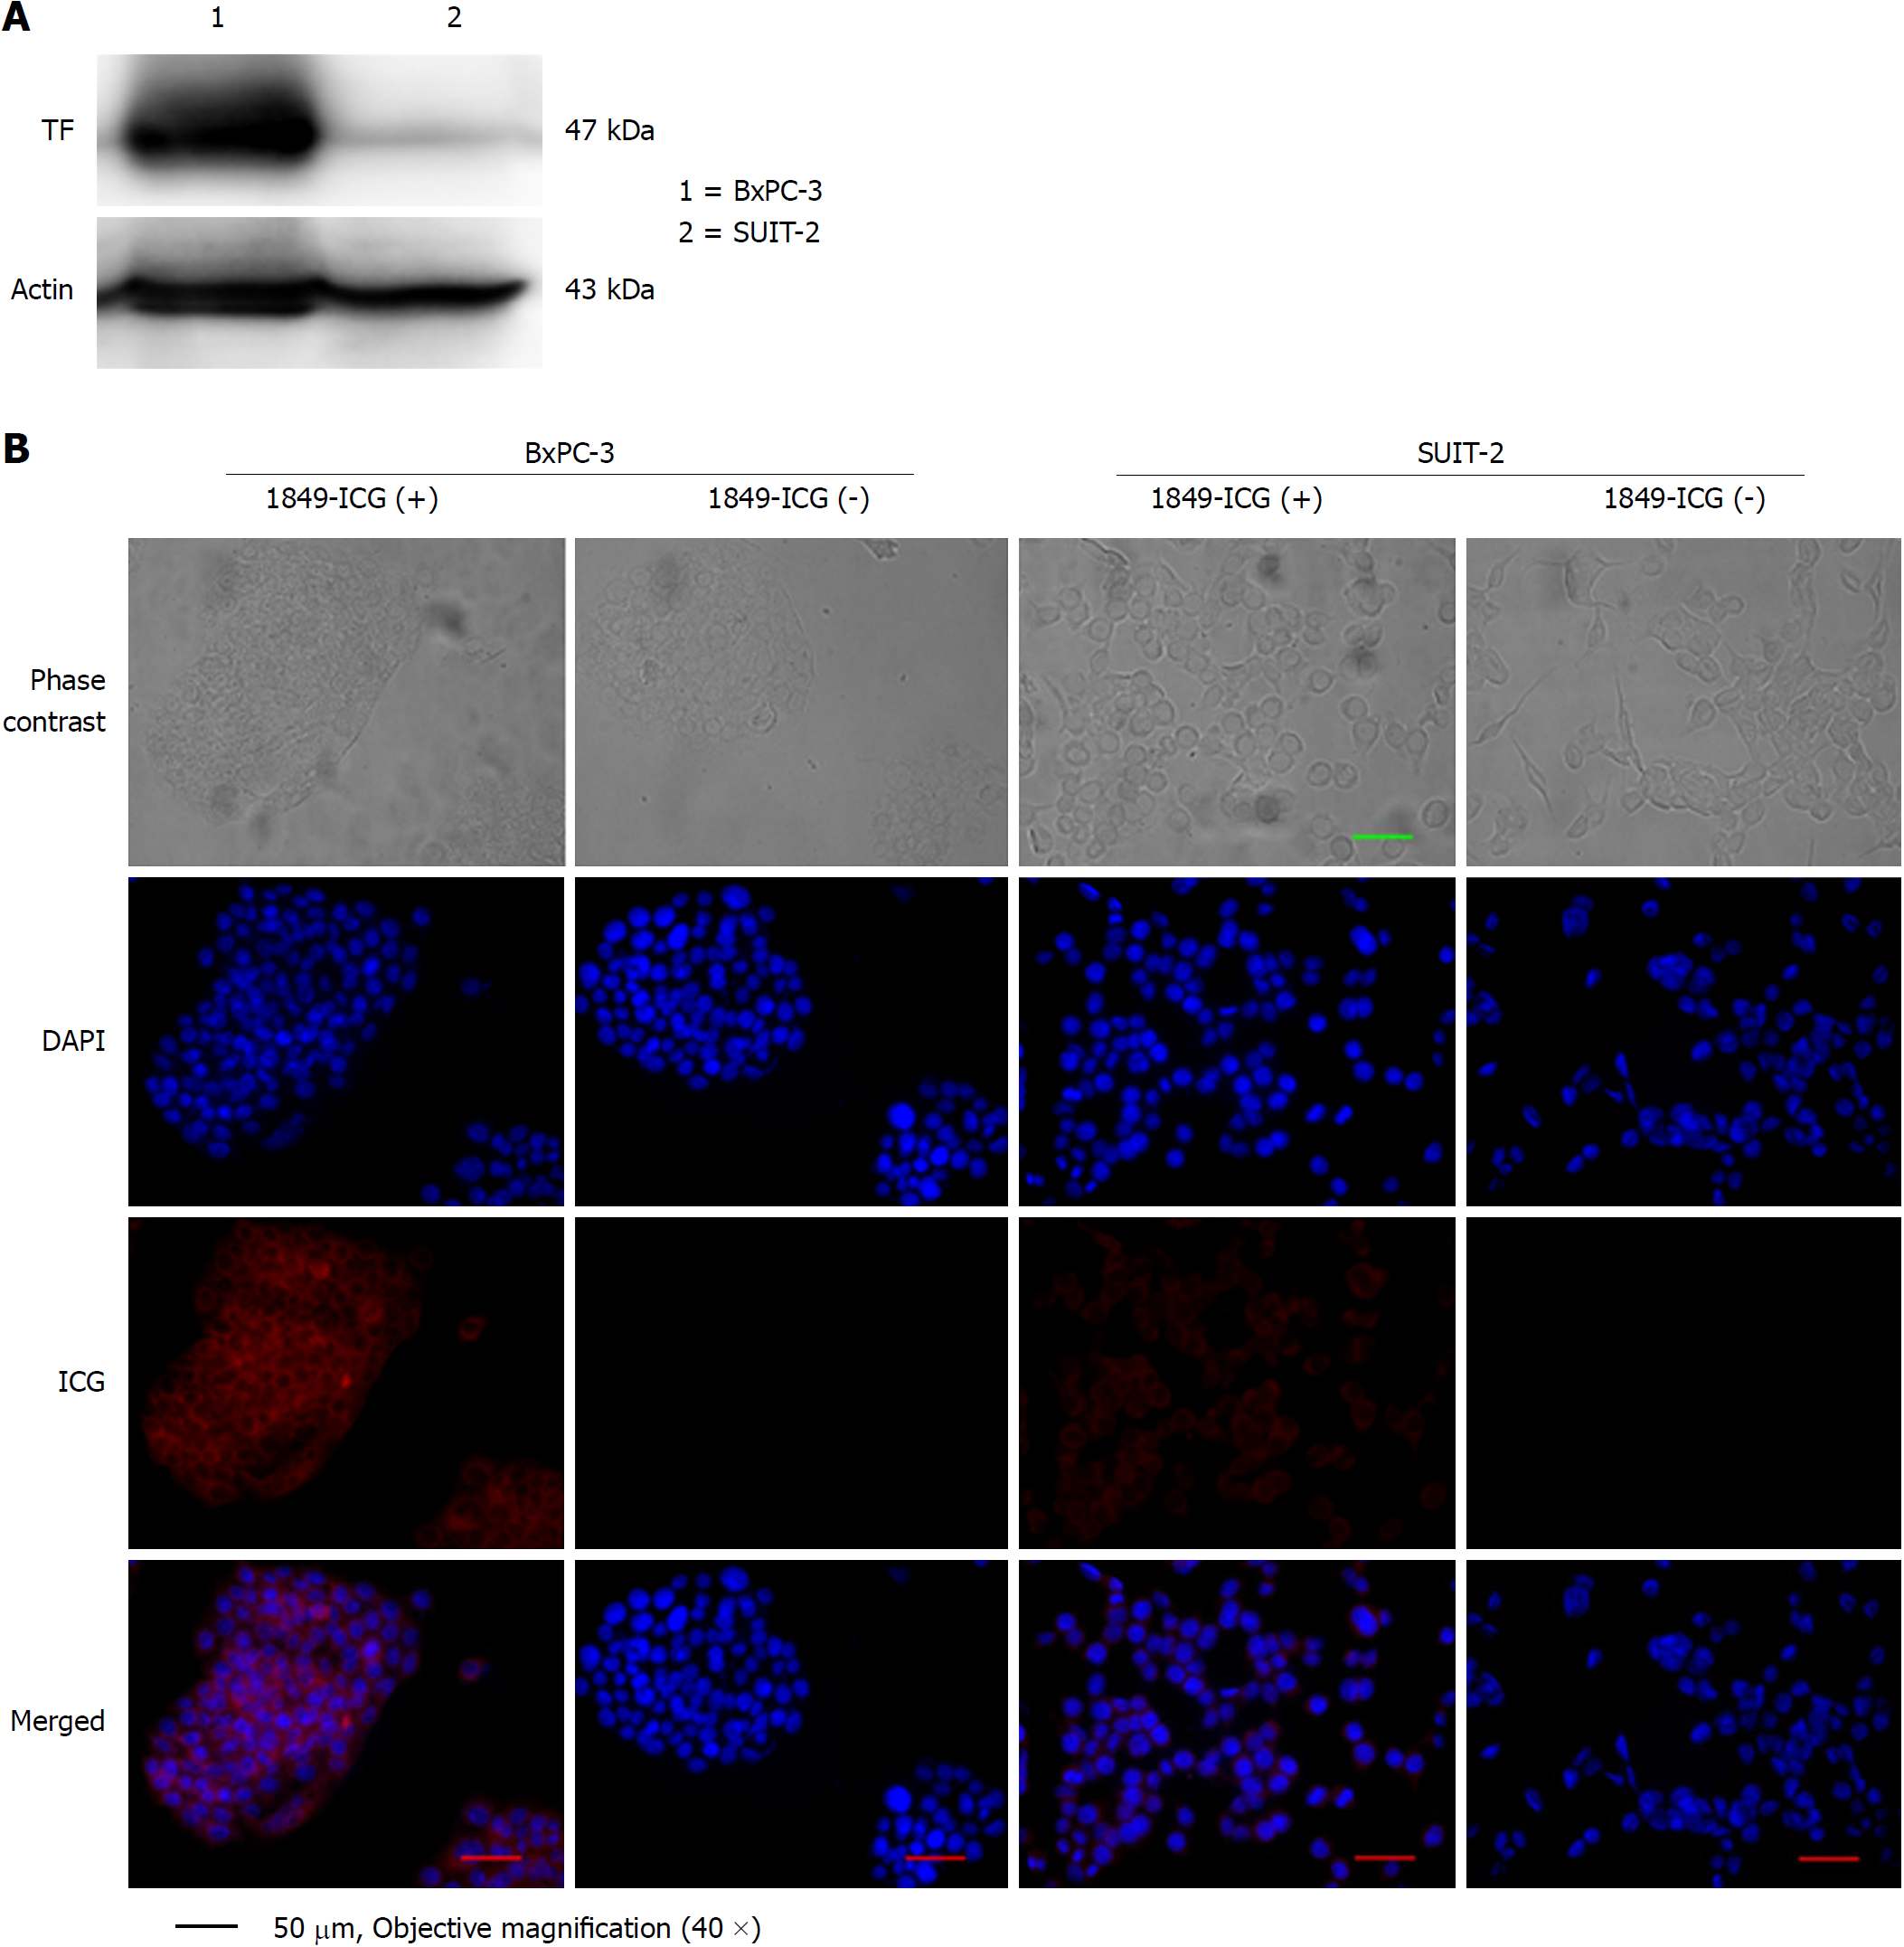
Figure 2 Tissue factor expression in human pancreatic cancer cell lines.
A: Tissue factor (TF) expression in the cell lines BxPC-3 (lane 1) and SUIT-2 (lane 2) was examined by western blotting; B: Both cell lines were incubated with or without indocyanine green-labeled anti-TF antibody 1849 (1849-ICG) for 18 h and examined under a fluorescent microscope. Intracellular localization of intense fluorescent signals indicated substantial binding and internalization of 1849-ICG within BxPC-3, but very rarely in SUIT-2 cells (Scale bar = 50 μm, 40 × objective magnification). DAPI: 4,6-diamidino-2-phenylindole; 1849-ICG: Indocyanine green-labeled anti-tissue factor antibody 1849; TF: Tissue factor.
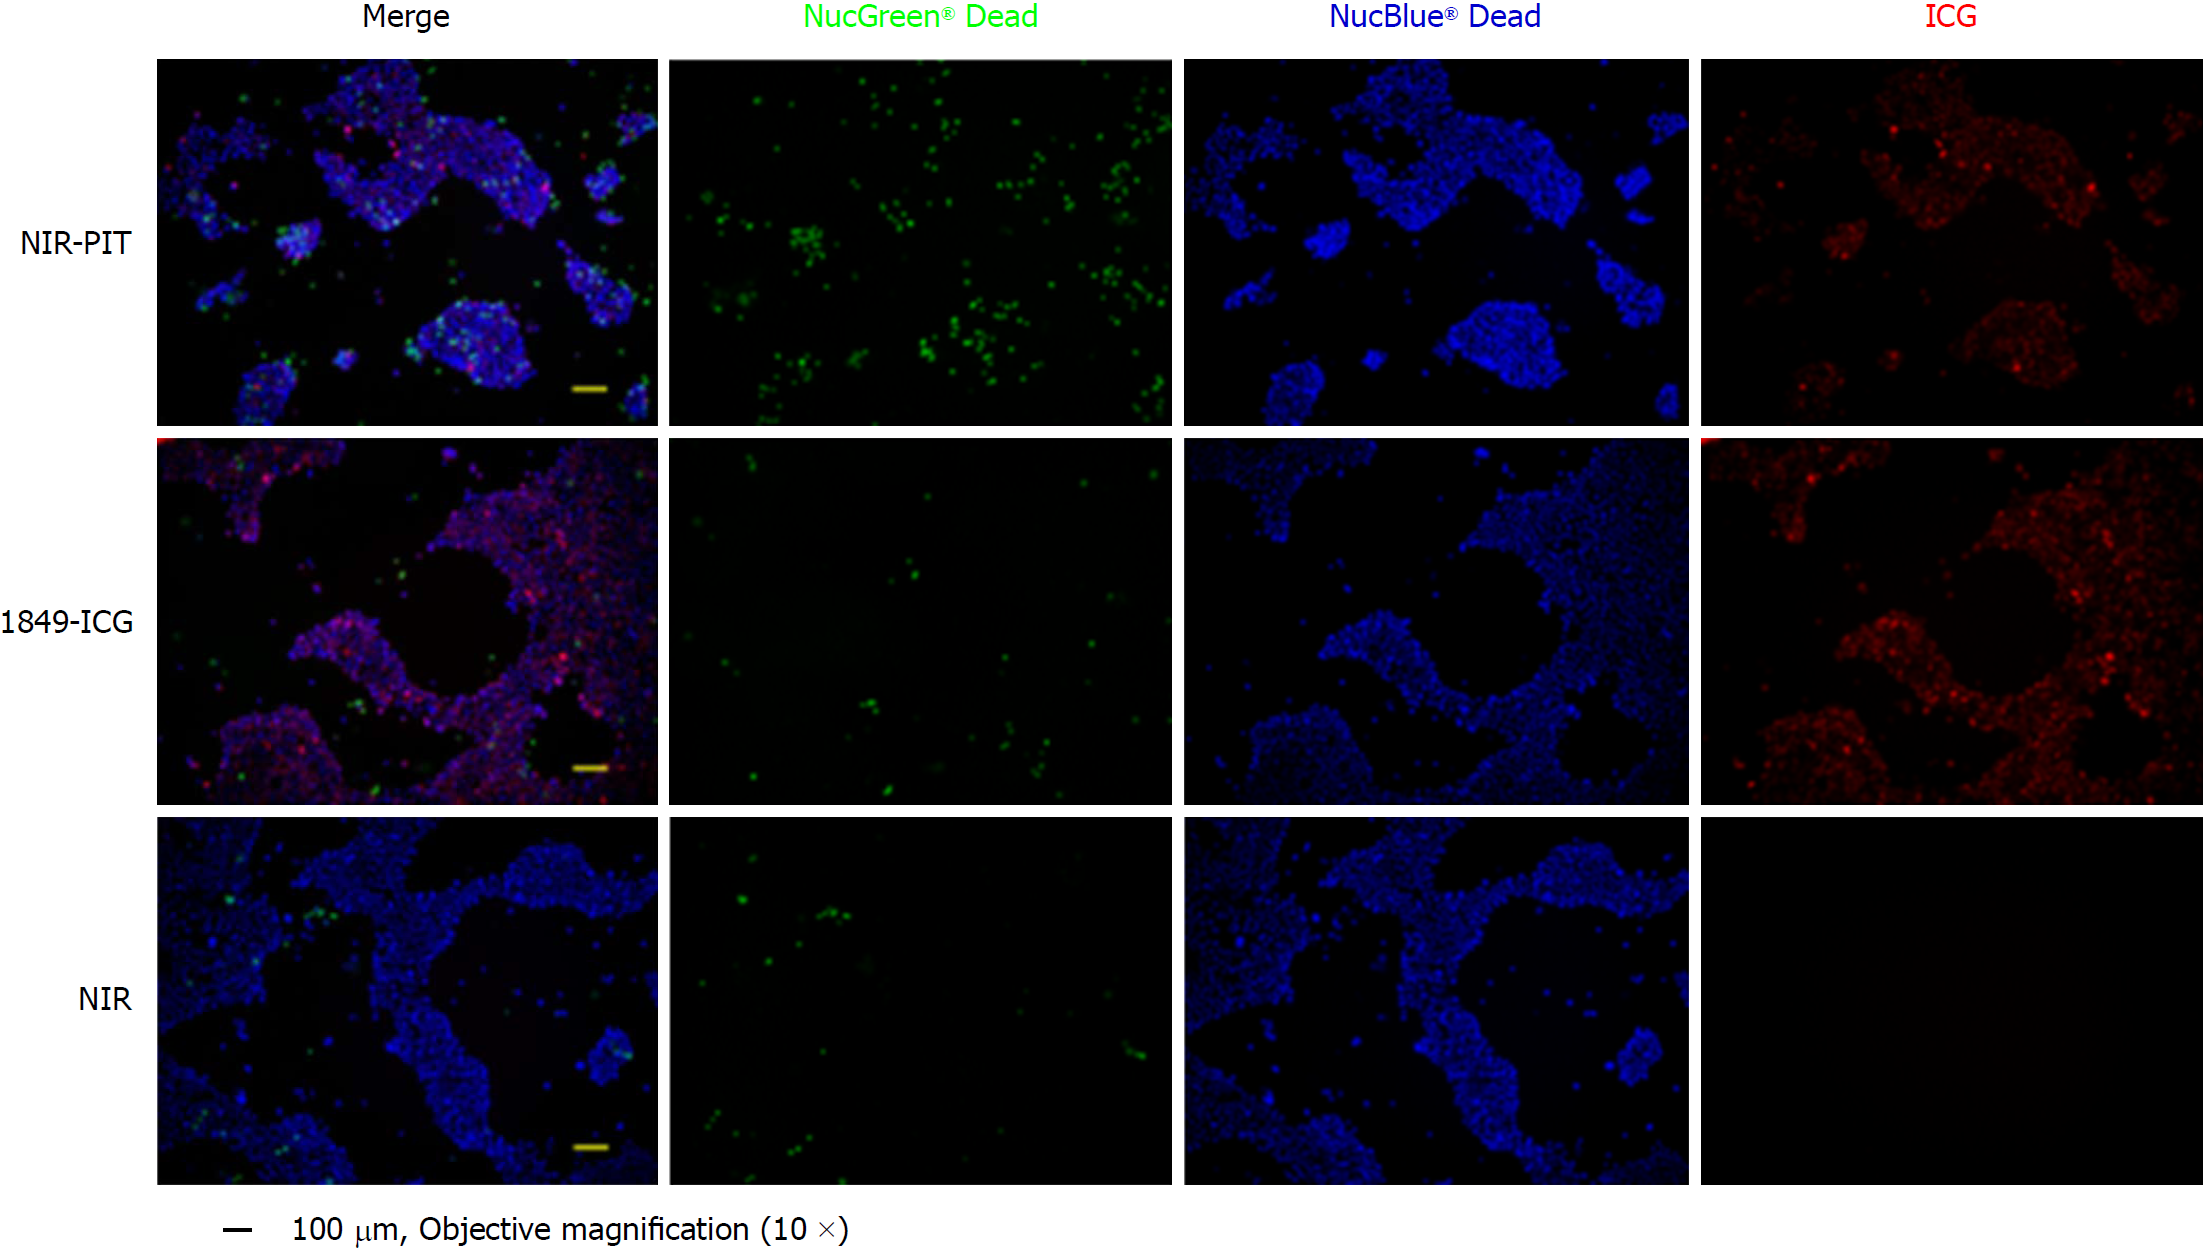
Figure 3 Phototoxic cell death after photoimmunotherapy.
Two hours after photoimmunotherapy (PIT) treatment, the cells were stained using the Cell viability imaging kit. The nuclei of dead cells were stained with NucGreen® Dead reagent (green), while the viable cell nuclei were stained with NucBlue® Live reagent (blue). Near-infrared (NIR)-PIT induced rapid cell death and numerous dead cells were markedly visible. There was no significant cytotoxicity associated with exposure to indocyanine green-labeled anti-tissue factor antibody 1849 or NIR light only. (Scale bar = 100 μm, 10 × objective magnification). 1849-ICG: Indocyanine green-labeled anti-tissue factor antibody 1849; NIR: Near-infrared; PIT: Photoimmunotherapy.
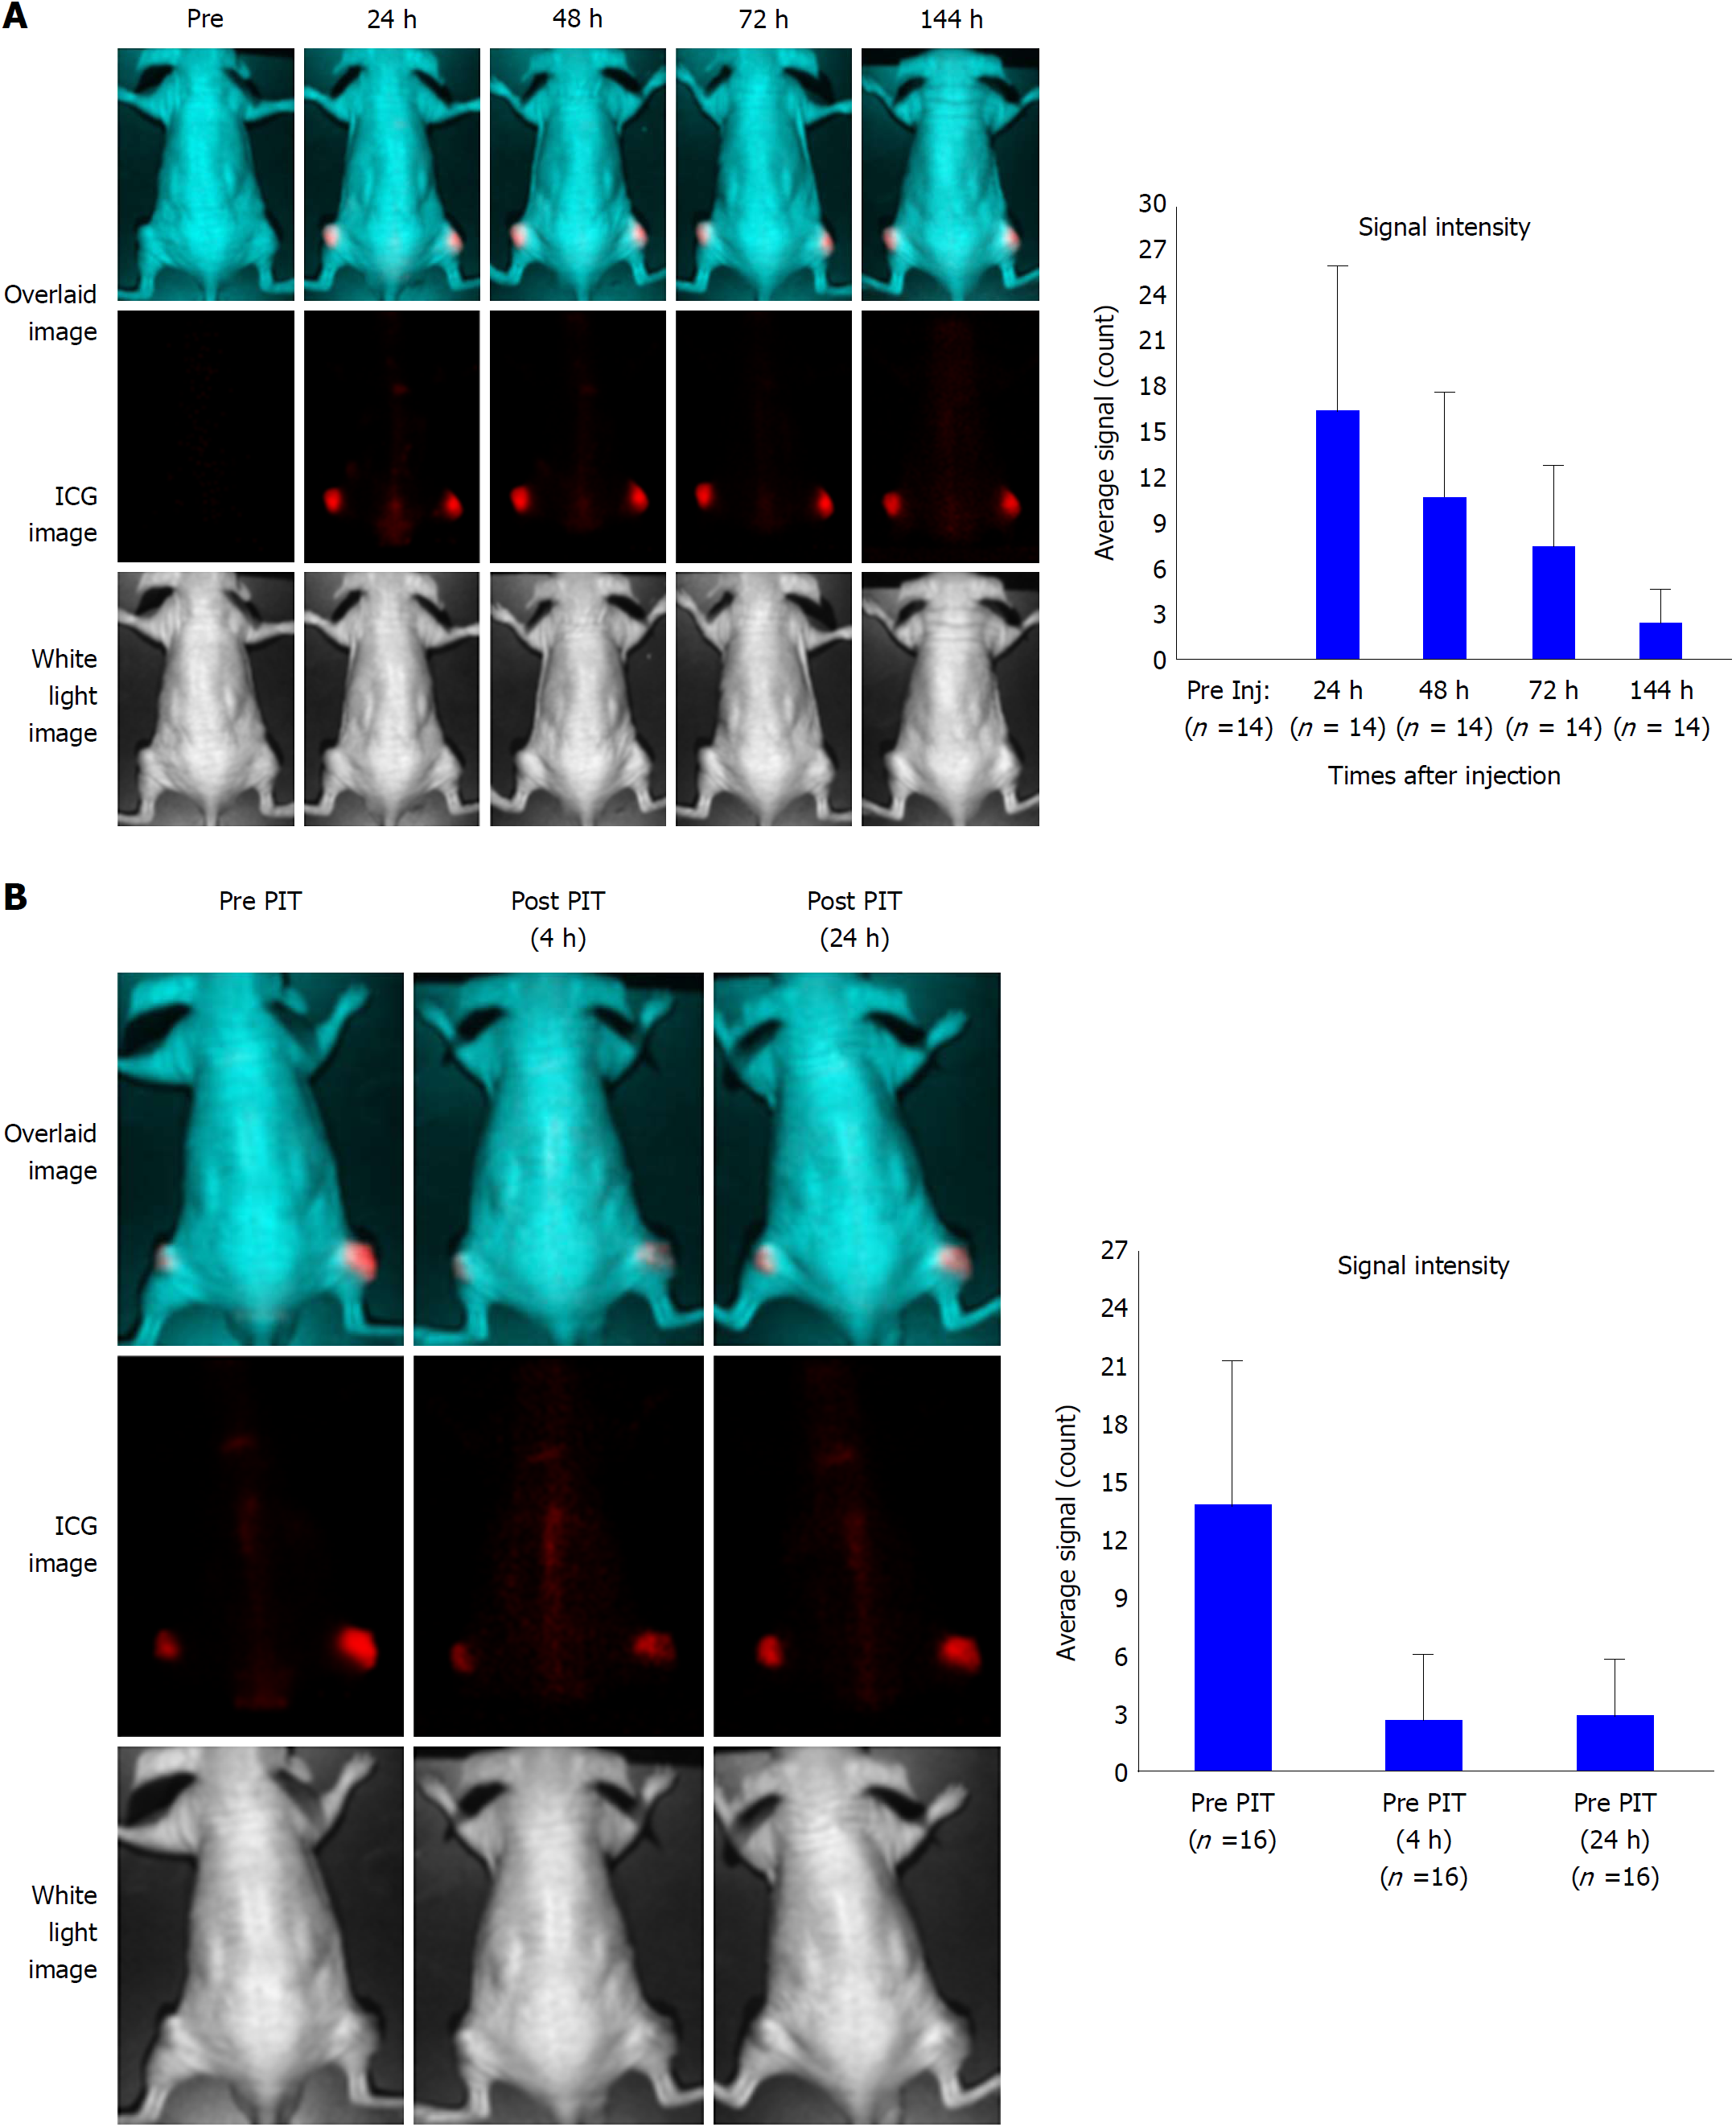
Figure 4 Serial near-infrared fluorescence imaging of a representative mouse bearing xenografted tumor.
A: Imaging was performed pre- and post- injection of indocyanine green (ICG)-labeled anti-tissue factor antibody 1849 (1849-ICG) at indicated time points (24, 48, 72, and 144 h). The upper panel shows the overlaid image of the ICG spectrum image (middle panel) and the white light image (lower panel). Fluorescent signal intensity of BxPC-3 tumors is higher than that of the whole body. Adjoining bar graph shows the ICG specific signal intensity of the tumors over time with the peak intensity at 24 h after the injection. Data are presented as mean ± SD (n = 14); B: Images of tumor bearing mice before photoimmunotherapy (PIT) (left); 2 h (center) and 24 h (right) after PIT. ICG signal intensity in the tumor decreased initially after PIT and was restored in 24 h suggesting re-accumulation of 1849-ICG due to circulating 1849-ICG. Bar graph shows the ICG signal intensity of tumor before and after near-infrared-PIT. Data are presented as mean ± SD (n = 16). 1849-ICG: Indocyanine green-labeled anti-tissue factor antibody 1849; NIR: Near-infrared; PIT: Photoimmunotherapy.
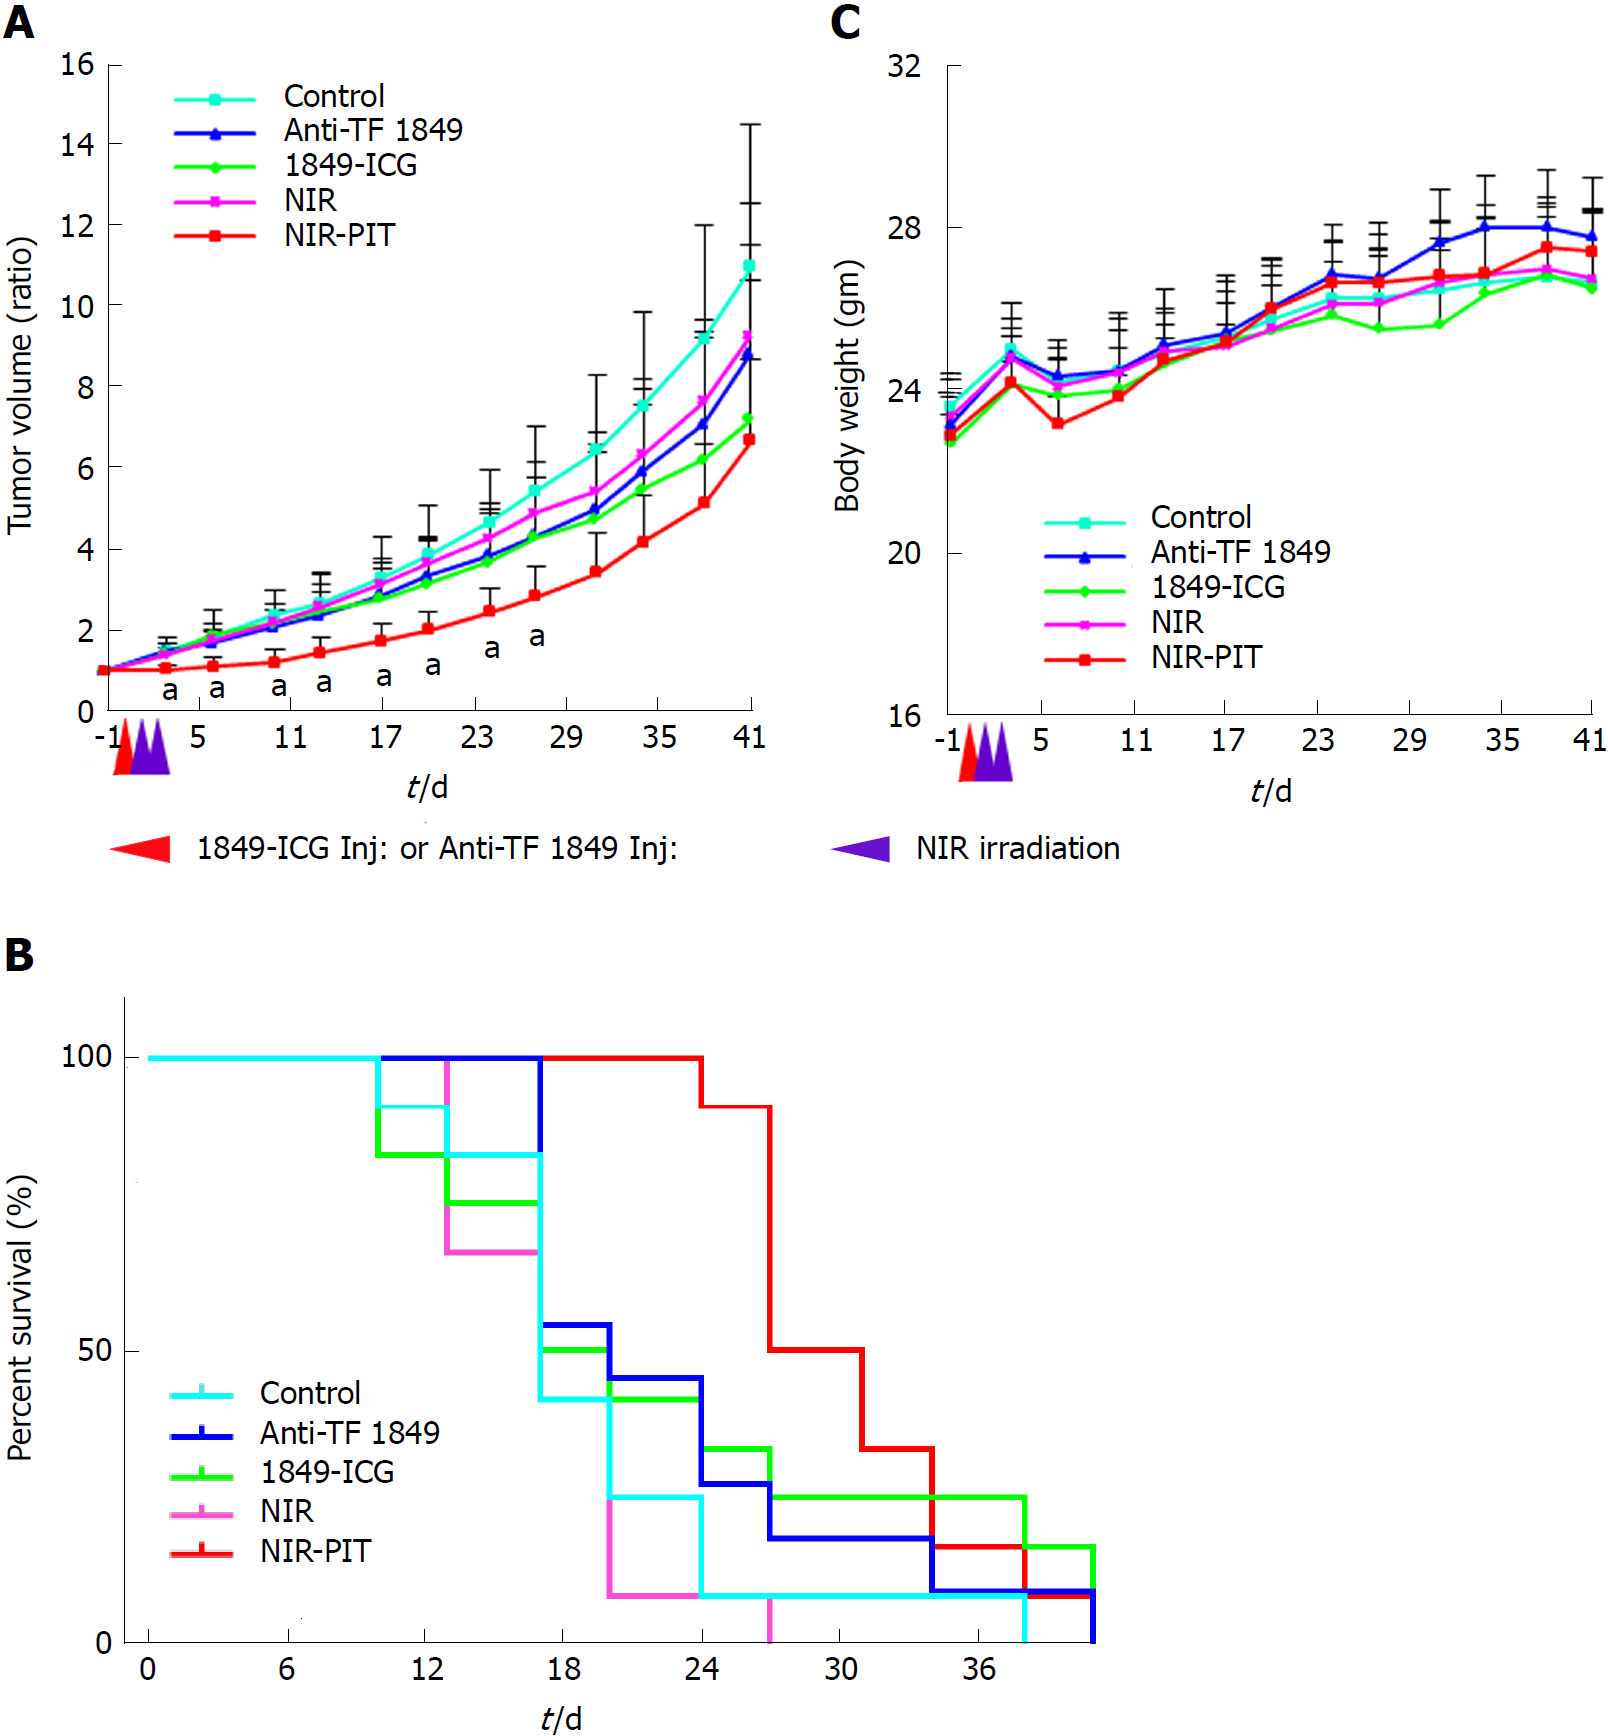
Figure 5 Photoimmunotherapeutic effects on BxPC-3 xenografts and body weight change in mice.
A: Tumor volume change is expressed as the ratio of the volume on the indicated day and volume at 1 d before the start of near-infrared photoimmunotherapy (NIR-PIT). Tumors treated by NIR-PIT (red) showed significantly reduced growth rates compared to those, that received no treatment (light blue), NIR light exposure alone (pink), indocyanine green-labeled anti-tissue factor (TF) antibody 1849 (1849-ICG) alone (green) and anti-TF antibody 1849 (anti-TF 1849) alone (blue), for 27 d after the treatment start date. Values shown represent mean ± SD, aP < 0.05, NIR-PIT vs other groups (n = 12 for each group except n = 11 in anti-TF 1849 group); B: Significantly prolonged survival was observed in NIT-PIT group vs other groups, bP < 0.05, by Gehan-Breslow-Wilcoxon test (n = 12 for each group except n = 11 in anti-TF 1849 group); C: The average body weight did not differ significantly among all 5 groups of mice. Red arrowhead indicates the day of administration of 1849-ICG or Anti-TF 1849 and purple arrowheads indicate the day of NIR exposure. Anti-TF 1849: Anti-tissue factor antibody 1849; 1849-ICG: Indocyanine green-labeled anti-tissue factor antibody 1849; NIR: Near-infrared; PIT: Photoimmunotherapy.
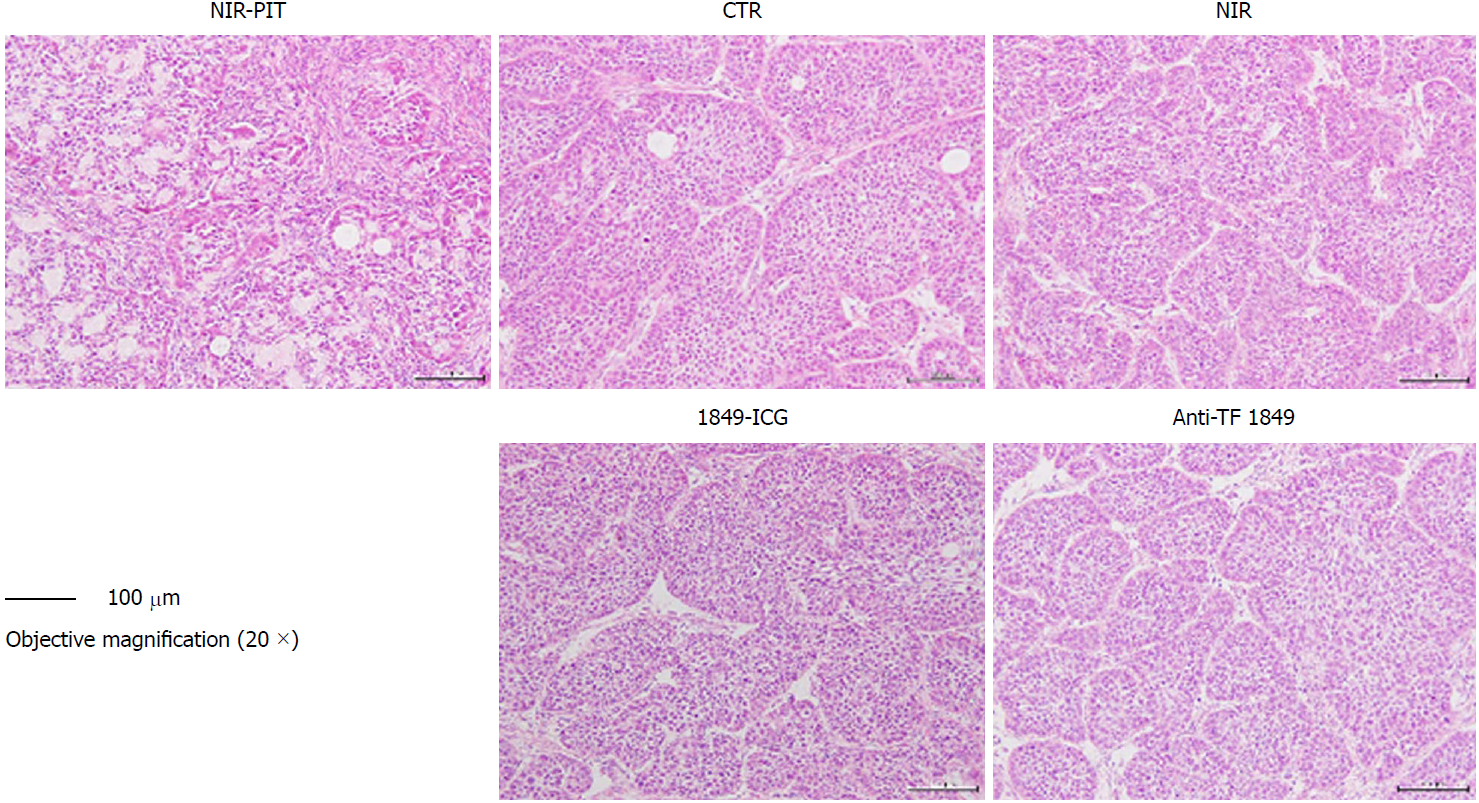
Figure 6 Histological examination of effects of near-infrared photoimmunotherapy 72 h after 2nd exposure to near-infrared light.
Tumors were resected and stained with hematoxylin and eosin. After near-infrared photoimmunotherapy (NIR-PIT), tumors showed necrotic death-associated features including loss of tumor cells and cells nest pattern, scattering of damaged and hypertrophic tumor cells, and abundant fibrosis. No obvious damage was detected in the tumors of other control groups; receiving no treatment, NIR light alone, indocyanine green-labeled anti-tissue factor (TF) antibody 1849 (1849-ICG) alone and anti-TF antibody 1849 (anti-TF 1849) alone. Photos of tumor section were taken under 20 × objective magnification (scale bar = 100 μm). Anti-TF 1849: Anti-tissue factor antibody 1849; CTR: Control; 1849-ICG: Indocyanine green-labeled anti-tissue factor antibody 1849; NIR: Near-infrared; PIT: Photoimmunotherapy.
Figure 7 Ki-67 immunostaining of tumor sections 72 h after 2nd exposure to near-infrared light in near-infrared photoimmunotherapy.
A marked reduction in Ki-67-positive cell numbers was observed in tumors treated with near-infrared photoimmunotherapy, compared with those of other control groups. Tumor section photos were taken under 20 × objective magnification (scale bar = 100 μm). Anti-TF 1849: Anti-tissue factor antibody 1849; CTR: Control; 1849-ICG: Indocyanine green-labeled anti-tissue factor antibody 1849; NIR: Near-infrared; PIT: Photoimmunotherapy.
- Citation: Aung W, Tsuji AB, Sugyo A, Takashima H, Yasunaga M, Matsumura Y, Higashi T. Near-infrared photoimmunotherapy of pancreatic cancer using an indocyanine green-labeled anti-tissue factor antibody. World J Gastroenterol 2018; 24(48): 5491-5504
- URL: https://www.wjgnet.com/1007-9327/full/v24/i48/5491.htm
- DOI: https://dx.doi.org/10.3748/wjg.v24.i48.5491


