Copyright
©The Author(s) 2018.
World J Gastroenterol. Dec 14, 2018; 24(46): 5246-5258
Published online Dec 14, 2018. doi: 10.3748/wjg.v24.i46.5246
Published online Dec 14, 2018. doi: 10.3748/wjg.v24.i46.5246
Figure 1 Chemical structure and spectral properties of (17R,18R)-2-(1-hexyloxyethyl)-2-devinyl chlorine E6 trisodium salt.
A: Chemical structure of the photosensitizer (17R,18R)-2-(1-hexyloxyethyl)-2-devinyl chlorine E6 trisodium salt (YLG-1). B: Absorption spectra of YLG-1 in different solutions. C: Fluorescence emission spectra of YLG-1 in different solutions excited at different wavelengths. FL: Fluorescence; YLG-1: (17R,18R)-2-(1-hexyloxyethyl)-2-devinyl chlorine E6 trisodium salt.
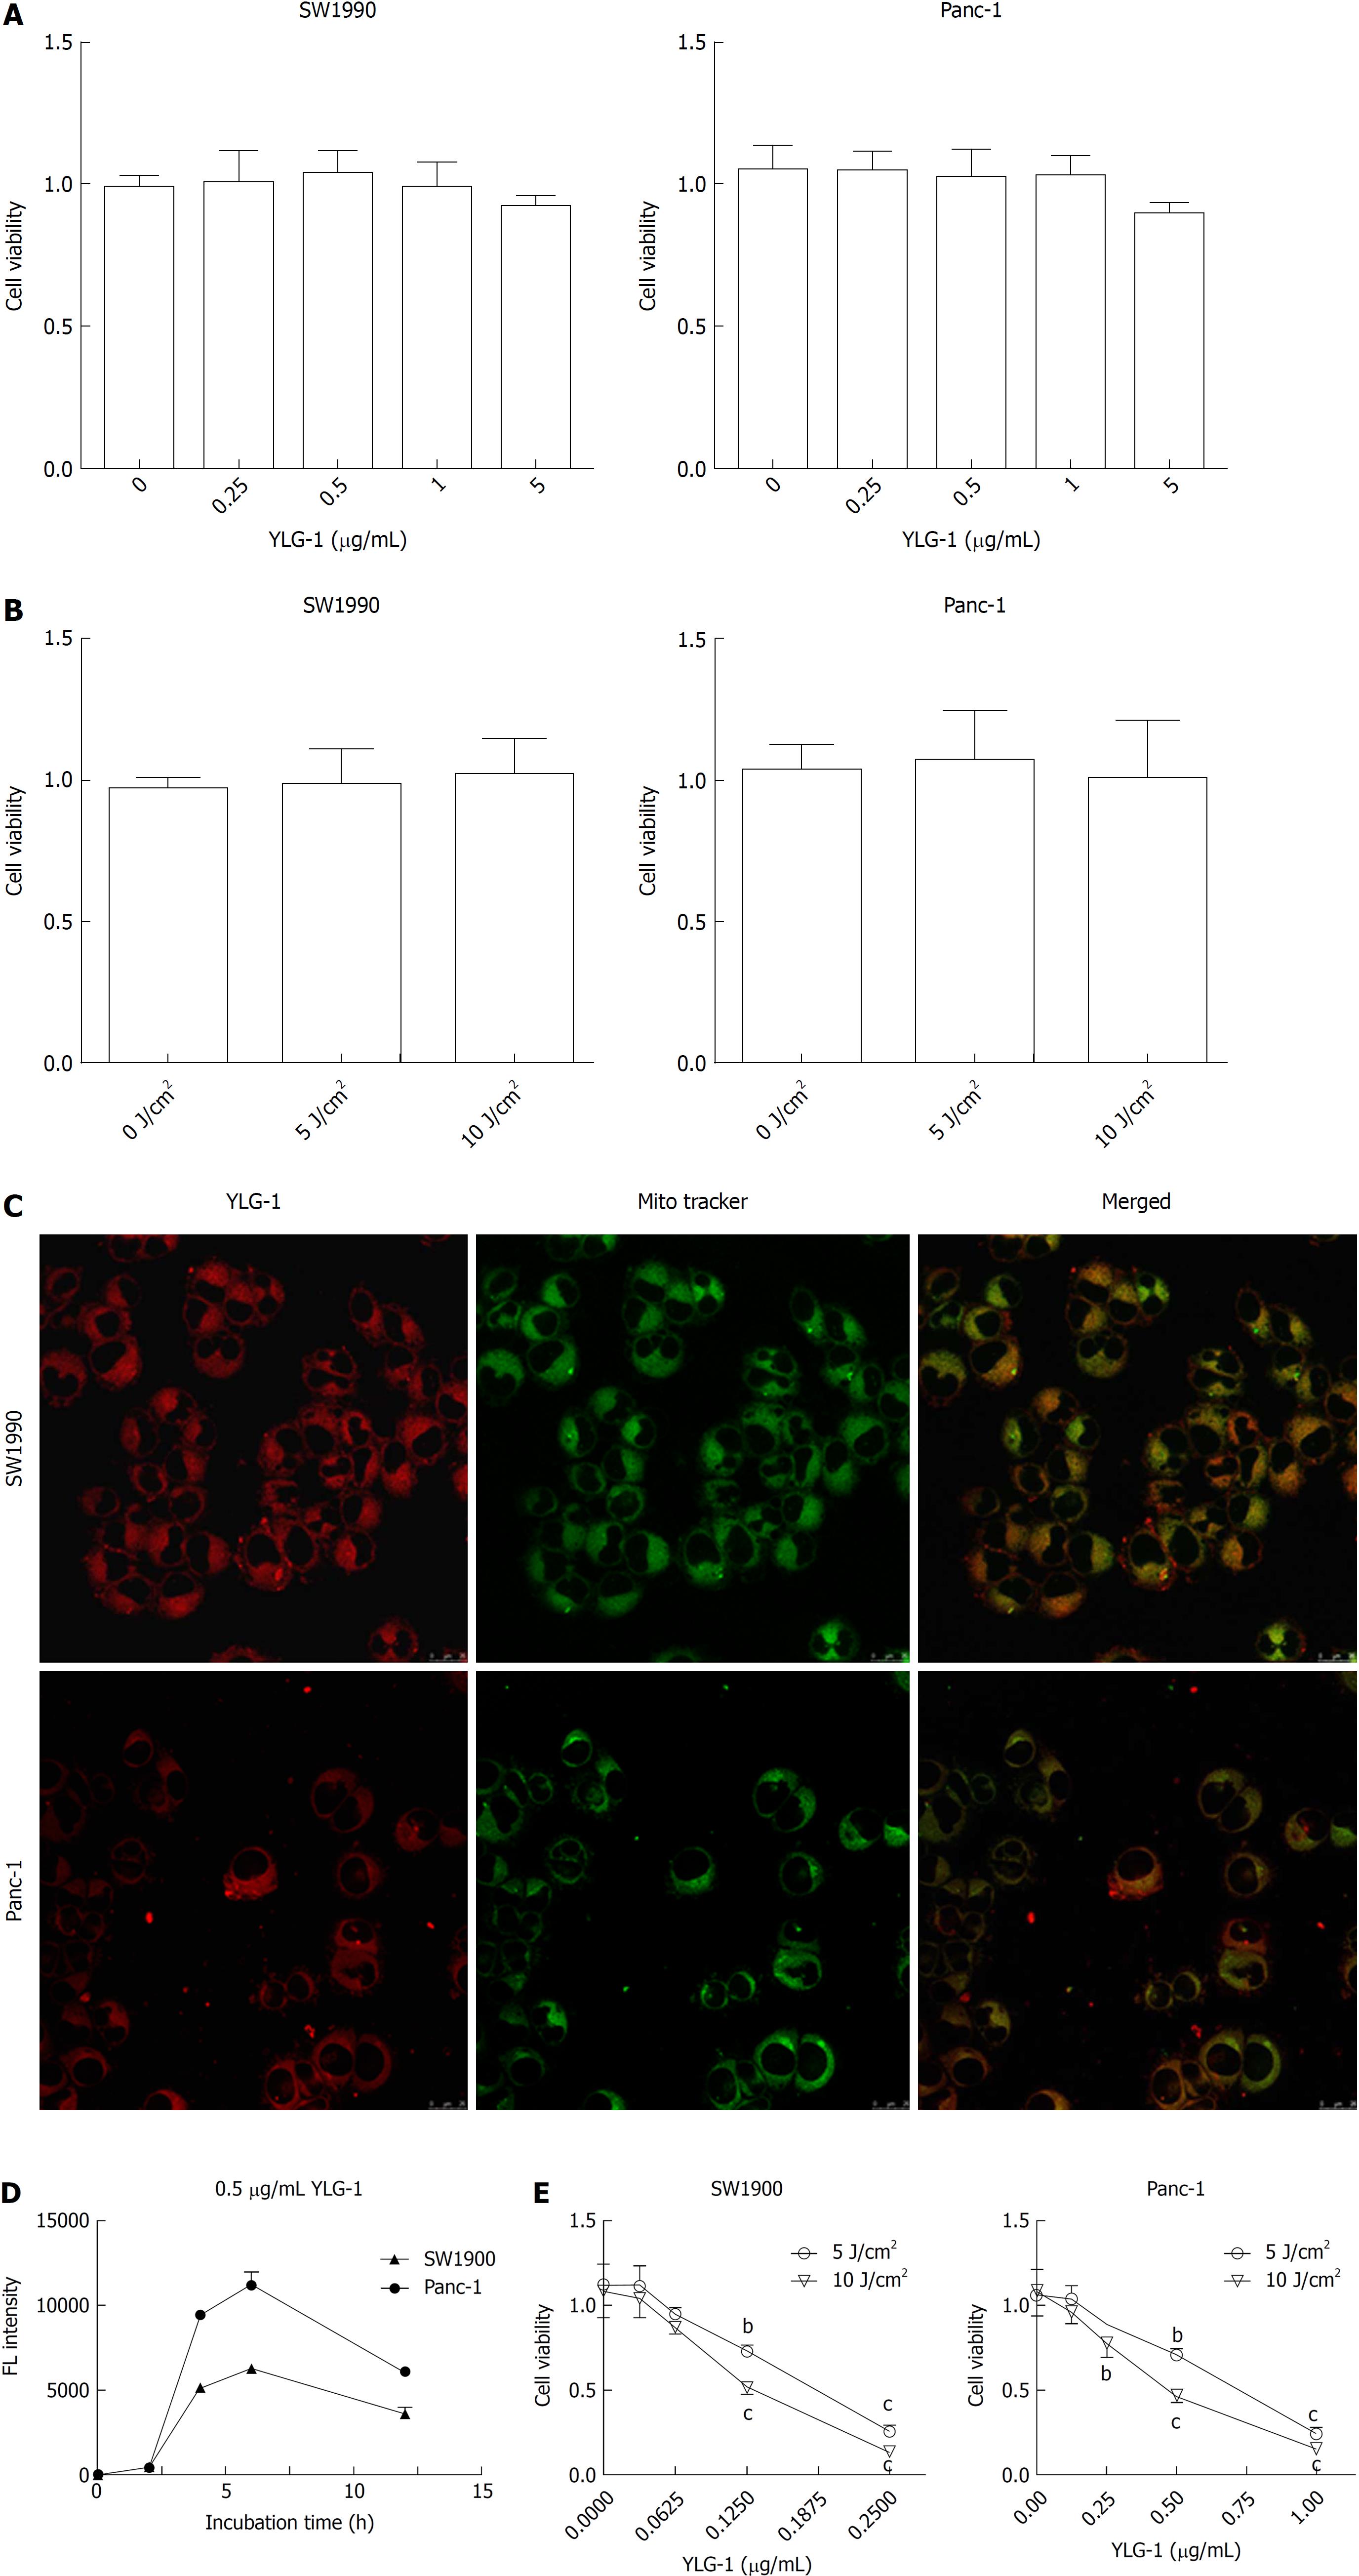
Figure 2 Phototoxicity, cellular uptake, and localization of (17R,18R)-2-(1-hexyloxyethyl)-2-devinyl chlorine E6 trisodium salt in vitro.
A: Effect of various concentrations of (17R,18R)-2-(1-hexyloxyethyl)-2-devinyl chlorine E6 trisodium salt (YLG-1) (0-5 μg/mL) alone on SW1990 and Panc-1 cell viability. B: Influence of different doses of laser light (0-10 J/cm2) on pancreatic cancer cell viability. C: Intracellular localization of YLG-1. Red, green, and yellow fluorescence (FL) corresponded to YLG-1, MitoTracker-stained mitochondria, and colocalization of the red and green FL, respectively. Scale bar = 25 μm. D: Cellular uptake of YLG-1 detected at 0-12 h via incubation with 0.5 μg/mL YLG-1 in vitro. E: SW1990 and Panc-1 cells incubated with 0-0.25 or 0-1.0 μg/mL YLG-1 for 6 h followed by exposure to 5 or 10 J/cm2 illumination, respectively. The effect of phototoxicity on cell viability was assessed by CCK-8 assay after 24 h. Data are expressed as the mean ± SD (n = 3). bP < 0.01, cP < 0.001 vs the corresponding group without YLG-1 treatment. YLG-1: (17R,18R)-2-(1-hexyloxyethyl)-2-devinyl chlorine E6 trisodium salt; FL: Fluorescence.
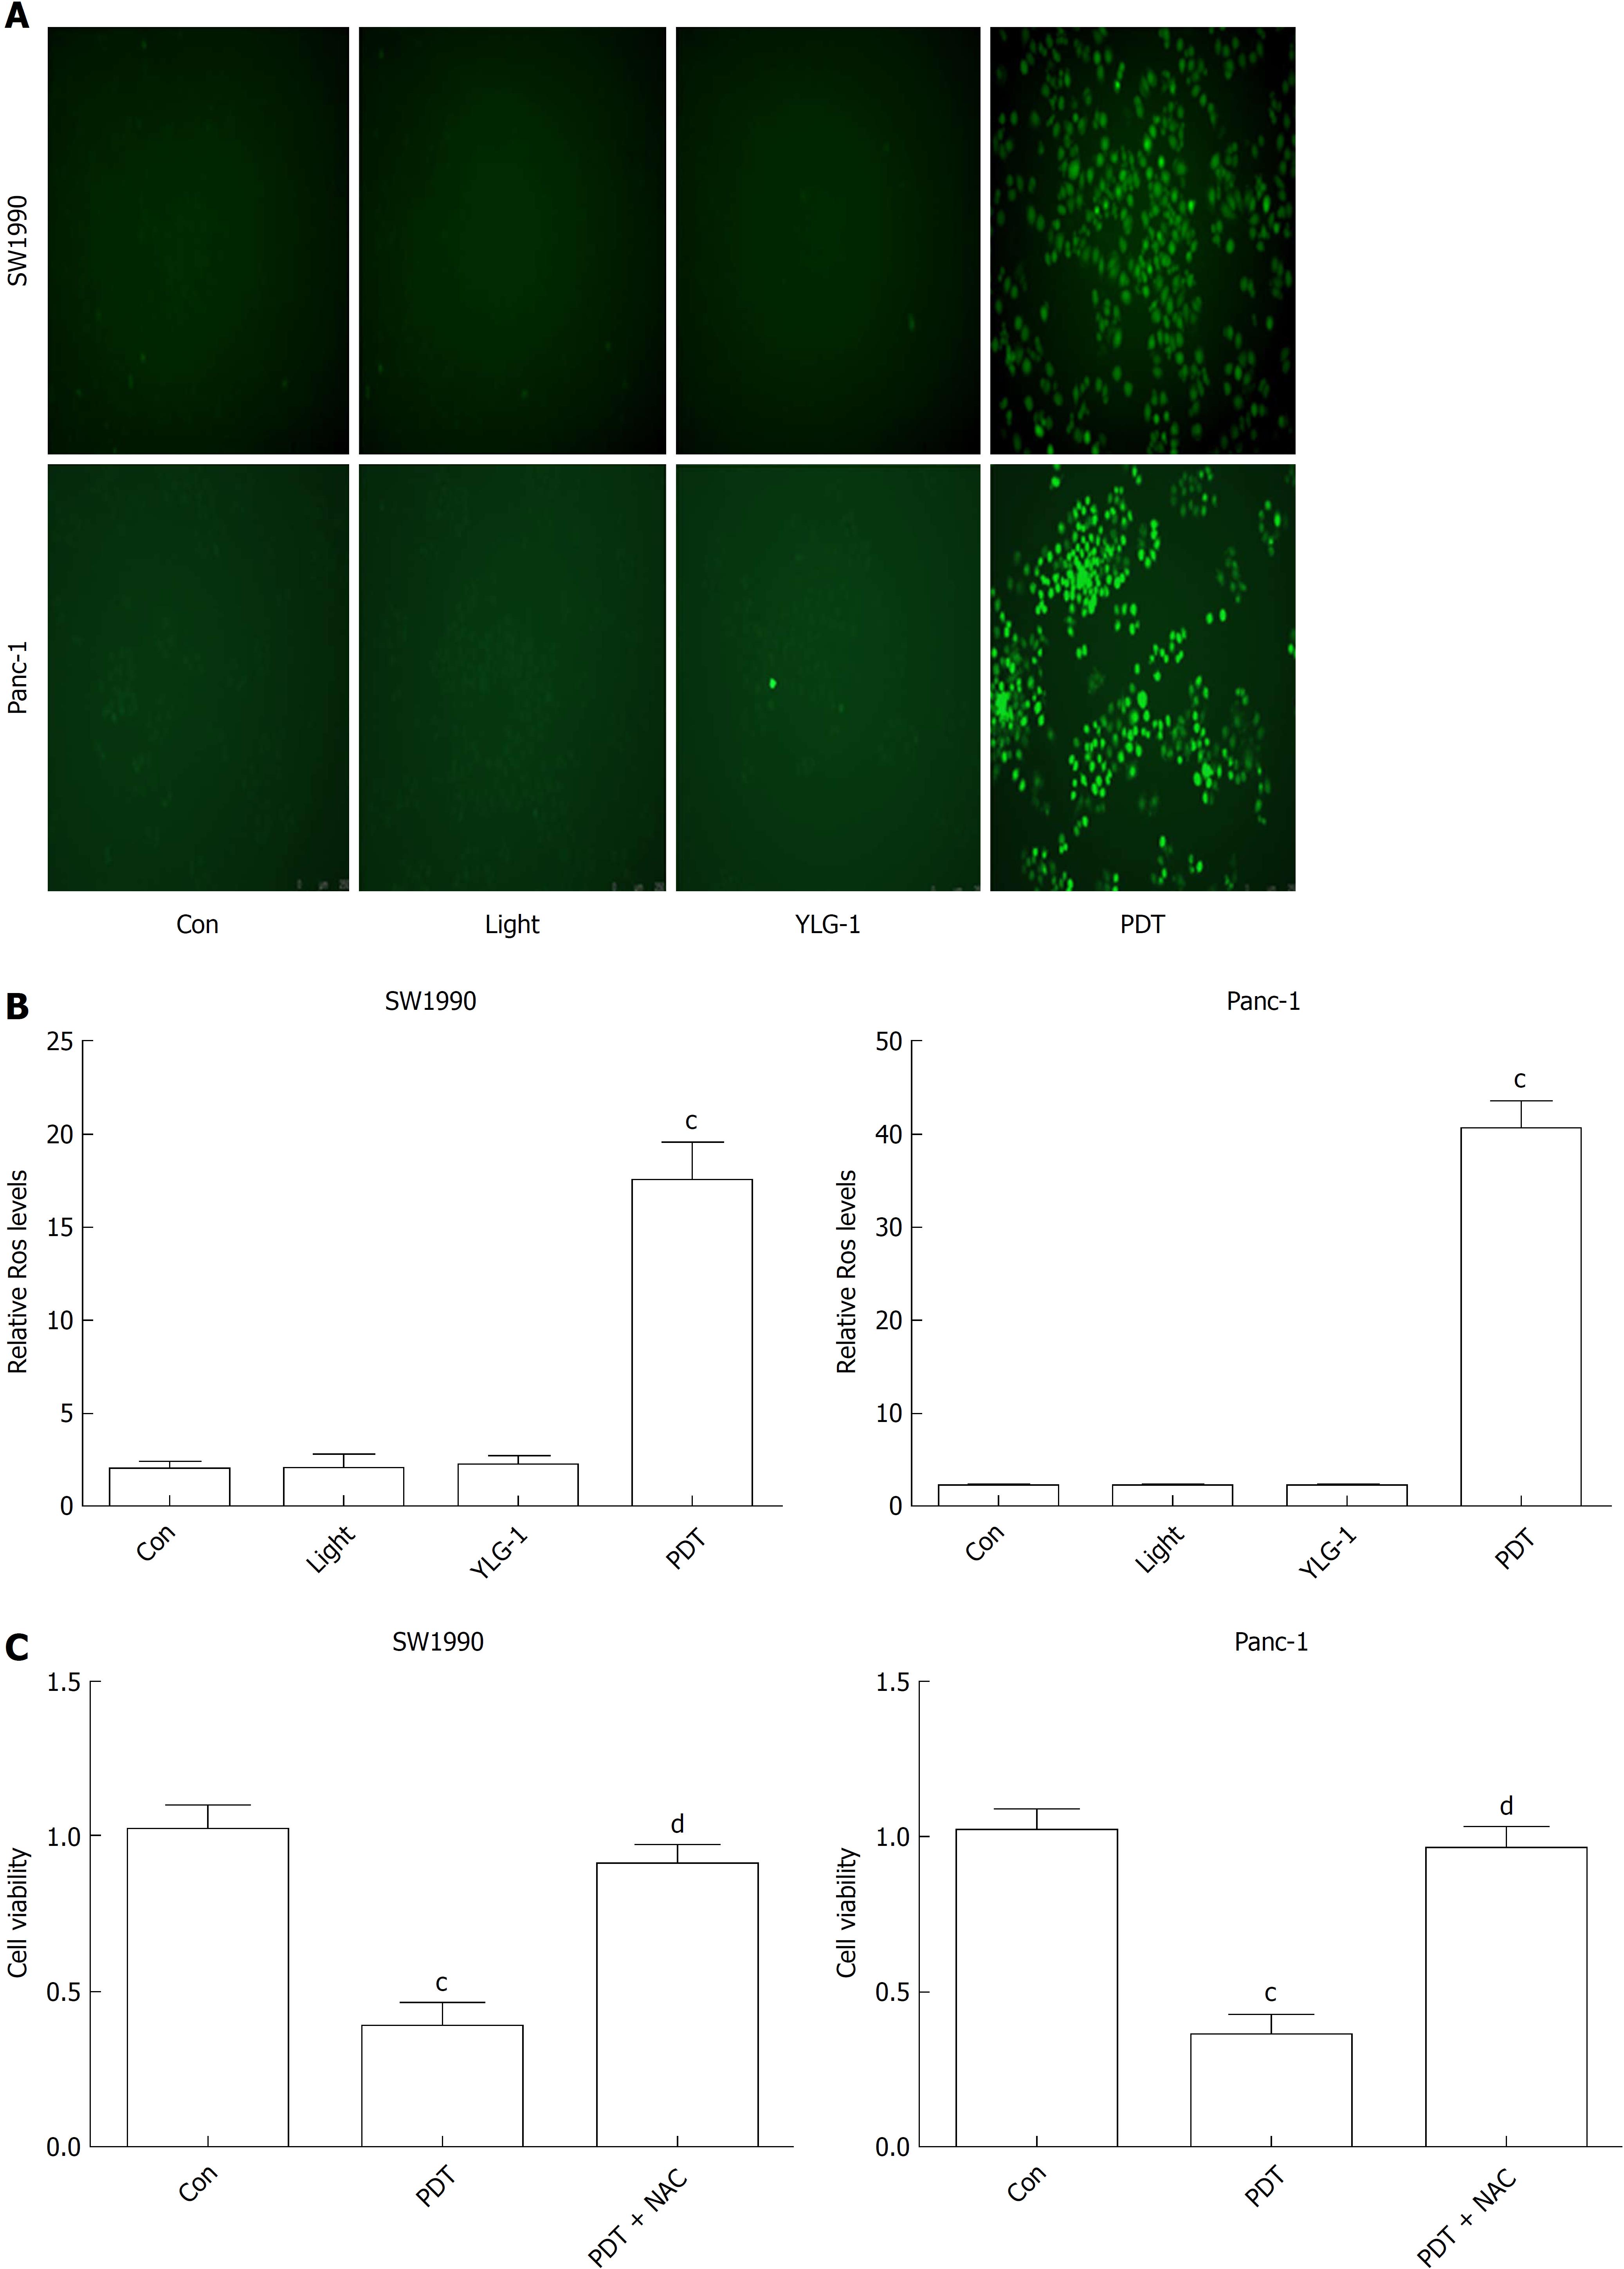
Figure 3 (17R,18R)-2-(1-hexyloxyethyl)-2-devinyl chlorine E6 trisodium salt-induced photodynamic therapy kills pancreatic cancer cells by inducing reactive oxygen species.
A: Fluorescence images of intracellular reactive oxygen species (ROS) in SW1990 and Panc-1 cells at 1 h post-photodynamic therapy (PDT) (magnification, 200×). B: Quantitative analysis of ROS production using the scanning multimode reader. C: Effect of the ROS scavenger N-acetyl-L-cysteine on the cytotoxicity induced by (17R,18R)-2-(1-hexyloxyethyl)-2-devinyl chlorine E6 trisodium salt-induced PDT. Data are expressed as the mean ± SD (n = 3). cP < 0.001 vs Con group, dP < 0.001 vs the PDT group. FL: Fluorescence; ROS: Reactive oxygen species; YLG-1: (17R,18R)-2-(1-hexyloxyethyl)-2-devinyl chlorine E6 trisodium salt; PDT: Photodynamic therapy; NAC: N-acetyl-L-cysteine.
Figure 4 (17R,18R)-2-(1-hexyloxyethyl)-2-devinyl chlorine E6 trisodium salt-induced photodynamic therapy promotes pancreatic cancer cell apoptosis in vitro.
A: Analysis of apoptosis rate by flow cytometry at 4 h post photodynamic therapy. B: Bcl-2, Bax, and, cleaved Caspase-3 protein levels determined by Western blot. β-actin was used as an internal reference. Data are expressed as the mean ± SD (n = 3). aP < 0.05, bP < 0.01, and cP < 0.001 vs the Con group. YLG-1: (17R,18R)-2-(1-hexyloxyethyl)-2-devinyl chlorine E6 trisodium salt; PDT: Photodynamic therapy.
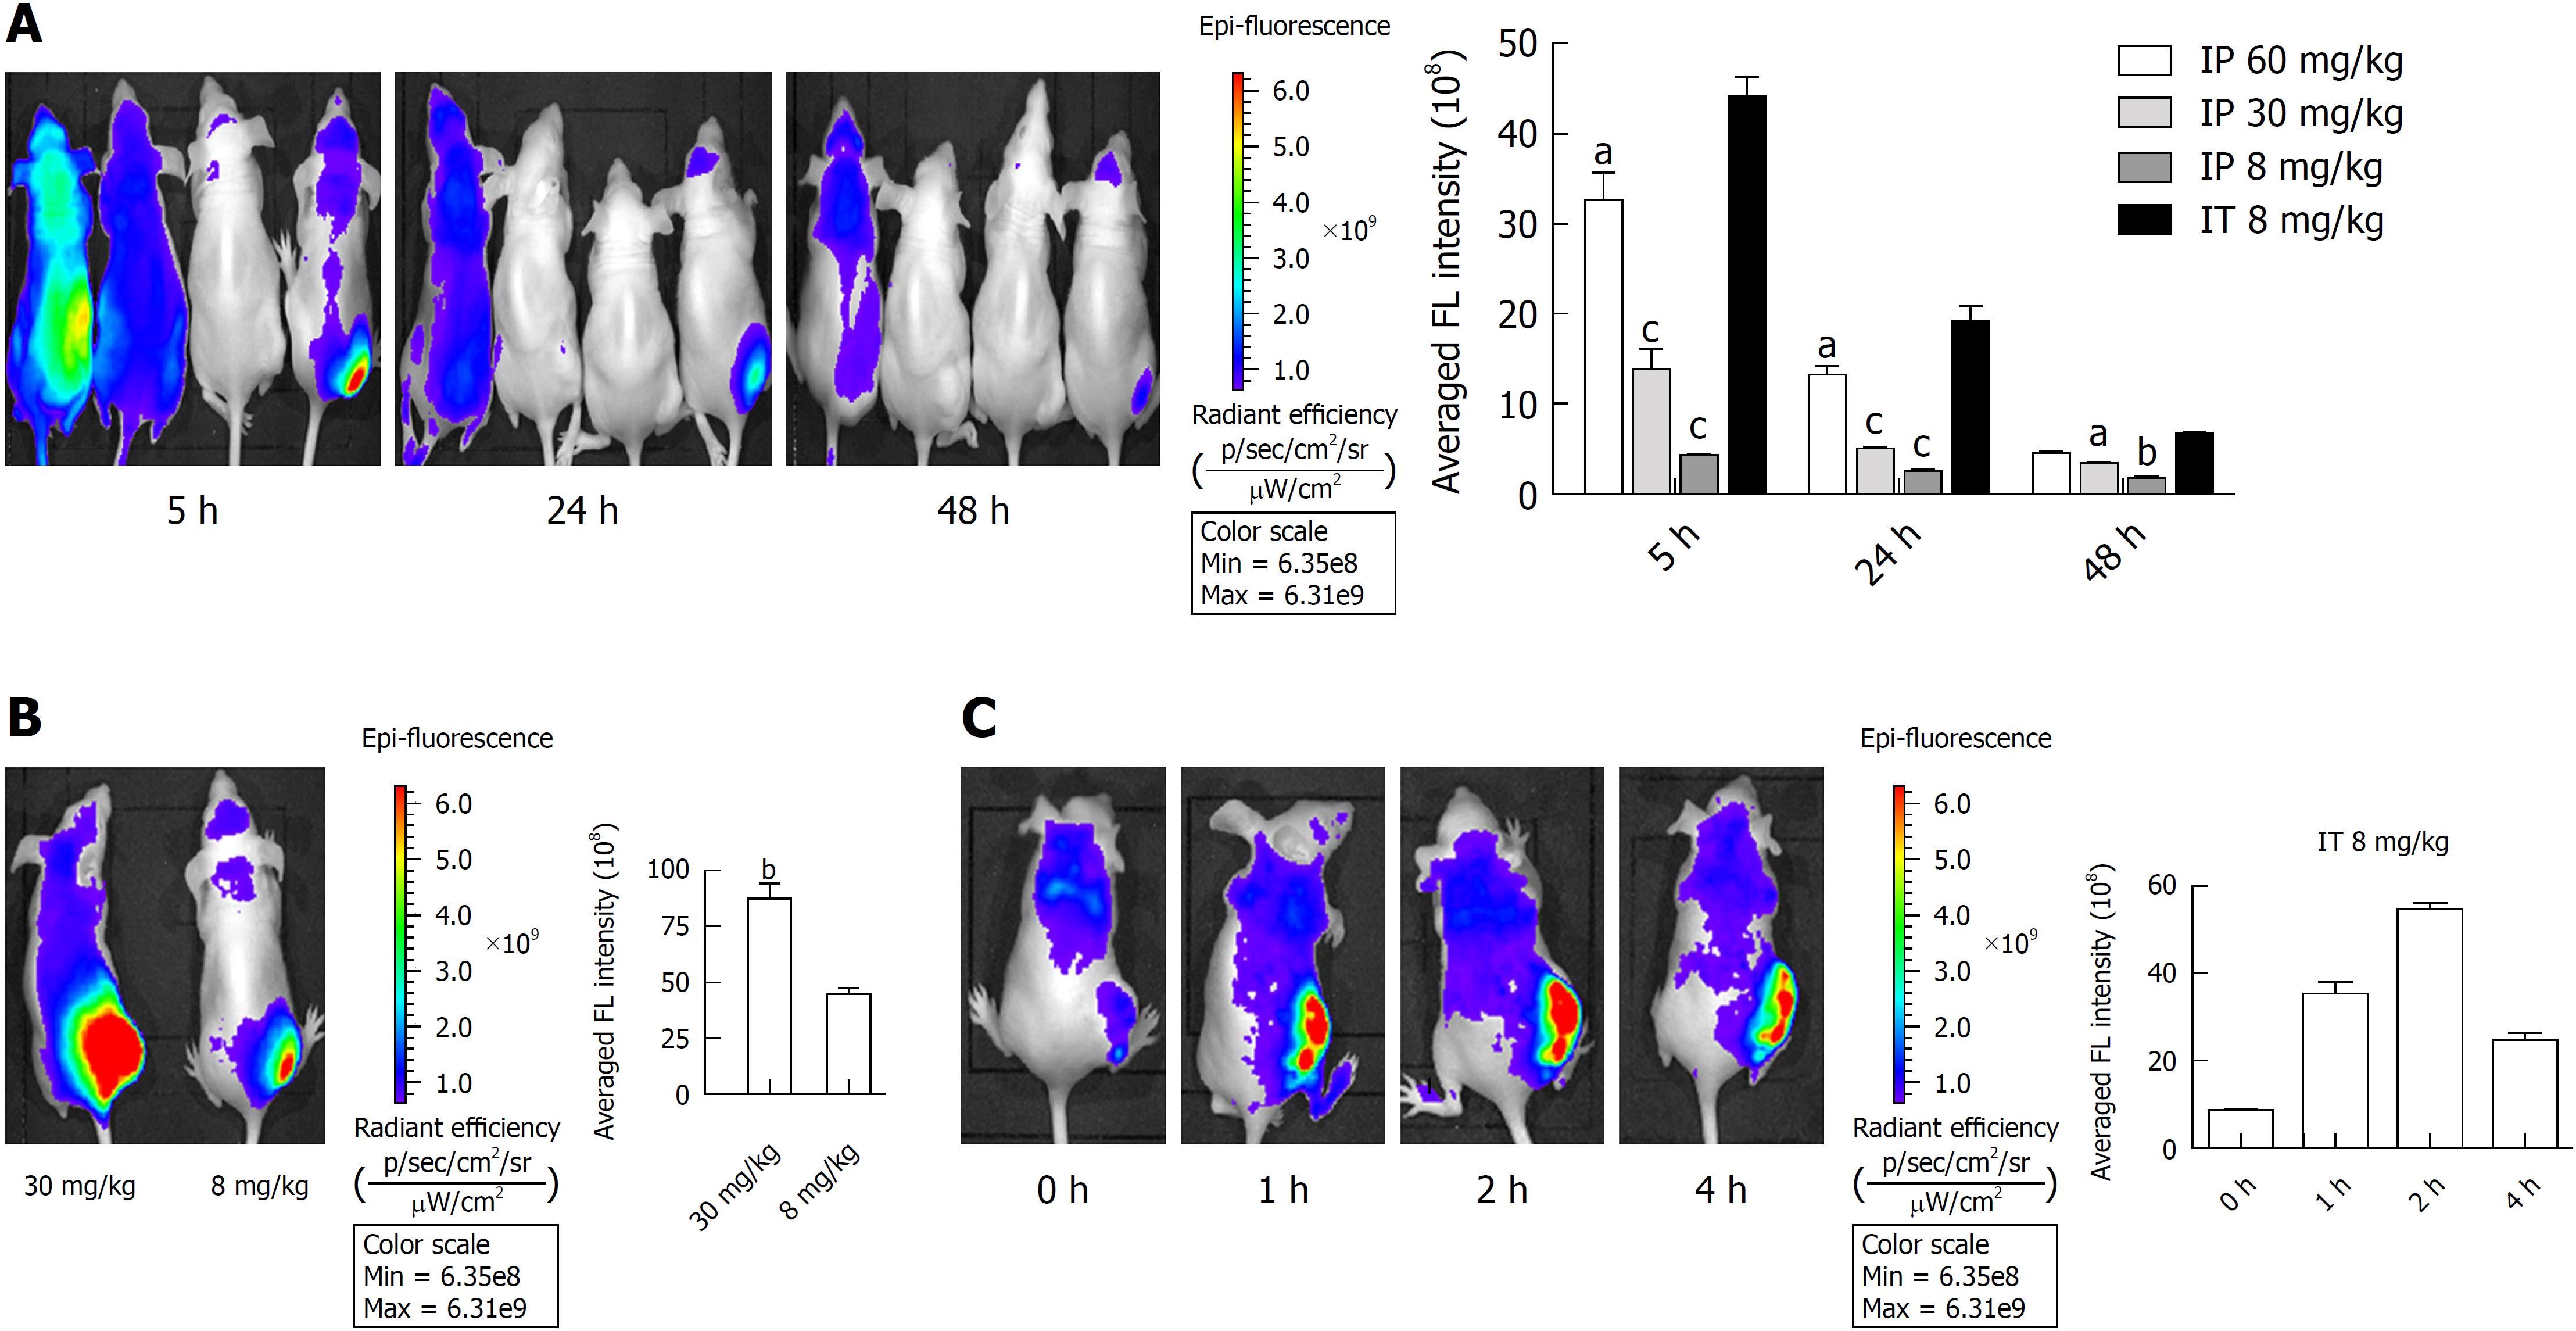
Figure 5 Biodistribution of (17R,18R)-2-(1-hexyloxyethyl)-2-devinyl chlorine E6 trisodium salt in vivo.
A: In vivo fluorescence (FL) images and quantitative evaluation of the Panc-1 tumor-bearing mice at 5, 24, and 48 h post-intraperitoneal (IP) or -intratumoral (IT) injection of (17R,18R)-2-(1-hexyloxyethyl)-2-devinyl chlorine E6 trisodium salt (YLG-1). Mice listed from left to right were respectively administered with 60, 30, and 8 mg/kg YLG-1 via IP injection and 8 mg/kg YLG-1 by IT injection. B: In vivo FL image and quantitative analysis of mice at 5 h after IT injection with 30 or 8 mg/kg YLG-1. C: In vivo FL images and quantitative analysis of mice at 0, 1, 2, and 4 h post-IT injection of 8 mg/kg YLG-1. The FL intensity of YLG-1 in the tumor site was quantified using the same color scale (min = 6.35e8 and max = 6.31e9). The data are shown as the mean ± SD (n = 3). aP < 0.05, bP < 0.01, and cP < 0.001 vs the corresponding IT injection group. YLG-1: (17R,18R)-2-(1-hexyloxyethyl)-2-devinyl chlorine E6 trisodium salt; FL: Fluorescence; IP: Intraperitoneal; IT: Intratumoral.
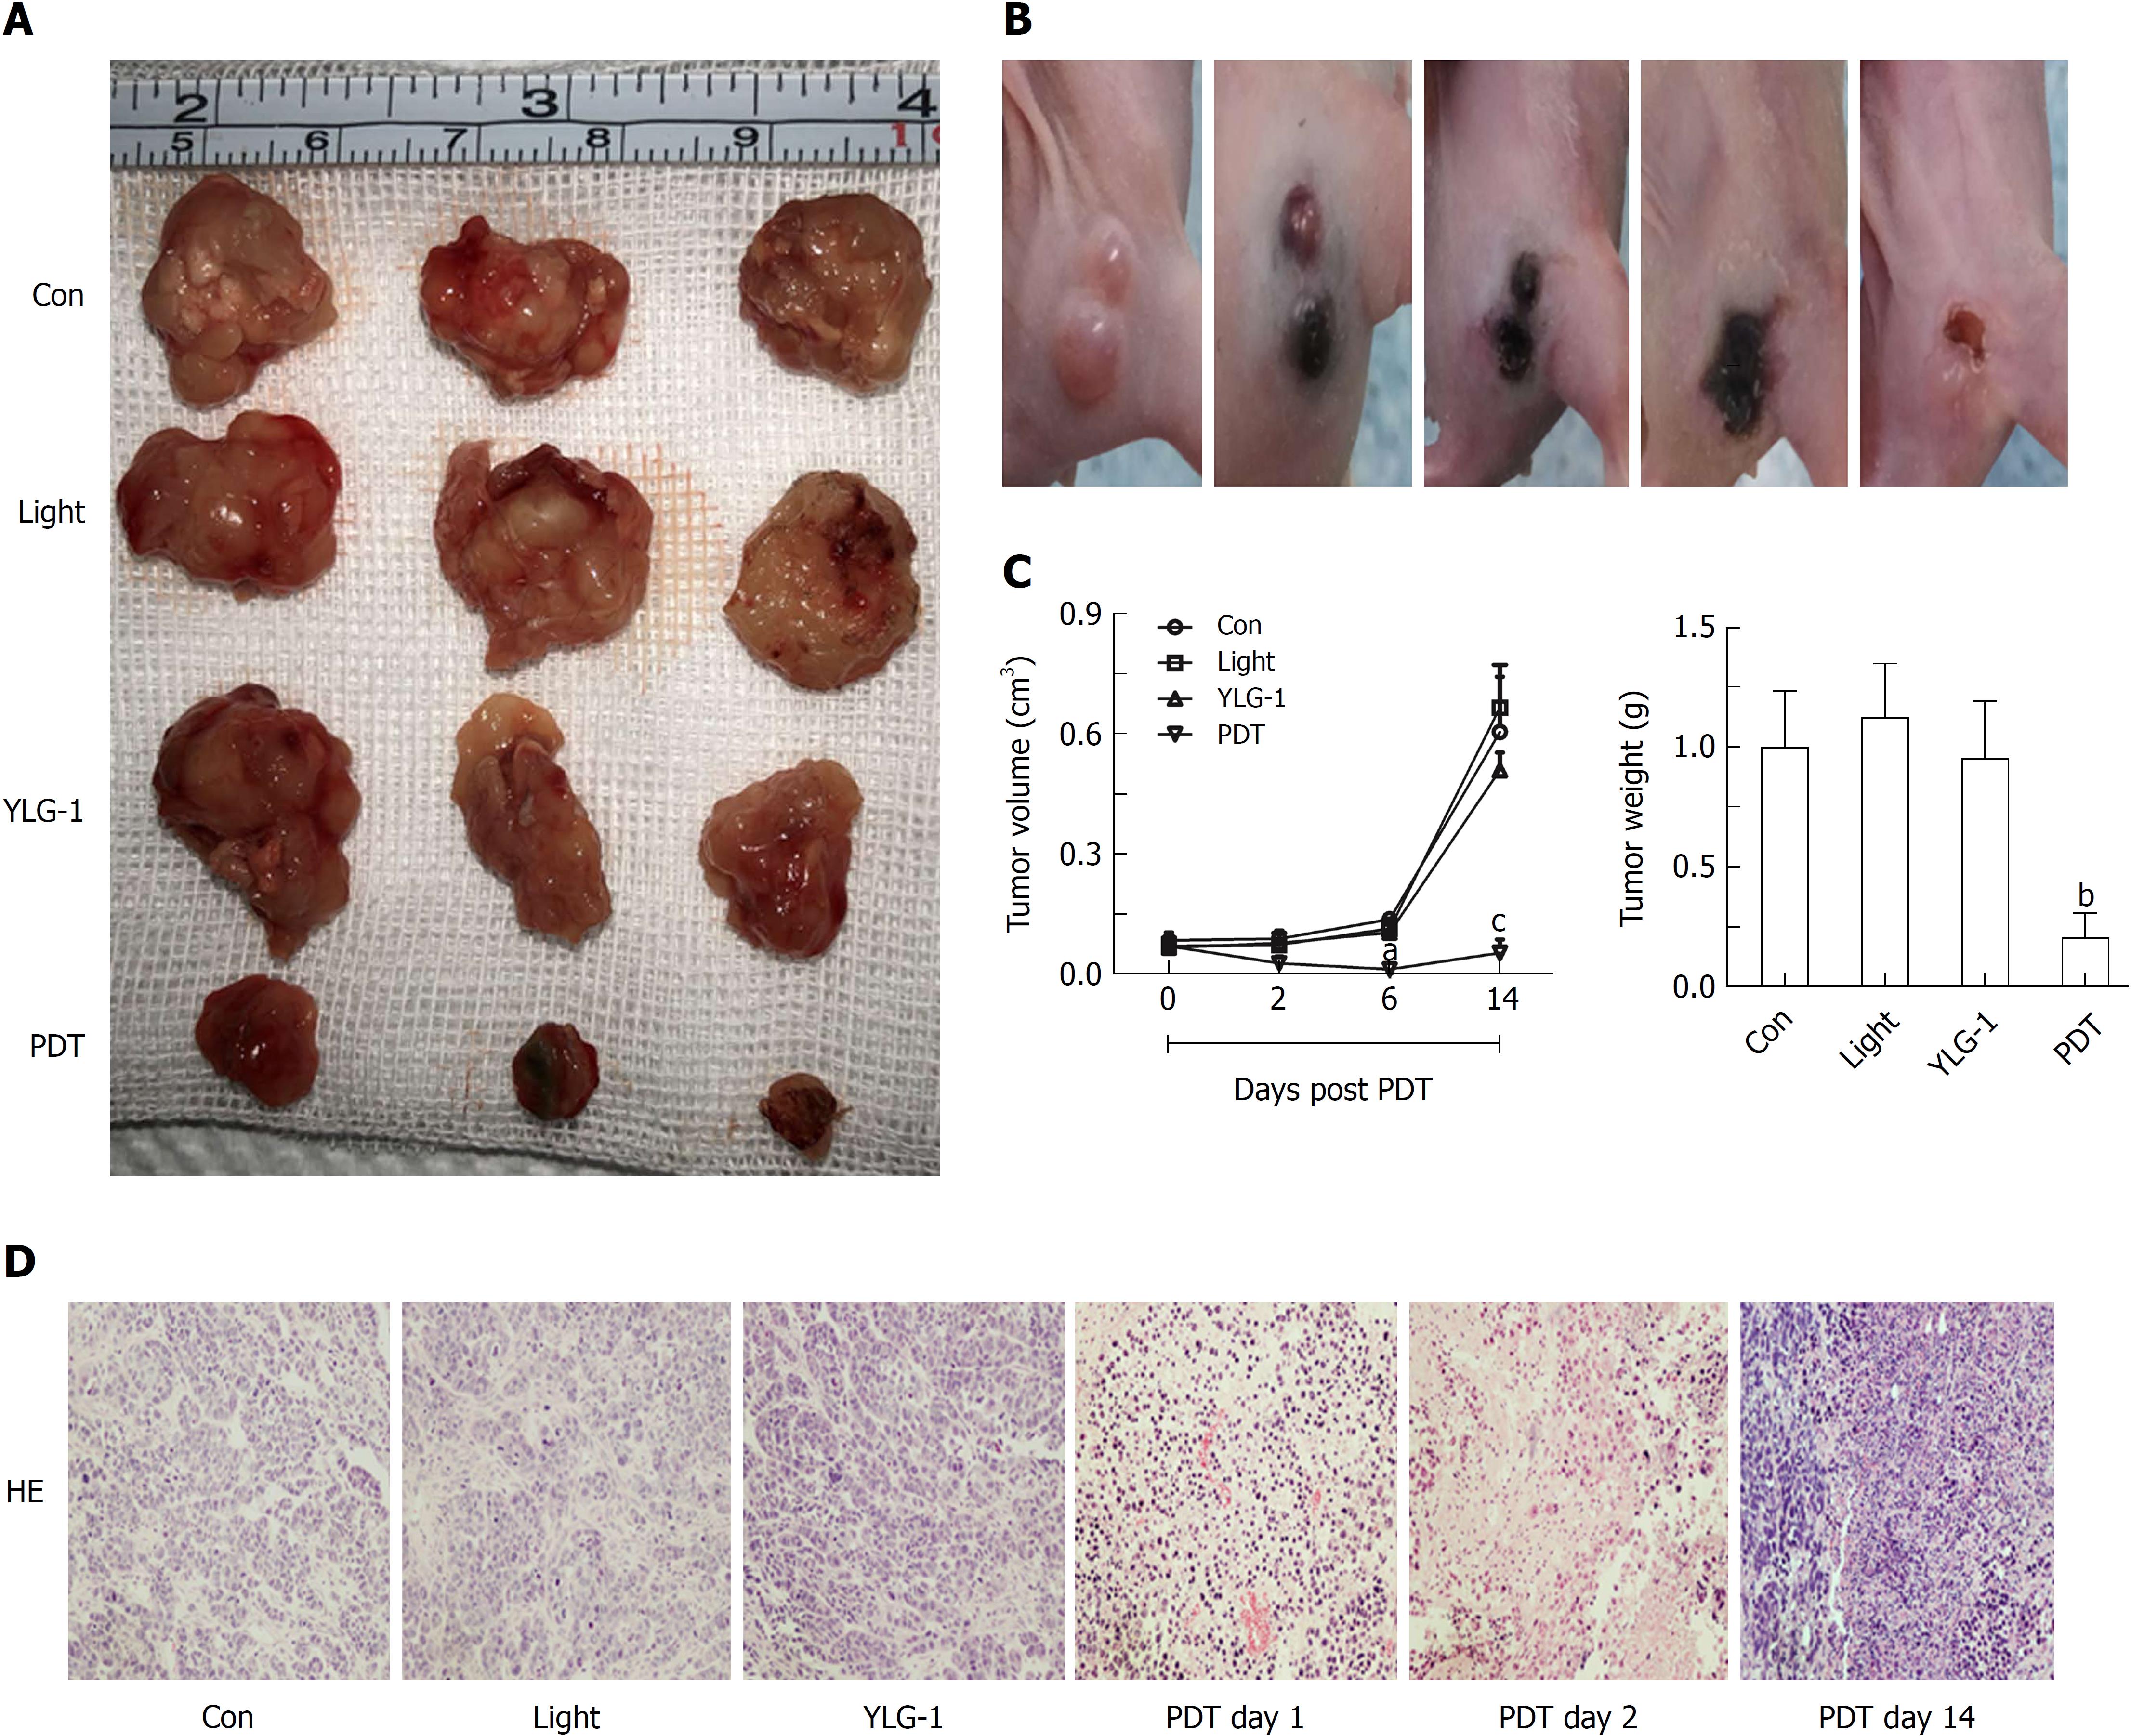
Figure 6 (17R,18R)-2-(1-hexyloxyethyl)-2-devinyl chlorine E6 trisodium salt-induced photodynamic therapy inhibits the growth of pancreatic carcinoma in vivo.
A: Images of Panc-1 tumors at 14 d post-photodynamic therapy (PDT) [8 mg/kg (17R,18R)-2-(1-hexyloxyethyl)-2-devinyl chlorine E6 trisodium salt (YLG-1), intratumoral (IT) injection] with or without 100 J/cm2 illumination. B: The dynamic changes in pancreatic cancers treated by YLG-1-PDT over 14 d. C: Tumor volumes and weights at the indicated time. D: The hematoxylin and eosin staining of tumor sections acquired at 1, 2, and, 14 d post-PDT. Images were captured under a light microscope (magnification, 200×). The results are expressed as the mean ± SD (n = 3). aP < 0.05, bP < 0.01, and cP < 0.001 vs the Con group at the indicated time. YLG: (17R,18R)-2-(1-hexyloxyethyl)-2-devinyl chlorine E6 trisodium salt; PDT: Photodynamic therapy; IT: Intratumoral.
- Citation: Shen YJ, Cao J, Sun F, Cai XL, Li MM, Zheng NN, Qu CY, Zhang Y, Shen F, Zhou M, Chen YW, Xu LM. Effect of photodynamic therapy with (17R,18R)-2-(1-hexyloxyethyl)-2-devinyl chlorine E6 trisodium salt on pancreatic cancer cells in vitro and in vivo. World J Gastroenterol 2018; 24(46): 5246-5258
- URL: https://www.wjgnet.com/1007-9327/full/v24/i46/5246.htm
- DOI: https://dx.doi.org/10.3748/wjg.v24.i46.5246


