Copyright
©The Author(s) 2018.
World J Gastroenterol. Dec 14, 2018; 24(46): 5246-5258
Published online Dec 14, 2018. doi: 10.3748/wjg.v24.i46.5246
Published online Dec 14, 2018. doi: 10.3748/wjg.v24.i46.5246
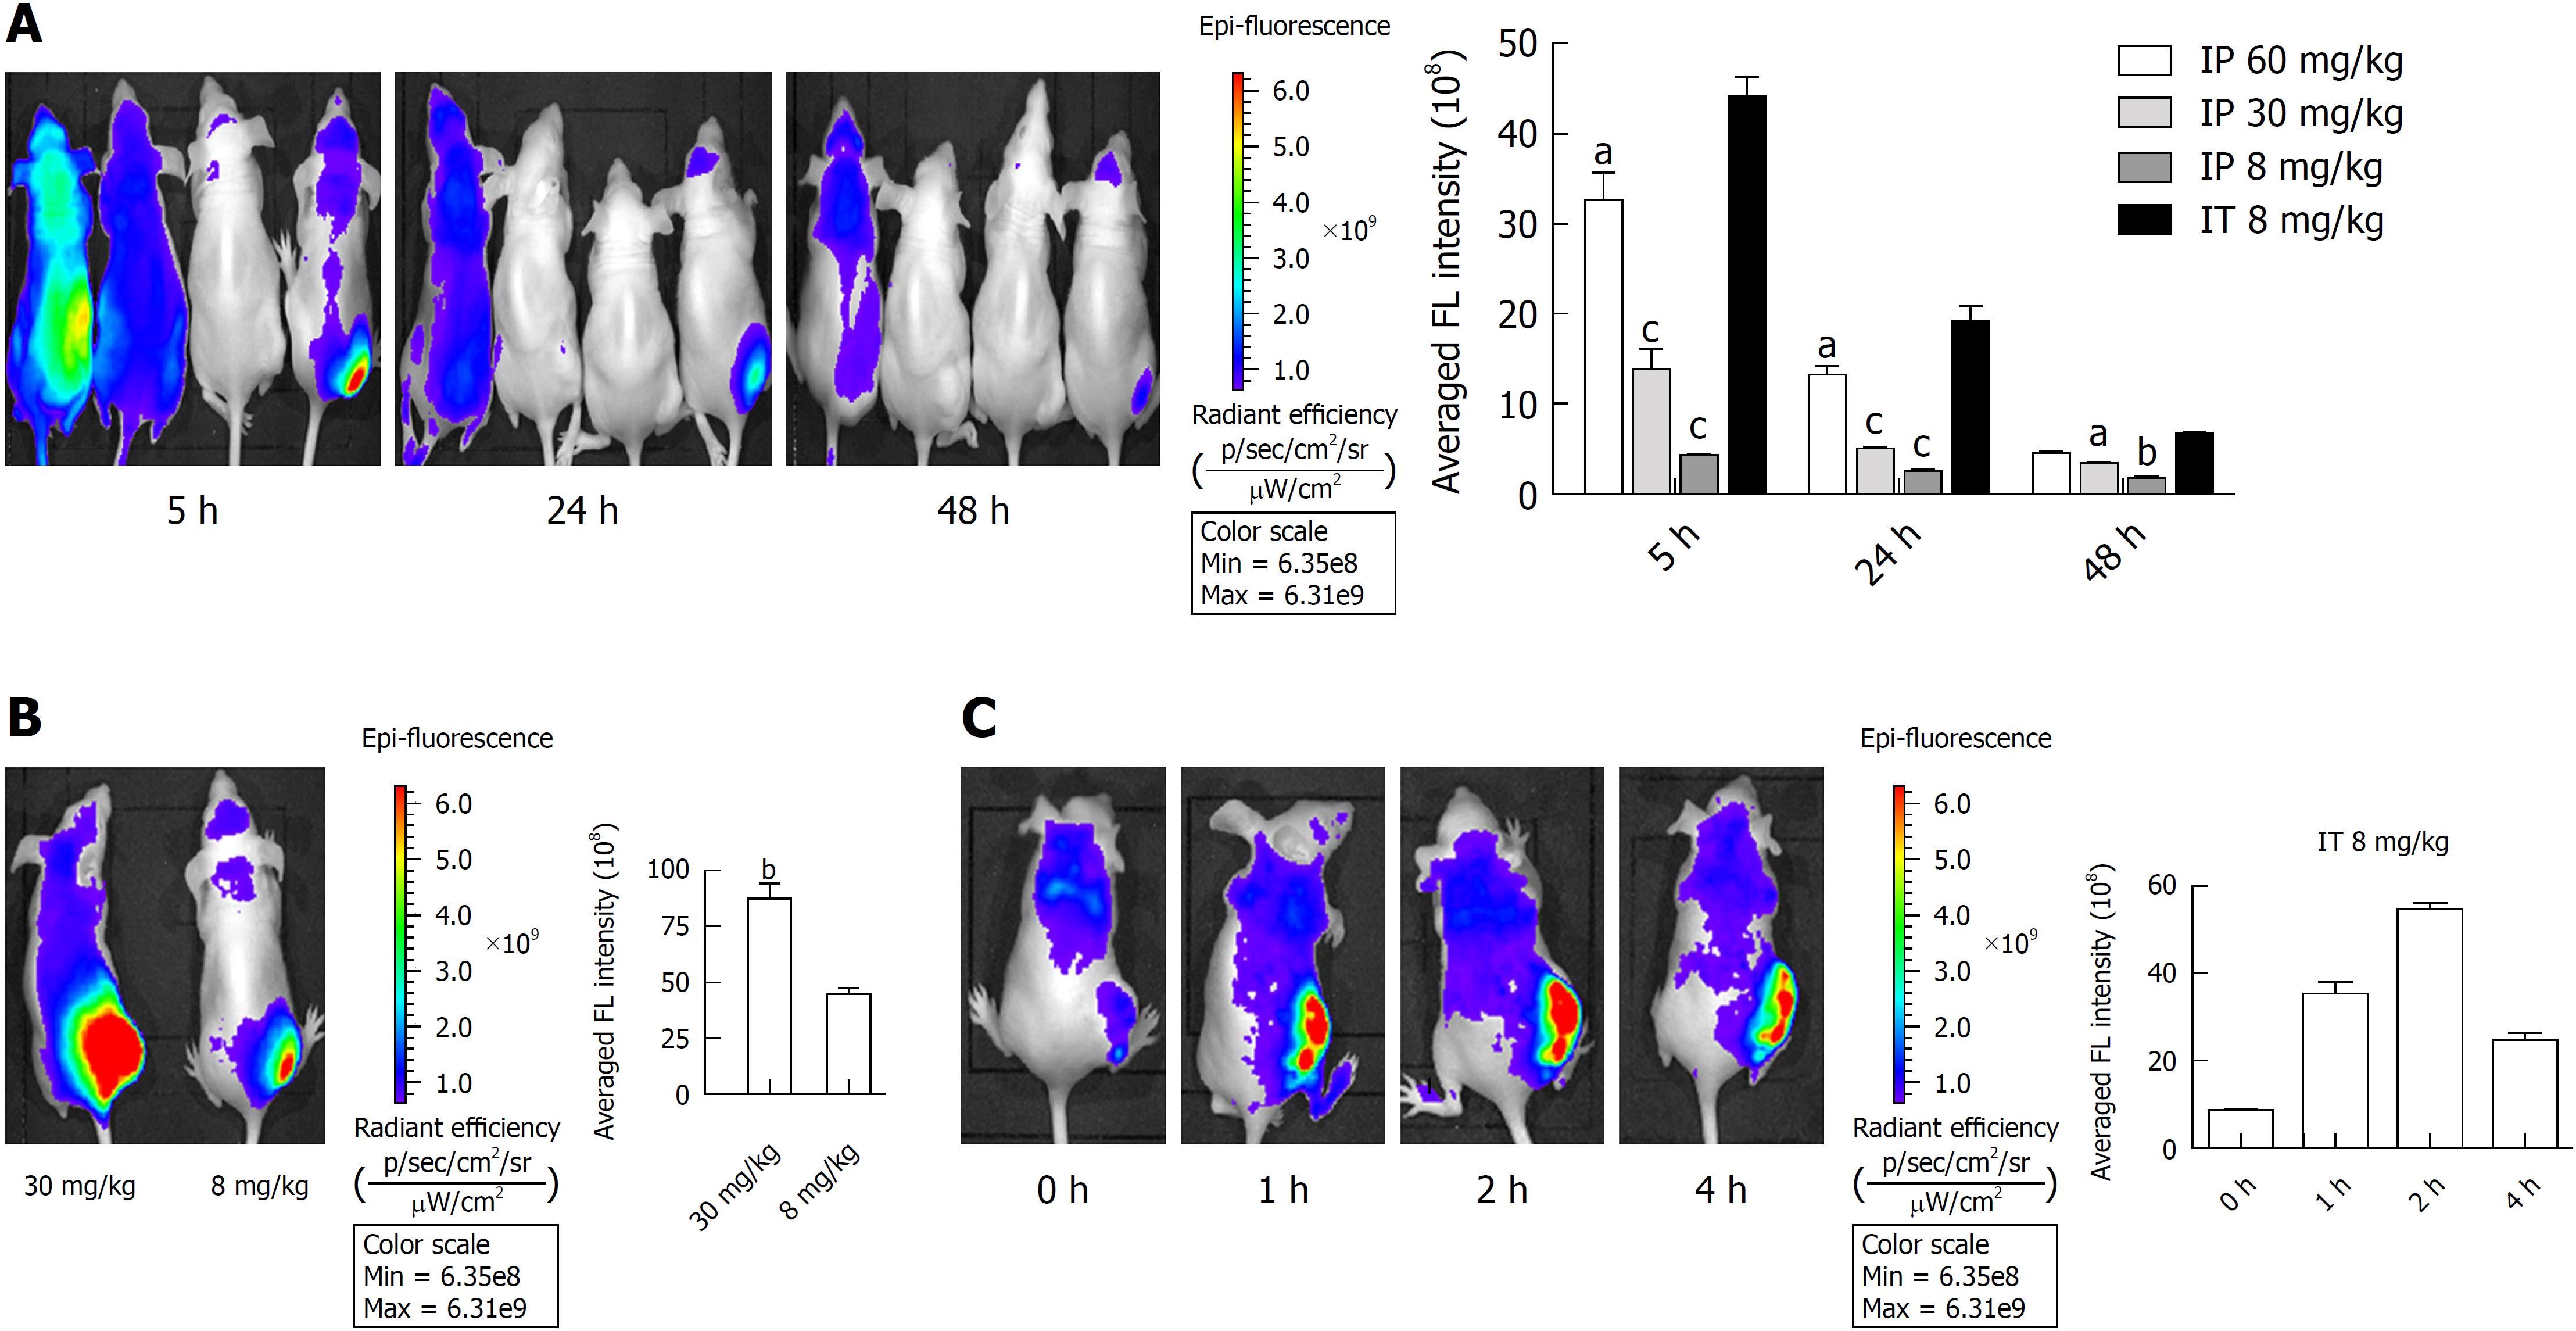
Figure 5 Biodistribution of (17R,18R)-2-(1-hexyloxyethyl)-2-devinyl chlorine E6 trisodium salt in vivo.
A: In vivo fluorescence (FL) images and quantitative evaluation of the Panc-1 tumor-bearing mice at 5, 24, and 48 h post-intraperitoneal (IP) or -intratumoral (IT) injection of (17R,18R)-2-(1-hexyloxyethyl)-2-devinyl chlorine E6 trisodium salt (YLG-1). Mice listed from left to right were respectively administered with 60, 30, and 8 mg/kg YLG-1 via IP injection and 8 mg/kg YLG-1 by IT injection. B: In vivo FL image and quantitative analysis of mice at 5 h after IT injection with 30 or 8 mg/kg YLG-1. C: In vivo FL images and quantitative analysis of mice at 0, 1, 2, and 4 h post-IT injection of 8 mg/kg YLG-1. The FL intensity of YLG-1 in the tumor site was quantified using the same color scale (min = 6.35e8 and max = 6.31e9). The data are shown as the mean ± SD (n = 3). aP < 0.05, bP < 0.01, and cP < 0.001 vs the corresponding IT injection group. YLG-1: (17R,18R)-2-(1-hexyloxyethyl)-2-devinyl chlorine E6 trisodium salt; FL: Fluorescence; IP: Intraperitoneal; IT: Intratumoral.
- Citation: Shen YJ, Cao J, Sun F, Cai XL, Li MM, Zheng NN, Qu CY, Zhang Y, Shen F, Zhou M, Chen YW, Xu LM. Effect of photodynamic therapy with (17R,18R)-2-(1-hexyloxyethyl)-2-devinyl chlorine E6 trisodium salt on pancreatic cancer cells in vitro and in vivo. World J Gastroenterol 2018; 24(46): 5246-5258
- URL: https://www.wjgnet.com/1007-9327/full/v24/i46/5246.htm
- DOI: https://dx.doi.org/10.3748/wjg.v24.i46.5246


