Copyright
©The Author(s) 2018.
World J Gastroenterol. Dec 7, 2018; 24(45): 5154-5166
Published online Dec 7, 2018. doi: 10.3748/wjg.v24.i45.5154
Published online Dec 7, 2018. doi: 10.3748/wjg.v24.i45.5154
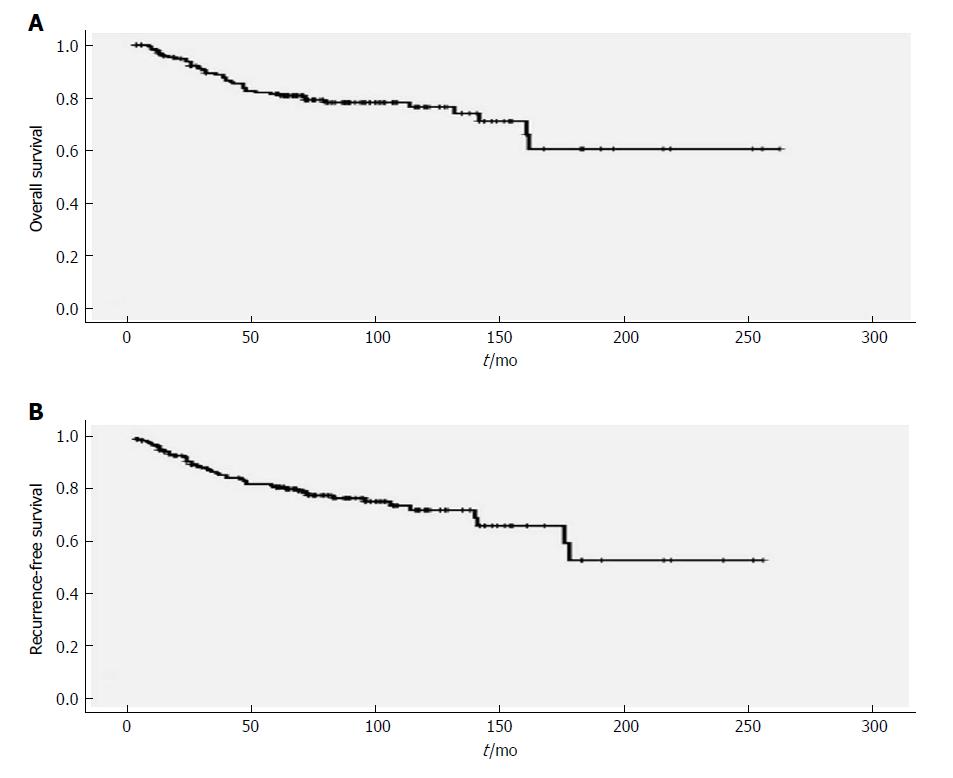
Figure 1 Survival curves of patients with pT1N0 esophageal squamous cell carcinoma.
A: Overall survival curve. The 5-year and 10-year overall survival rates were 81.4% and 76.4%, respectively. B: Recurrence-free survival curve. The 5-year and 10-year recurrence-free survival rates were 80.7% and 71.9%, respectively.
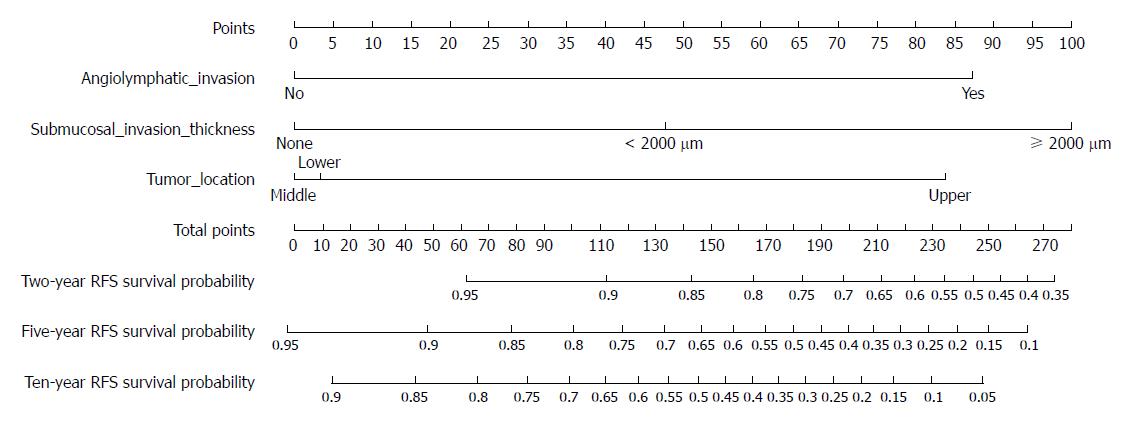
Figure 2 Nomogram for predicting the probability of recurrence-free survival of pT1N0 esophageal squamous cell carcinoma.
The nomogram has eight rows. The first row is the point assignment for each variable. For each individual patient, each variable is assigned a point value in accordance with the clinicopathological characteristics (rows 2-4, angiolymphatic invasion, submucosal invasion thickness, and tumor location) by delineating a vertical line between the exact variable value and the point assignment line. Thereafter, the Total Points (row 5) can be obtained by summing all of the assigned points for the three variables. Finally, the probability of 2-, 5-, and 10-year RFS (recurrence-free survival) can be predicted by drawing a vertical line between the Total Points and the probability rows (rows 6-8, respectively).
- Citation: Xue LY, Qin XM, Liu Y, Liang J, Lin H, Xue XM, Zou SM, Zhang MY, Zhang BH, Hui ZG, Zhao ZT, Ren LQ, Zhang YM, Liu XY, Yuan YL, Ying JM, Gao SG, Song YM, Wang GQ, Dawsey SM, Lu N. Clinicopathological parameters predicting recurrence of pT1N0 esophageal squamous cell carcinoma. World J Gastroenterol 2018; 24(45): 5154-5166
- URL: https://www.wjgnet.com/1007-9327/full/v24/i45/5154.htm
- DOI: https://dx.doi.org/10.3748/wjg.v24.i45.5154


